
Suppress
September 14, 2025 – Weekly comment
******************************************
There’s an old favorite cartoon of mine. The foreman is poking his head out of the Jury Room door, giving a lunch order to the bailiff: 11 turkey sandwiches, 1 tuna. 11 fries, 1 cole slaw. 11 Cokes, 1 Sprite.
Going into Wednesday’s FOMC, it doesn’t matter whether Lisa Cook votes or not. Or Stephen Miran for that matter. The market has settled on one 25 bp ease next week, and two more going into year end. Since the payroll report on 5-Sept, FFV5 settles have been 9595 or 9596. A cut of 25 bp will result in EFFR of 4.08%, and another 25 at the 29-Oct meeting will yield a final settle of 95.9335. Clearly we’ll get dissents for 50 on Wednesday. Perhaps that will cause pricing for the October and December meetings to become somewhat more forceful. Last week’s high in FFF6 was 9645 or 3.55%. From the current EFFR of 4.33%, cumulative 75 bps in cuts would be 3.58% or 9642. Another 25 at the 28-Jan meeting should result in a final settle of 9644.42.
Using the December contracts as the first red, first green etc, the SOFR red pack (Z6, H7, M7, U7) is still pegging ~3% as a terminal rate (9705 avg). I think it will shift to a higher price going into year end, targeting 2.5 to 2.75% with a small risk of moving closer to 2%. As a nod to the FOMC dots, the year-end 2027 projection for Fed Funds in June was 3.375%, having been revised higher from March which was 3.125%. SFRZ7 settle on Friday was 9697 or 3.03%. The two lowest dots for 2027 were 2.625%.
The more interesting aspect of trade last week was flattening of the treasury curve. On 2-Sept, as the market anticipated weak payrolls, 5/30 treasury spread printed near 124. It moved lower since, ending Friday at 105. 2/10 over the same period went from 63 to just above 47 on Thursday, ending the week slightly above 50. A BBG article citing an interview with PIMCO’s Daniel Ivascyn said the firm has been cutting back exposure to the steepener after a strong year. “It’s performed so well that our conviction level has come down” adding “…we have to be careful of surprises.”
The title of this note refers to just about everything these days: dissenting views, negative market signals, data, truth. I am more specifically thinking about it in terms of yields, especially at the long end / mortgage rates. Nothing addresses a housing ‘emergency’ like low financing rates. Maybe that’s a potential surprise to which Ivascyn obliquely referred.
The point is that the administration wants long end rates lower. They have the means to pull those levers. In the early April turmoil related to Liberation Day, the 10y yield low was 3.997%. Last week’s low equaled that level. The 30y low was 4.41 in April, but last week’s low was 4.637.
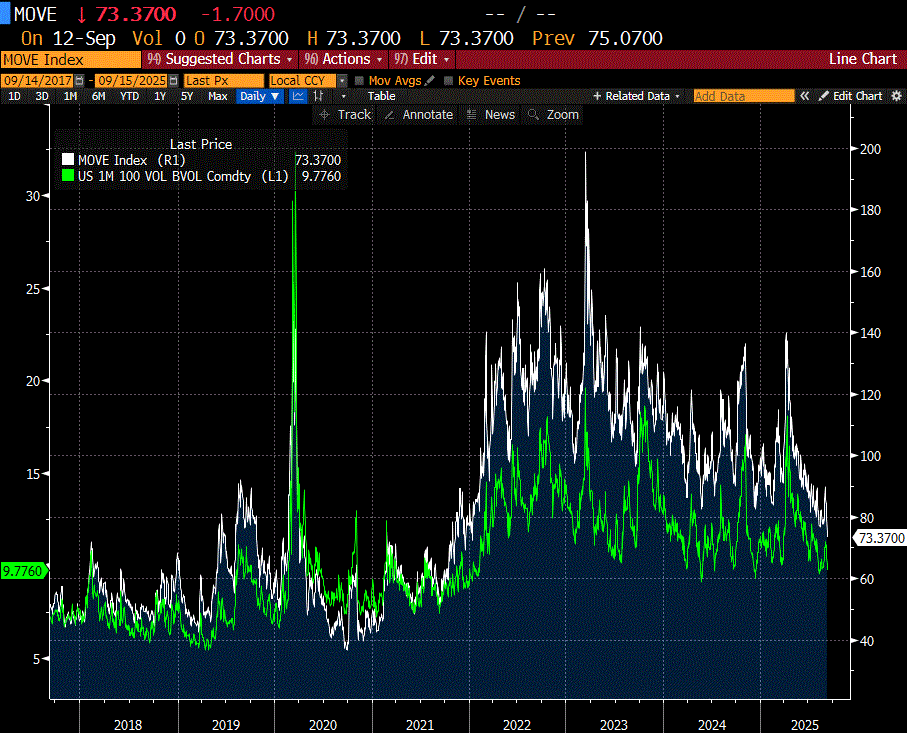
Below is a chart of the MOVE index in white with one-month US vol in green. At the end of the week. MOVE collapsed to the lowest level since early 2022, before the hiking cycle began. US vol also testing multi-yr lows. Another clue regarding suppression/control?
DXY (USD index) seems to reflect vulnerability based in part on this idea of suppressed long end rates. Of course, lower near-term rates are also a big factor, among other things. In January DXY was 110. Low of this year was in early July at 96.38. Current level is 97.55, with a southerly bias. My suspicion is that 100 is now a cap and we’ll likely be testing 92 and perhaps as low as 90 by Q1. If one big macroeconomic variable is suppressed, another one compensates.
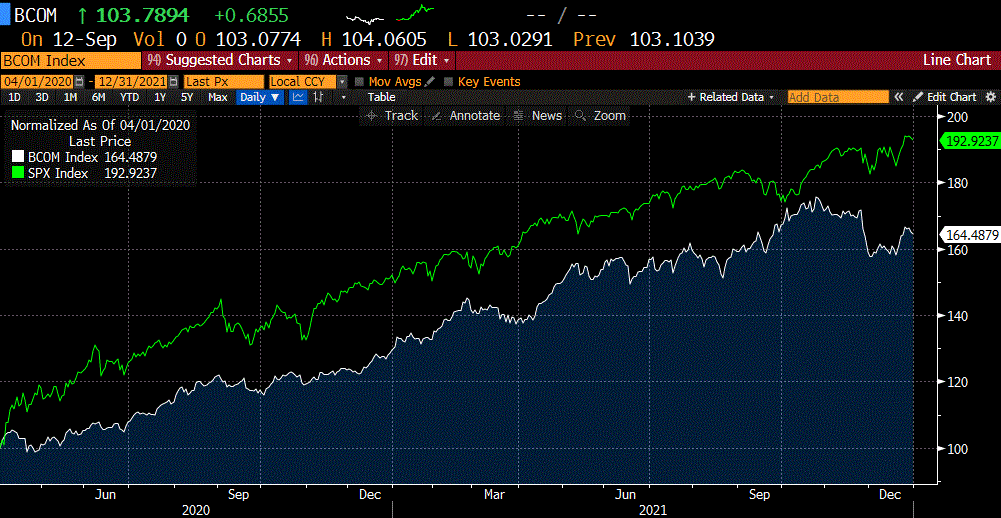
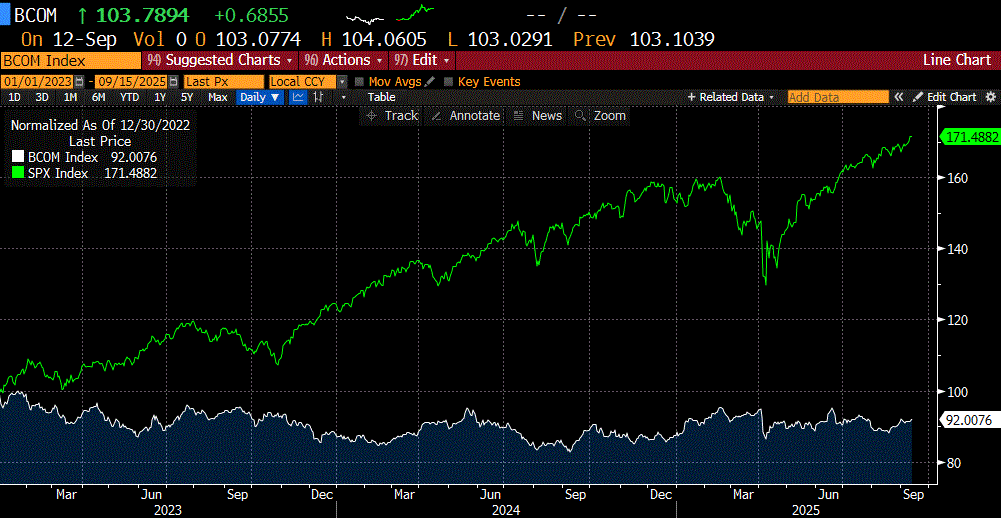
From the start of Q2 2020 to 03 2021 the BBG Commodity Index (BCOM) pretty much tracked SPX. I would point to that as an era of high-touch gov’t activism, suppression. Now look at the last two years. One might say I cherry-picked the start date of BCOM in 2020, as that’s when Crude Oil traded negative (in April 2020). Perhaps so, but there’s no denying that commodities in general have seriously underperformed stocks recently, even with the surge in precious metals. So that’s my call going forward, commodity outperformance on a RELATIVE basis vs stocks.
Below is SPX (green) and BCOM (white) from Q2 2020 through 2021.
The next chart is the same, but using a start date in 2023, up until present.
My question is what might the catalyst be that both pushes long-end yields lower, while also derailing stocks? I would guess that a rapid deterioration in the employment picture will fit the bill. But if things unfold that way, the market will again steepen the curve, anticipating a new proactive Fed.
As a last note, suppression and manipulation can occasionally cause unintended backlash. I was searching for scenes that capture that idea. I happened to recall the famous 1984 Super Bowl ad from Apple. I’m sure that ad is a lot older than many people reading this. In my opinion, it’s in stark contrast from tech was, or wanted to portray at that time, vs now. Revolution and original thought vs a more slender phone that can access and synthesize the ideas of others into a neat package (without thinking).
Today, we celebrate the first glorious anniversary of the Information Purification Directives. We have created, for the first time in all history, a garden of pure ideology—where each worker may bloom, secure from the pests of any contradictory thoughts. Our Unification of Thoughts is more powerful a weapon than any fleet or army on Earth. We are one people, with one will, one resolve, one cause. Our enemies shall talk themselves to death, and we will bury them with their own confusion. We shall prevail!

https://www.youtube.com/watch?v=2zfqw8nhUwA
Sorry, but I can’t see this side of AAPL under Tim Cook.
OTHER THOUGHTS/ TRADES
I was wrong about the upside for SFRU5, which settled 9597.5 for option expiration, almost ten lower than my estimate. However, I still perceive risk that an outsized move in the near term is much more likely to the upside rather than downside.
I can see buying SFRZ5 9687.5/9712.5cs for 0.5 as a disaster lotto ticket. (Settled 1.75/1.0 on Friday).
| 9/5/2025 | 9/12/2025 | chg | ||
| UST 2Y | 350.7 | 355.4 | 4.7 | |
| UST 5Y | 358.2 | 362.3 | 4.1 | |
| UST 10Y | 408.6 | 405.7 | -2.9 | |
| UST 30Y | 477.4 | 467.8 | -9.6 | |
| GERM 2Y | 192.7 | 201.6 | 8.9 | |
| GERM 10Y | 266.1 | 271.4 | 5.3 | |
| JPN 20Y | 264.3 | 263.8 | -0.5 | |
| CHINA 10Y | 177.0 | 179.5 | 2.5 | |
| SOFR Z5/Z6 | -73.50 | -68.00 | 5.50 | |
| SOFR Z6/Z7 | 8.0 | 7.5 | -0.5 | |
| SOFR Z7/Z8 | 20.5 | 18.5 | -2.0 | |
| EUR | 117.17 | 117.34 | 0.17 | |
| CRUDE (CLX5) | 61.46 | 62.42 | 0.96 | |
| SPX | 6481.50 | 6584.29 | 102.79 | 1.6% |
| VIX | 15.18 | 14.76 | -0.42 | |
| MOVE | 85.29 | 73.37 | -11.92 | |

