
Dec 31, 2017. Beans and Bonds
It was early summer 1988. I was working in the financial room at the Chicago Board of Trade, the old original trading floor that occupied the fourth floor of 141 W Jackson. The business canyon of LaSalle Street ends where it tees into Jackson Blvd, defined by the imposing façade of the art–deco CBOT. On the west side of LaSalle is the Chicago Fed, and directly opposite is the old Continental Bank Building, mirroring each other with huge columns supporting their pediments, the former Corinthian, the latter Ionic; a trinity of buildings and functions which defined Chicago’s financial district. The old trading floor was directly below the bas-relief carvings of the Mesopotamian trader holding sheaves of wheat and Native American holding stalks of corn on either side of the center clock.

(CBOT clock. It’s 9:46. Grains have been open for 16 minutes, and they will close in 3 ½ hrs. Civilized)
In 1980, an annex was tacked onto the back of the old building, and this housed the new state-of-the-art grain trading floor, for corn, wheat, oats, and the soybean complex, including oil and meal. The two buildings transitioned on the fourth floor in a corridor; when you got off the escalator or elevator, you would walk toward the west wall and either turn north to the drab financial room, or south to the sparkling new entrance of the grain room.
Anyway, it’s 1988, and I walk off the floor to grab a cup of coffee at about 9 am. And I’ll never forget all these old guys streaming onto the grain floor for the 9:30 opening bell. It just hit me all at once. The financial floor community was mostly in their 20’s and 30’s. These guys were older, some were actually hobbling onto the floor using canes, with grey hair and big yellow full membership badges on their trading jackets. When I got back to the desk, I said something like, “Holy cow, I’ve never seen so many people coming on to the grain floor!” Someone replied, “There’s a drought. They’re all coming back for a last hurrah to print money in the wild markets.”
Back in those days, I think a lot of the people at the Chicago Board of Trade thought that they were at the pinnacle of finance. It was either beans or bonds. There were actually guys that looked at that spread, as if they were the only two things worth trading in the universe. Beans in the teens was a rallying cry. In 1988, the front bean contract went from $6 to a peak of $11/bushel within a few months. Bull market!
How different things are now.
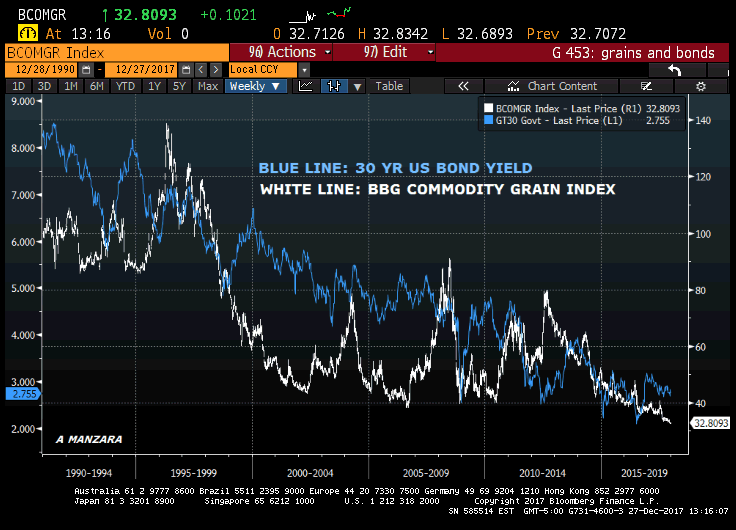
Both bonds and beans (grains) have dwindled. The Bloomberg Commodity (BCOM) Grain index is as low as it has been since 1990. The chart above is a bit disingenuous. Between 1990 and 1994 Corn was $2-$3/bushel, now it’s 3.50. Wheat was between $3 to 4, now $4.25. Beans were $5.50 now $9.50. So prices aren’t at new lows, but Bloomberg’s description of the index says it “reflects the return of underlying commodity futures price movements…”
Fast forwarding, and just looking at the 30-yr bond yield, in December 2008 during the heat of the crisis, the yield plunged to nearly 2.5%. In early 2015 as oil tanked, it traded just below 2.25%. The low was post-Brexit in the summer of 2016, at 2.10%. This year, in 2017, there have been 3 important lows in the last half of the year: 2.70 in June, 2.66 in Sept and 2.69 this month. A close below 2.60 would be a problem for shorts (Friday closed 2.74%). On the other hand, a close above this year’s high of 3.21 would indicate a long term bottom. Just circling back to the early years, the NOTIONAL coupon on the bond contract was 8%. And in the 1980’s, futures traded well below par. It wasn’t until 1999 that the CBOT announced it would change the underlying contract specs from an 8% to a 6% coupon. The last time the 30 year bond yield was above 8% was in late 1994.
In terms of the grains, there are many factors which hold down prices, most of which are way beyond my scope. Yields are much higher given advances in agricultural technology. There’s more global production. And of course, the government is involved with ethanol subsidies and crop insurance, both of which tend to accentuate production. On the other hand, the population of the globe continues to increase. Are prices correctly balancing these factors? That, I suppose, is the assumption we work with.
In the year 2017, both the ten year yield and the Bloomberg Commodity Index are essentially closing out at the same place they started. On 30-Dec 2016 the ten year yield was 244.5, and the BCOM was 87.50. On Dec 29, 2017, the ten year is 241.0 and BCOM 88.16.
I don’t think it’s going to remain this way in 2018. Inflation has been tame, wage growth tepid. However, the tax program should both spur growth and create a hole in the Federal budget. In spite of Fed hikes in 2017, the dollar is finishing the year near its low and looks set to weaken further. QT is advancing in the US, and this weekend Coeure of the ECB said, “Given what we see in the economy, I believe that there is a reasonable chance that the extension of our asset purchase program decided in October can be the last.” (Reuters).
I’m sort of using the ‘beans and bonds’ analogy the way economists use ‘guns and butter’. I am generally referring to ‘beans’ as commodities, and ‘bonds’ as US rates. That is, I think 2018 will be a year of accelerating inflation, and a year when commodities will rise up from being a doormat asset class. Note that copper and oil closed out the year on the highs. Bond yields should also rise for a variety of reasons, and may do so quickly.
Buy beans. Sell bonds.
