
Weight on Fives
September 26, 2021
We begin with a couple of notes from the NY Fed’s UIG report and Liberty Street Economics blog. First, the Underlying Inflation Gauge “full data set” is 3.8% for August, unch’d from July. The “prices only” measure increased 0.1% to 4.1%.
Second, from Liberty Street; ‘Have Consumer’s Long-Run Inflation Expectations Become Un-Anchored?’ I’ll spare you the suspense: the authors conclude that the answer is no. However, some notes on near term expectations are quite illuminating. Here is just one salient excerpt:
We see an increase in the median one-year ahead inflation expectation between July 2019 and April 2021 (from 2.92 percent to 3.24 percent), followed by a sharp rise (from 3.24 percent to 4.84 percent) in the four months that separated the April and August 2021 surveys. In the special surveys, respondents were also asked for the reason(s) that led to this sharp increase. Overwhelmingly, they mentioned it was driven primarily by their own experience with higher prices during that period.
In sharp contrast, the same table indicates that the median five-year ahead inflation point prediction remained unchanged at 3.00 percent between July 2019 and April 2021, and increased only modestly between April and August 2021 (to 3.16 percent).
For the five year survey, respondents are asked for an expectation over a one-year period, five-years forward, for example, “Over the 12-month period between August 2025 and August 2026.” If I had no knowledge and I were asked that question, I would first ask, “What are other people saying? What did the last survey have?” I might look at the price of my house over the past five years and just figure it’s one-fifth of that gain. The point is, it’s a tough question. On the other hand, over the last year, people are seeing inflation with their own eyes and wallets: “driven primarily by their own experience”. By the way, also from the survey, “…the proportion of respondents who expect inflation a year from now to be between 1% and 3% dropped from 41% in July 2019 to 18% in August 2021. Meanwhile, the proportion of respondents who expect inflation a year from now to be between 5% and 7% more than doubled (from 12% to 28%) during the same period.” Note that the SEP FOMC projection for PCE inflation at the end of 2022 increased by just 0.1 to 2.2%. Rather a large disconnect.
This means that over 80% of the respondents expect near-term inflation to be over 3%. Yet the authors blithely conclude that long term expectations remain anchored. That’s cute.
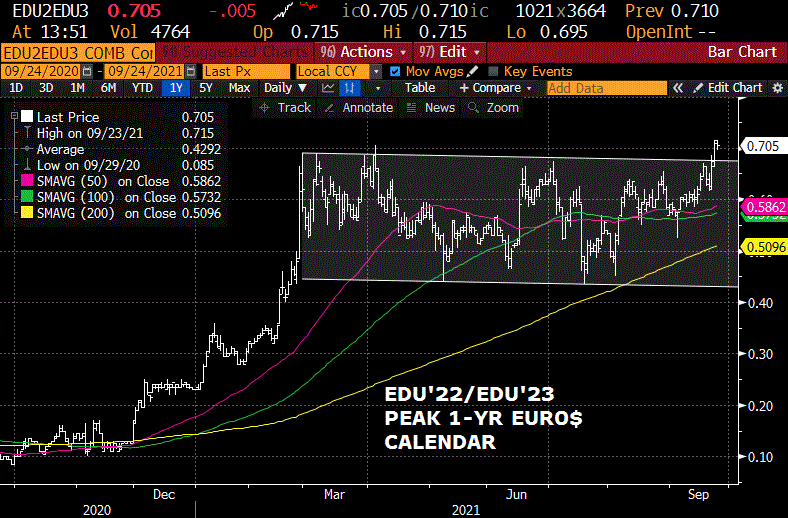
Now just a couple of words about price action. Two charts on the next page: Top is EDU’22/EDU’23 one-year calendar spread, which settled at 71, the high of the year. This is the peak one-year calendar on the strip, artificially high because Sept’22 is before the SOFR transition while Sept’23 is after. The other chart is the US five-yr treasury yield, with a notation about a large put buyer Friday.
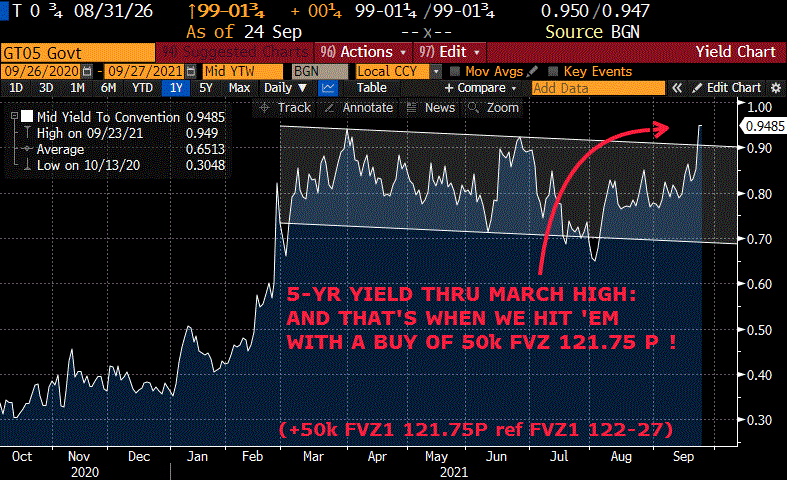
The specific FV trade was a new buyer of 50k FVZ 121.75 puts for 11.5/64’s when FVZ was trading 122-27. Settled 12.5 vs FVZ 122-2625 with -0.22 delta. On the previous Friday, there was a buyer of 50k FVX1 123.0 put for 17.5. These settled 28 on Friday.
In October of 2020, there were a couple of large trades in Blue March midcurves, buying put spreads and selling call spreads. For example a buy of 100k 3EH 9912/9900ps vs 9975/9987cs, 0.25 paid ps. This is what kicked off consistent action and interest in blue March and June midcurve puts. Of course, the real sell-off came in Feb and March. As it turns out, the bearish posture was correct, as was the timing. Now, all of a sudden we have large put buyers on FV options. The benefit of midcurves is that they allow a longer duration…there are only 22 lots open in FVH futures and no options on that underlying month. December options expire Friday, 26-Nov so only have nine weeks until expiry. Whatever the reason for these particular FV put buys, the timing for a change in perception is close.
When the Fed is thought to be on hold in the near term, it makes more sense to buy puts on forward years, like green or blue midcurves, because the first couple of years might be anchored by the zero bound. But consider the following sort of scenario: Taper ends by June and the inflation numbers have rocked higher as shelter costs filter into the data. The Fed could easily be forced into several hikes.
What do we have on the technical picture? The five year yield made a new high on the year, ending Friday at 95.5 bps. EDU22/EDU23 spread also edged to a new high at 71. Now this is NOT the highest a one-year spread has been in this calendar year; as noted last week that high was 78 bps.
In terms of back of the envelope calculations, the 121.75 strike is approx. 20-21 bps away. The option cost is equivalent to about 3.4 bps. For a rough comparison, EDZ3 settled 9882.5, or 1.175%. The November midcurve options on Z3 expire 12-Nov and Dec expire 10-Dec. Settles on the 9862.5p were 3.5 (2EX1P 9862.5) for November and 5.5 (2EZ1P 9862.5) for December. If Fed hikes are “in play” faster than the market currently anticipates, then the FV puts are a better buy.
By the way, total open interest in FV puts is only 213k in November and 175k in December. This compares to 491k and 448k in TYX and TYZ puts. The large recent buys in FV puts have not yet kicked open interest into high gear, as the year ago buys in blue March midcurves did, but I expect more action this week.
Here’s a big headline from Bloomberg on Sunday:
Tapering Doesn’t Mean Tightening for Central Bank Money Printers
That’s the Fed spin. The guy loading up on FV puts isn’t buying it.
OTHER MARKET THOUGHTS/ TRADES
Treasury auctions 2, 5 and 7 year notes this week starting Monday (2s & 5s) and ending Tuesday (7s) in size of $60, 61 and 62 billion.
PCE Core Deflator is Friday, 3.6% last, expected 3.5%.
The Fed’s Z.1 quarterly report was released last week. From Credit Bubble Bulletin:
Meanwhile, Household Financial Asset holdings are inflating wildly. Household Assets jumped $4.552 TN during the quarter to a record $113.149 TN, having more than doubled from 2009 trough $46.780 TN – as well as previous cycle peak $54.377 TN (Q3 ’07). Household Financial Assets to GDP ended Q2 at a record 498%, up from cycle peaks 374% (Q3 ’07) and 354% (Q1 2000).
Household financial assets 5x larger than GDP!! Ever hear of the wealth effect?
| 9/17/2021 | 9/17/2021 | chg | ||
| UST 2Y | 22.4 | 27.2 | 4.8 | w/I 30/29.5 |
| UST 5Y | 86.5 | 95.5 | 9.0 | w/I 97.5/97 |
| UST 10Y | 136.8 | 145.8 | 9.0 | |
| UST 30Y | 190.8 | 198.5 | 7.7 | |
| GERM 2Y | -69.5 | -68.6 | 0.9 | |
| GERM 10Y | -28.0 | -22.8 | 5.2 | |
| JPN 30Y | 65.2 | 67.4 | 2.2 | |
| CHINA 10Y | 287.9 | 286.9 | -1.0 | |
| EURO$ Z1/Z2 | 26.0 | 33.5 | 7.5 | |
| EURO$ Z2/Z3 | 63.5 | 65.5 | 2.0 | |
| EURO$ Z3/Z4 | 41.0 | 41.5 | 0.5 | |
| EUR | 117.29 | 117.21 | -0.08 | |
| CRUDE (active) | 71.82 | 73.98 | 2.16 | |
| SPX | 4432.99 | 4455.48 | 22.49 | 0.5% |
| VIX | 20.81 | 17.75 | -3.06 | |

