
Historic new lows in stir spreads
November 17, 2022
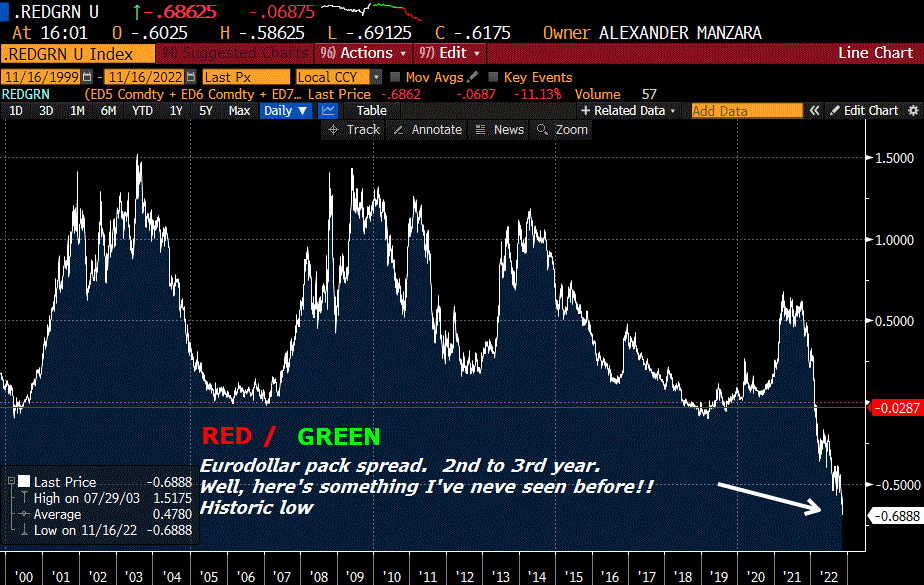
–Historic lows in a lot of STIR calendars. Example on attached chart is red/green euro$ pack spread at -69. In 2007 that spread barely went negative, at a time of true crisis. Currently the unemployment rate is near all-time lows, and the consumer seems to be “hanging in there…though pulling back” according to Mary Daly post-retail sales. I guess the difference is just inflation (and perceived forward changes) and war. Of course, Goldman updated their rate hike forecast, adding a May hike of 25, (50 in Dec and 25 in Feb, March and now May). And Daly added that “pausing is off the table right now” keeping a lid on near contracts while the backs rallied.
–EDM3/EDM4 fell another 4 bps to a new cycle low of -130.5 bps. White pack fell about 0.25 bp, Reds +2.25, Greens +9.25, Blues +8.25.
–The two-yr note yield was up on the day by 0.4 bp, while the thirty year bond fell 12 bps, sinking further below 4% to 3.86%. The 20-year bond auction saw strong demand; the wi was 4.06% late vs 4.185% on Tuesday.
–Three month libor yesterday set 4.67429, the highest since a brief spike in Oct 2008 up to 4.81 (In September 2008 it had been 2.81). SFRZ2/EDZ2 settled yesterday at 47.75 having recently been as high as 53. I guess the Fed’s robust regulatory framework ensures that there’s absolutely no chance that a financial crisis could spark a libor surge as that particular benchmark sails into the sunset. Right?
–In 2018, the last hike was in December to a peak of 2.25-2.50%. July of 2019 was the first ease. By the end of 2019 the target was 1.50-1.75%. In terms of timing in 2023, March/June calendar is +0.5 in SOFR and +1.0 in ED. However, June/Sept is -21.0 in SOFR and -26.0 in ED. Following the same timetable as 2019?

