
Fading the Fed’s Fantasy Forecasts
December 18, 2022 – Weekly Comment
History tells us that sharp reversals in confidence happen abruptly, most often with little advance notice. These reversals can be self-reinforcing processes that can compress sizable adjustments into a very short time period. Panic market reactions are characterized by dramatic shifts in behavior to minimize short-term losses. Claims on far-distant future values are discounted to insignificance. What is so intriguing is that this type of behavior has characterized human interaction with little appreciable difference over the generations. Whether Dutch tulip bulbs or Russian equities, the market price patterns remain much the same.
We can readily describe this process, but, to date, economists have been unable to anticipate sharp reversals in confidence. Collapsing confidence is generally described as a bursting bubble, an event incontrovertibly evident only in retrospect. To anticipate a bubble about to burst requires the forecast of a plunge in the prices of assets previously set by the judgments of millions of investors, many of whom are highly knowledgeable about the prospects for the specific companies that make up our broad stock price indexes.
-Alan Greenspan, Jackson Hole Aug 1999
SF Fed’s Mary Daly on Friday: “I don’t know why markets are so optimistic about inflation.”
There’s an age-old tension regarding Fed policies being behind or ahead of the curve. Markets occasionally act with total disregard to the utterings of Fed officials, even the most powerful.
Greenspan’s Jackson Hole speech in 1999 is a case in point. From the end of 1998 to July 16, 1999, the Nasdaq Comp rose about 800 points, from 2166 to 2864, around 37%. At the end of August, it had pulled back slightly to 2739. By March 10, 2000 it had almost doubled to 5048! Then the declines came, but it still took until November of 2000 just to get back to the level when Greenspan made the original speech. Greenspan was right, in sort of an academic sense. It’s hard for the central bank to argue with “prices of assets set by the judgments of …highly knowledgeable” investors. Like those sponsoring FTX.
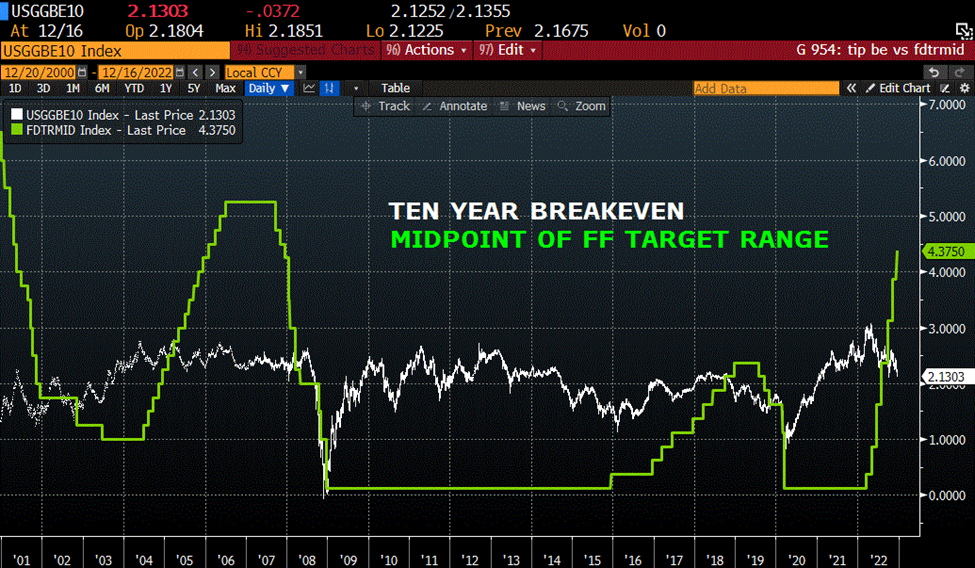
Mary Daly was out there trying to emphasize the Fed’s resolve on inflation. Loretta Mester echoed the message, saying the Fed will need to keep rates above 5% next year. On Friday the 5y breakeven was 219 bps, having been as high as 373 at the end of March. The 10y breakeven ended at a new low for the year at 213 bps, with a high of 304 in April. That’s back around the levels for 2018, when the Fed achieved a peak FF range of 2.25 to 2.50%. It appears as if a FF target above the long-term breakeven rate is restrictive, as the chart below shows.
On Wednesday, the day of the FOMC, EFFR set 383 bps. On Thursday it was at the new target of 433. That rate is above every yield on the treasury curve from the 2y out. That’s another indication of a restrictive rate. In my opinion, the logical extension is that high short-term rates are prohibitive to longer term economic projects.
Daly and Mester are yearning for the 2006 to 2007 experience, when the FF target reached 5.25% in June of 2006 and stayed there until September of 2007. However, US interest rate markets are blatantly ignoring them. The lowest FF future, representing peak rates, is May’23 (FFK3), which settled 9516 or 484, just 51 bps above the new EFFR. By January of ’24 the price is 9565.5 or 434.5 almost exactly at the current EFFR. On the SOFR curve the low contract is March’23 at 9519.5 or 480.5, which was actually UP 5 bps on the day and 11 on the week (9508.5 to 9519.5). By the end of the year the Dec’23 contract is 9575.0 or 4.25%. Mary Daly said the Fed is prepared to hold the peak rate for 11 months. The market is more or less in agreement with THAT idea, if the peak rate is the one that was set last week. Why is the market optimistic on inflation? Take a look at the annual growth rate of M2 (at just 0.8% last).
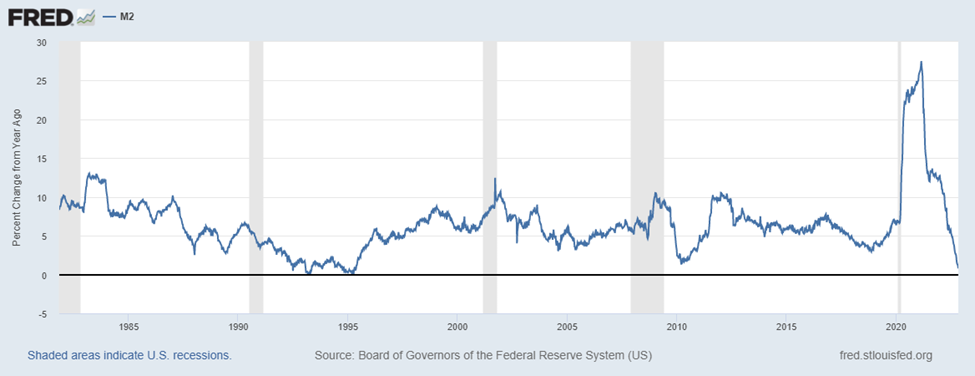
There are a lot of reasons one can point to for inflation, but if it “is always and everywhere a monetary phenomenon…” as expounded by Milton Friedman, then the rapid deceleration of M2 means something. Maybe Friday’s release of S&P Composite PMI at the year’s low of 44.6 is also a clue.
This week features housing data on Monday, Tuesday and Wednesday. New Housing Starts are expected 1400k, near the year’s low of 1377k. Existing Home Sales on Wednesday. The high level of the year was set right at the start of 2022, at 6.65 million. The last data was 4.43 million and the survey shows an expectation of only 4.2 million. (The covid low was 4.07 million). Last month’s 4.43 was the lowest since 2011. On Friday we get the all-important PCE price data, expected 5.5% with Core 4.7%. If the Core estimate is correct, it’s less than 40 bps above EFFR. If the Fed were to hike another 25 bps at the Feb 1 FOMC (which is indicated by the Feb’23 FF contract at 9536.5), then it’s highly probable that Core PCE will decline below EFFR sometime by the middle of next year. In fact, the Fed’s fantasy dot plot has Core CPI for the end of 2023 penciled in at 3.5%, with a FF rate at 5.1%. If that were to come to pass, it will be a year of misery in equities.
OTHER MARKET THOUGHTS/ TRADES
Nasdaq Comp ended the week at 10705. That’s down over 31% ytd. The low in the first half of the year was set in June at 10646. The low of the year so far has been 10321 on October 14, so we’re now only 3.7% above the low. It’s not very common for the low of the year to be set in December, though of course it recently occurred in 2018. Before that, in the GFC year of 2008 the low was set in November. In the year 2000, the year after the Greenspan Jackson Hole speech cited at the top of this note, the low of the year was 2333 on Dec 20, a more than 50% drop from the then all-time-high set in March.
Call spreads in SOFR have been popular buys, even with the inversion already present. SFRZ3 settled exactly at 9575 or 4.25%. The 9500p or 5% strike, settled 20.75. The equidistant 9650c settled 24.50, just another market signal that easing will be much more likely than tightening by the end of next year.
| 12/9/2022 | 12/16/2022 | chg | ||
| UST 2Y | 432.8 | 417.8 | -15.0 | |
| UST 5Y | 375.3 | 361.4 | -13.9 | |
| UST 10Y | 356.7 | 347.9 | -8.8 | |
| UST 30Y | 354.7 | 353.1 | -1.6 | |
| GERM 2Y | 216.0 | 242.3 | 26.3 | |
| GERM 10Y | 193.3 | 215.2 | 21.9 | |
| JPN 30Y | 140.1 | 146.9 | 6.8 | |
| CHINA 10Y | 292.1 | 291.4 | -0.7 | |
| SOFR H3/H4 | -93.0 | -100.5 | -7.5 | |
| SOFR H4/H5 | -97.0 | -89.5 | 7.5 | |
| SOFR H5/H6 | -9.0 | -8.0 | 1.0 | |
| EUR | 105.34 | 105.87 | 0.53 | |
| CRUDE (CLf3) | 71.02 | 74.29 | 3.27 | |
| SPX | 3934.38 | 3852.36 | -82.02 | -2.1% |
| VIX | 22.83 | 22.62 | -0.21 | |

