
Was Q3 GDP the high point?
October 29, 2023
******************
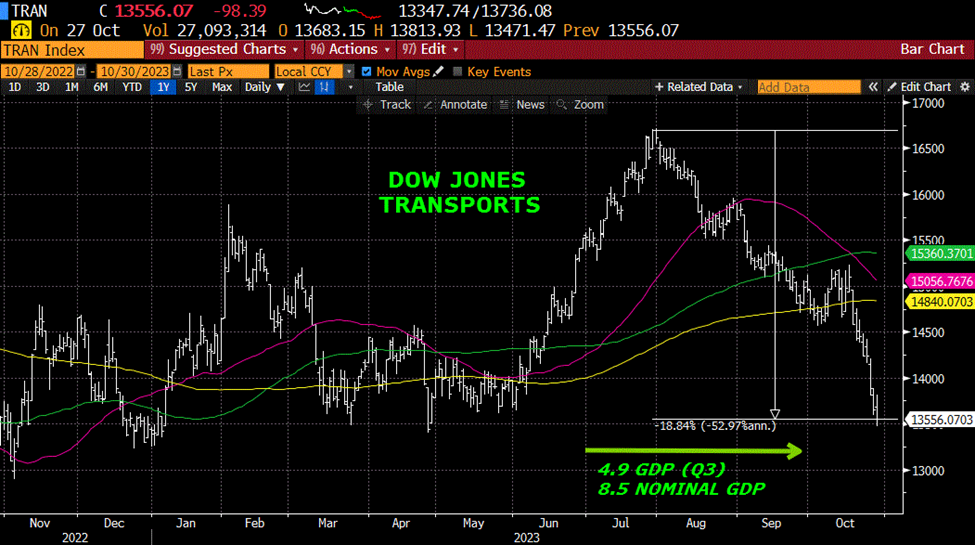
Below is a chart of Dow Jones Transports. In the three months since the last day of July, it’s down 19% in the context of +4.9% real GDP and 8.5% nominal growth (Q3). Does that make any sense?
On Dec 30, 2022 DJT closed 13392. Friday 13556. Almost unchanged ytd. (YTD SPX +7.7% and Nasdaq Comp +21.7%). New lows in major airlines AAL, UAL, DAL, LUV, JBLU. Rails CSX and UNP are down 5.6% and 2.6% ytd. Landstar is at a new low, around flat on the year, while JB Hunt is down 4.8% ytd. FDX has bucked the trend, up about 30% on the year, but UPS has plunged to a new low, -23% ytd.
Going into Wednesday’s FOMC, what dominates? The supposed acceleration indicated by GDP, or the price action of transports? As Richmond Fed’s Tom Barkin said recently, the data don’t match what he is hearing from business contracts (softening conditions). The Fed is widely expected to hold rates at this meeting, and current pricing suggests the Fed is done, period. Lowest contracts on the curves are SFRZ3 at 9458.5 and FFG4 at 9459.5, only about 8 bps higher in yield than the current EFFR at 5.33%. Every contract from SFRH4 (9467.5) forward, is below current EFFR.
This is a big week. Bank of Japan, Quarterly Treasury Announcement, FOMC, Employment report.
The 10y JGB ended the week at a new high 87.5 bps, nearing the 1% hard cap. Expectations are that the BOJ will maintain the current cap, though an increase in the YCC cap to 1.5% is a possibility (Oct 31). Such a move would likely destabilize global bond markets further.
On Wednesday, Nov 1 at 8:30, the Quarterly Refunding Announcement is released. This report has taken on added significance in an era of surging deficits (though Yellen points to a strong economy rather than boatloads of supply as a key factor for higher long-end rates). At the October 12 thirty-yr bond auction the yield jumped after weak results (3.7 bps tail to 4.837, low bid/cover). At futures settle the 30y yield was 4.87%, up 14 on the day. The next 30y auction is November 9, preceded as always by threes and tens. On Friday the 30y yield was 5.02% at futures settle. (USZ3 109-16, WNZ3 112-17).
JOLTS also on Wednesday, expected to be 9265k vs 9610 last, from a high of 12027 in March 2022. The labor market is clearly decelerating. Many FOMC members have cited heightened uncertainties. While there will be no change in the FF target at the Wednesday afternoon meeting, I think Powell would like to maintain the option for further hikes, if for example, oil ramps up to new highs or other supply shocks develop. The Employment report is Friday.
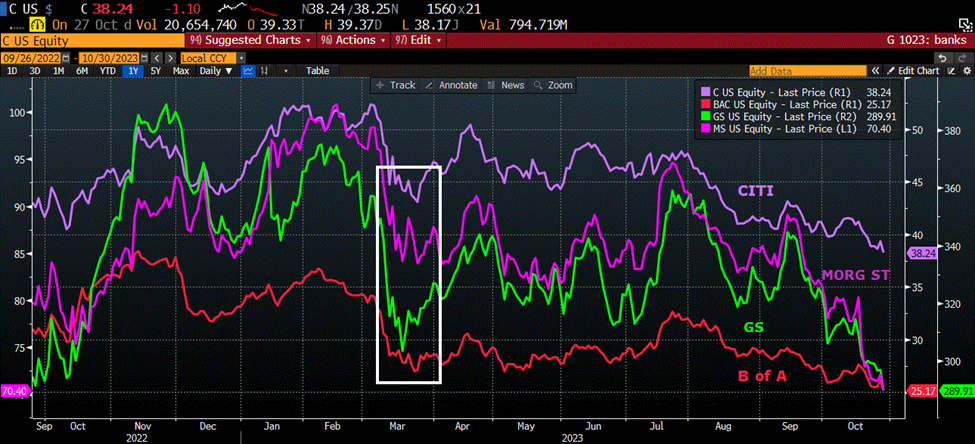
The major risk going forward is a bear steepening curve accompanied by lower equities. After the 2004/2006 hiking cycle, the high yield in the 30y was ultimately 5.40% in June 2007. This cycle high has been 5.11% so far. Note that major banks continue to make new lows, hinting that the March ‘regional banking crisis’ was just a dry run. As an illustration, the chart below includes Citi, BofA, Morgan Stanley and Goldman. The box captures March turmoil. All four examples are below March lows.
OTHER THOUGHTS/ TRADES
On Bloomberg, the syntax has changed for constant maturity contracts. ED17 used to be the first gold euro$ contract. Now SFR18 is the first gold, currently SFRZ’27. This contract settled 9563.5, its low settle in October was 9544. The yield associated with 9563.5 is, of course, 4.365%. It’s a lower yield than anything on the treasury curve. My experience is that blue/gold SOFR calendars move directionally with 10/30 on the treasury curve. I watch the first red to the first gold as a (very rough) proxy for 2/10. Currently, 2/10 is -17 and SFRZ4/SFRZ7 is -20. The point is that the first gold, (1st contract, 5 years forward), does not trade like a five-year treasury. It has a much longer duration.
In a broader context, it’s worth looking at midcurve puts on blues and golds. Every contract from SFRH’25 to SFRH’28 is between 9590 and 9558, a fairly flat forward curve. Five percent golds? Why not.
| 10/20/2023 | 10/27/2023 | chg | ||
| UST 2Y | 504.8 | 501.2 | -3.6 | |
| UST 5Y | 484.8 | 476.9 | -7.9 | |
| UST 10Y | 491.8 | 484.3 | -7.5 | |
| UST 30Y | 507.8 | 502.1 | -5.7 | |
| GERM 2Y | 312.2 | 303.7 | -8.5 | |
| GERM 10Y | 288.9 | 283.2 | -5.7 | |
| JPN 20Y | 163.1 | 166.4 | 3.3 | |
| CHINA 10Y | 270.6 | 272.0 | 1.4 | |
| SOFR Z3/Z4 | -78.5 | -85.0 | -6.5 | |
| SOFR Z4/Z5 | -39.5 | -46.5 | -7.0 | |
| SOFR Z5/Z6 | 9.0 | 10.0 | 1.0 | |
| EUR | 105.96 | 105.64 | -0.32 | |
| CRUDE (CLZ3) | 88.08 | 85.54 | -2.54 | |
| SPX | 4224.16 | 4117.37 | -106.79 | -2.5% |
| VIX | 21.71 | 21.27 | -0.44 | |

