
China is a wildcard
November 28, 2022
–Protests in China are a wildcard, with risks to both supply chains and global growth (the latter indicated by CLF3, below $74/bbl this morning, -2.32).
The NY Fed puts out a supply chain pressure index; pressures have been easing.
https://www.newyorkfed.org/research/policy/gscpi#/interactive
From the last report, “…pressures increased moderately in October after five consecutive months of easing. …The October increase was driven by upward pressures from Taiwan delivery times, Taiwan purchases, Asia outbound air freight, and UK backlogs.”
–Obviously the Fed doesn’t change policy based on China/Taiwan, but possible impact creates a new range of scenarios, and likely tilts trades toward safe havens, especially going into year-end.
–Friday featured new lows in 2/10 treasury spread at -77.5, the twelfth lower day in a row. Red/green euro$ pack spread new historic low at -80 bps. For a while, June’23/June’24 was the lowest 1-year calendar. It has moved forward now to Sept’23/Sept’24 at -136 (in both ED and SOFR) which reflects a ‘higher for longer’ view of the Fed.
–Williams speaks today. Powell on Wednesday.
Inversion accentuated
November 27, 2022- weekly comment
Last week I highlighted two market themes. First, was buying of otm call spreads in SFRU3, namely the 9700/9800 call spread for 4.25 to 4.5. This week that ripple turned into a small wave with significant buying of Z3 and H4 call spreads in SOFR.
The other feature I noted was a new high in SFRZ2/Z3/Z4 butterfly which had settled at a new recent high level of +108. Last week (11/18) SFRZ2 settled 9545 which was -4.0. SFRZ3 9544.5 -22.5 and SFRZ4 9652.0 -4.5. Dec’22 and Dec’24 were down a bit, but Z’23 was hammered on a relative basis.
On Friday 11/25, the SFRZ2/Z3/Z4 fly settled at a new high of 124.25. However, net changes on the week reflect a different story. SFRZ2 settled 9543.25 down just 1.75 on the week. SFRZ3 9544.0, down 0.5. SFRZ4 was the driver at 9558.5, UP 16.5.
First, I will briefly cover the call spreads.
SFRU3 9700/9800cs traded a bit more, settled 4.25 ref 9514.5. OI in both strikes >65k
SFRZ3 9625/9725cs settled 17.75 ref 9544, OI in both strikes +20k on the week
SFRZ3 9700/9800cs settled 8.25 ref 9544, OI in both strikes +40k
SFRH4 9700/9800cs settled 16.0 ref 9584.5, buying on the week >50k 14.5 to 15.5.
The theme is for a much lower FF target in 1 to 1.5 years.
Of greater significance is the message from the one-year butterfly.

On the week ending Nov 18, SFRZ’23 was hit (-22.5) because the Fed is clearly saying a pause is NOT in the cards. The minutes released this week indicate a slowing in the pace of hikes, but perhaps a higher peak. The lowest contract on the SOFR curve is June’23 at 9500, exactly at 5%. The low in that contract is 9475.5, made in the beginning of November (11/4). The market is comfortable with a peak rate projection of 5% or perhaps slightly more. Downside in front contracts seems limited from here.
What changed this week to push the fly higher? The change is in the back end of the curve. SFRZ’24 was UP 16.5 on the week, while Z’22 and Z’23 were essentially unch’d. The market is projecting 5% as an approximate terminal rate, but the concern is that funding at that level will become stifling. SFRZ3/Z4 was -20.5 at the start of June. On Friday it settled -124.5, over 100 bps further inversion in less than six months.
Indeed many curve trades are at historic inversions. For example, 2/10 closed Friday -77.5. According to my (2:00 pm CST) marks, that is the twelfth day in row at a lower level. Have to go back to 1981 to see a more negative print. The red/green pack spread in ED settled just below -80 (same in SOFR). That too, is a historic low.
Does it make sense for SFRZ’24 to be at a rate of 3.315%? The five-yr treasury ended at 3.884, down 11.2 bps on the week, while tens ended 3.698, down 11.8. The market continues to price longer term inflation at lower levels and is signaling a large deceleration in growth. It doesn’t pay to fight the trend. The question is whether the inversion accelerates going into the Dec 14 FOMC. CPI will be released the day before, on December 13.
This week the major economic data are released Thursday and Friday. However, NY Fed’s Williams speaks at the Economic Club of NY on Monday, and Powell discusses the economic outlook midday Wednesday. On Thursday, the Fed’s preferred measure of inflation, CORE PCE prices are expected 5.0 from 5.1%, with headline yoy expected 6.0 from 6.2. ISM Mfg is also on Thursday, expected 49.8 from 50.2. It hasn’t printed sub-50 since May 2020 during COVID. Friday features the employment report with NFP expected 200k from 261k.
My guess is that peak pressure on the curve will occur prior to Powell’s speech on Wednesday. I would look to cover shorts or take a shot at buying red/green spreads before the data at end of week, which I suspect will show cracks.
OTHER MARKET THOUGHTS/ TRADES
There is some talk of loosening financial conditions which the Fed might want to lean against. Dudley, the previous NY Fed chief, had five inputs: short and long term interest rates, the value of the dollar, equities and credit spreads. Goldman’s index GSUSFI has eased since early October. The Chicago Fed puts out a weekly chart on financial conditions, also easing, here’s a link:
https://www.chicagofed.org/publications/nfci/index
Clearly equities have firmed, long rates have declined slightly, the dollar index has fallen and is at an interesting level. I don’t know if VIX is incorporated into the Chgo Fed index, but at 20.5 it’s near the low of the year (16.60 in January) having recently peaked at 33.6 on Oct 12. VIX is not my focus, but I am highly tempted to buy UXZ2 vs sell UXF3 spread which is at a recent extreme of 2.52, having been 1.00 a month ago. SPX is testing the 200 DMA at 4057, and has failed that MA in April and August. SPX has not been above the 200 DMA since early April. Likewise DXY is testing the 200 DMA at 105.33 (close Friday 105.96). DXY has not been below the 200 DMA since June 2021. The 38.2 retrace from June’21 low to Sept’22 high is 105.15. The 50% retrace from this year’s low in Jan to the high is Sept is 104.70. I believe the value of USD is a big determinant of financial conditions, and though it has recently weakened, it’s near major support.
| 11/18/2022 | 11/25/2022 | chg | ||
| UST 2Y | 451.0 | 447.3 | -3.7 | |
| UST 5Y | 399.6 | 388.4 | -11.2 | |
| UST 10Y | 381.6 | 369.8 | -11.8 | |
| UST 30Y | 392.7 | 375.0 | -17.7 | |
| GERM 2Y | 210.5 | 220.5 | 10.0 | |
| GERM 10Y | 201.4 | 197.9 | -3.5 | |
| JPN 30Y | 140.2 | 147.8 | 7.6 | |
| CHINA 10Y | 283.0 | 284.0 | 1.0 | |
| SOFR Z2/Z3 | 0.5 | -0.8 | -1.3 | |
| SOFR Z3/Z4 | -107.5 | -124.5 | -17.0 | |
| SOFR Z4/Z5 | -28.5 | -23.5 | 5.0 | |
| EUR | 103.26 | 104.00 | 0.74 | |
| CRUDE (CLf3) | 80.11 | 76.28 | -3.83 | |
| SPX | 3965.34 | 4026.12 | 60.78 | 1.5% |
| VIX | 23.12 | 20.50 | -2.62 | |
Vol bid in treasuries, lower VIX, as curve inverts to new lows
November 26, 2022
–Wednesday was the tenth day in a row that 2/10 ended lower. It closed just under 77 having printed as low as -80. On Nov 9, I marked 2/10 at -47.7 while BBG has -49.3. In any case it’s a drop of around 30 bps in two weeks. Dec 14 FOMC is two and a half weeks away. [My marks are at 2:00 CST, futures settle]
–Headlines out of Fed minutes: ‘most Fed officials favor slower tightening pace soon and various Fed officials see higher peak rates’. Result…more inverted curve with the inflection point moved slightly further forward.
–Red/green (2nd to 3rd year) euro$ pack spread settled at a new historic low of -78. Red/gold pack (2nd to 5th year) spread closed just under -83.0. The most inverted 1-yr calendar on the SOFR (and ED curve) is now Sept’23/Sept’24 at -138. The lowest CONTRACT on the SOFR curve is SFRM3 at 9498.5 or 5.015%. Current Fed Effective rate is 383. So the difference between current EFFR and June SOFR (7 months forward) is 118.5. In the following year, with M3/M4 -126.5, that tightening is expected to be reversed…and then some. When viewed in the context of these inverted spreads, the creative finance packages being offered by mortgage lenders make a lot of sense (“We’ll pay 1% of your mortgage rate for a year”). If dollar curves (and forward yields) are correct, then it’s likely rates will fall by over a percent, which provides a refi opportunity.
–Vol bid in rates. On Monday TYH 112.5^ settled 3’35. On Wedneday atm 113^ settled 3’44 (ref 113-08).

They say don’t fight the Fed
November 23, 2022
–They say don’t fight the Fed, and they’re not, at least at the very front end. SFRH3 was -2.5 to 9497.5 yesterday or 5.025% in front of this afternoon’s Fed minutes. FFF3 settled 9561.5, down 1.0. Current Fed Effective is 383, so a 50 bp hike would take EFFR to 433 or 9567.0; FFF3 moved ever so slightly closer to a 75 hike rather than 50. A pretty valiant stand at the front lines, but the market is attacking the right flank. Huge call spread buying continues in back SOFR.
SFRZ3 9625/9725cs 17 paid for 15k. 9700/9800cs 9.25 for 4k
SFRU3 9700/9800 4,5 for 5k
SFRH4 9700/9800 15.5 for 5k
SFRF3 9537.59562.5 2×3 1.5 paid for 12.5k
–Vol firming on move to lower rates in back part of curve and in ED/SOFR. Could systemic issues be lurking? A couple of days ago TYH 112.5^ trade 3’33. On Monday it settled 3’35 and yesterday the atm 113^ settled 3’40. Not the normal weekend holiday trade.
–New lows in curve spreads as the ten-year yield fell 7 bps. For example, 2/10 fell to a new low, down over 6 bps to -76.0. Red/green eurodollar pack spread also posted a new historic low of -75.375. SFRZ2/H3 three-month calendar settled positive 44.5, allowing for a hike at the Feb 1 FOMC…it’s the highest three month spread (9542.0/9497.5). What a difference a year can make: SFRZ3/SFRH4 is NEGATIVE 42 and was -42/-41.5 late, indicating an ease over that period (9543.5/9585.5). When considering these two spreads in terms of 1-yr calendars, Dec/Dec prices are nearly identical with spread -1.5, while March/March is -88. Lowest 1-yr spread on the SOFR curve is Sept’23/Sept’24 at -130.5 (9510.5/9650).
–I would call this pricing unusual, (like just about everything else I see around me). Stocks appear to be encouraged by declining forward rates, but the REASON may end up being key. Due to falling inflation expectations? Or a dive in growth?
Just missed it
November 22, 2022
–Early action featured sizable call spread buying in SOFR, following Friday’s purchase of SFRU2 9700/9800cs for 4.25 to 4.5. Yesterday, +8k SFRM3 9600/9650cs. appears exit, settled 4.0 ref 9495.0. +10k SFRU3 9600/9700cs, looks new, settled 11.0 vs 9511.0. +40k SFRZ3 9700/9800cs, new, settled 8.0 ref 9540.5. +30k SFRH4 9700/9800cs, new, settled 14.75 ref 9578.0.
–New cycle low in 2/10 at -71.6. New low red/gold ED pack spread -77.625. Seven year auction today.
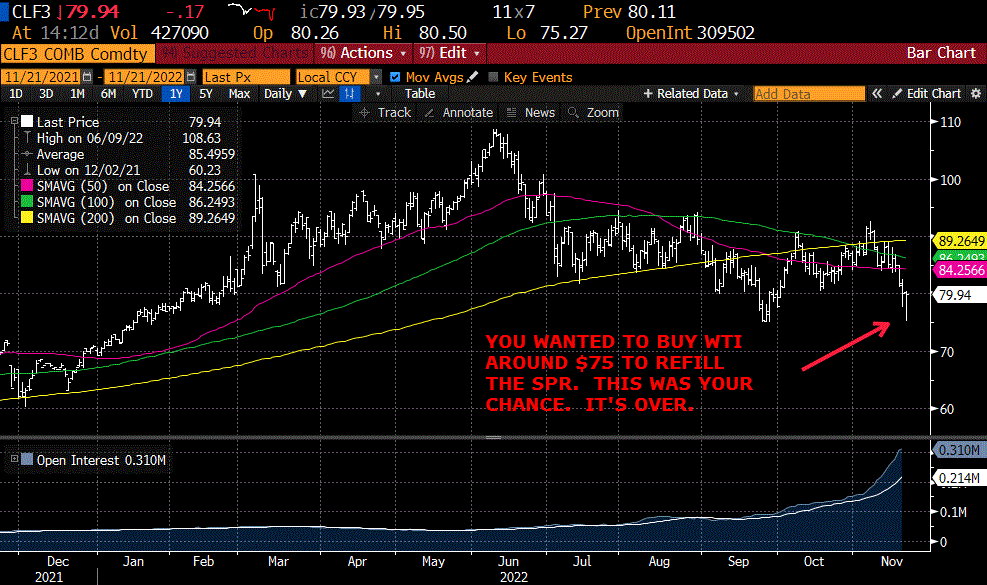
–Attached is a chart of WTI (CLF3) which rallied nearly $5 off the low of 75.27 yesterday as KSA denied reports that OPEC was going to increase production. From Reuters today: “Oil rose on Tuesday after top exporter Saudi Arabia said OPEC+ was sticking with output cuts and could take further steps to balance the market, outweighing global recession worries and concern about China’s rising COVID case numbers.”
–Market manipulation. Ethical lapses. Lack of a moral compass. FTX? Nope, try US policy with respect to SPR.
–Fist bump with MBS to get more oil supply and push prices down pre-election. True? The stated goal was to lower US gasoline prices. MBS snubbed the US. Instead of moving on, the Biden admin grants immunity to MBS for allegedly ordering the butchering of journalist Khashoggi, in order to get more oil. True? Not sure…but the news media is reporting immunity for MBS. Coincidentally, there are reports of mass beheading executions of drug traffickers in KSA. True? It’s being reported, and I will guarantee if I were a journalist, and had a suspicion that protections for the 4th estate go out the window as a bribe for cheap oil, I’d think twice about deep dig stories into KSA and MBS. The world knows the US is short oil for the SPR. The WSJ story about increasing production was an exit chance. Missed it.
Twos and Fives today
November 21, 2022
–Light volume Monday though red euro$ pack was -9.0 and greens were -9.375, with blues and golds -7.75 and -7.25. Red/gold pack spread hit a new inversion low of -75.375. 2/10 was -69.4 at futures settle, also a new low for the cycle. Ten-year yield to inflation-indexed breakeven made a new recent low at 225 bps. Two and five year auctions today of $42 and $43 billion.
–Bostic said that 75 or 100 more ought to be enough to rein in inflation, but interest rate futures are slightly lower this morning with SFRH3 printing exactly 5% (9500.0). Given current FF target of 3.75-4.0%, the market is ignoring Bostic, but IS heeding the Fed’s message of “pause, but no easing over 2023”. SFRZ2/SFRZ3 settled positive 0.5 (9545.0/9544.5), FFF3/FFF4 settled positive 26.0 (9562.5/9536.5) and EDZ2/EDZ3 negative 17.0 (due to turn embedded in libor).
–This guy thinks there could be an ease: Buyer of 50k SFRU3 9700/9800cs Friday for 4.25/4.5; settled 4.0 ref SFRU3 9515.5 (current print 9512.0). On Friday’s close, the most inverted 1-yr calendar is SFRU3/SFRU4 at -120.5 (9515.5/9636.0). Even with extreme inversion, SFRU4 is STILL 64 away from the 9700 strike (but of course the option spread is on SFRU3, 184.5 away).
–Coca Cola used to have the slogan, “The Pause that Refreshes”
Maybe the Fed will start using that one

Using the 2018/2019 Playbook
November 20, 2022 – Weekly Comment
*******************************************
On Friday, there was a buyer of about 50k SFRU3 9700/9800 call spreads for 4.25 to 4.5 (settled 4.0 ref SFRU3 9615.5). Current EFFR is 383 bps. SOFRRATE is 378 to 381. January 23 Fed Funds settled 9562.5 or 437.5 bps, which is 54.5 above EFFR, indicating high odds of a 50 bp hike at the December 14 FOMC.
So what’s with a call spread 10 months forward that won’t be in the money unless Fed Funds drop below 3 pct?
It reminded me of late 2019, when large, consistent buying of EDU’20 otm call spreads developed. Let’s take a look back.
In Q4 of 2018, Powell was talking tough on rate hikes. QT was proceeding at an increasing scale through 2018, and there were four 25 bp hikes in March, June, Sept and finally in December, to a peak 2.25-2.50%. Stocks slid hard in Q4 2018; the ED curve predicted ease with near calendar spreads inverted. From the end of December 2018 to the end of July 2019, FF were kept unchanged. Then there were three 25 bp eases, the last of which was October 30, taking the funds rate down to 1.50-1.75%. At that time, the Fed cited a strong labor market, inflation slightly below 2%, but weak business fixed investment and exports.
In November 2019, large buyers started pouring into 50 bp wide EDU’20 call spreads, starting with 9875/9925c spd for around 3.5 to 4.5 bps and moving up to the 9887.5/9937.5cs. It seemed odd, because EDU0 futures were stable at around 9840 to 9850. The market was expecting the Fed to remain on hold after the October ease.
From my note on December 8, 2019 (Stockholm Syndrome) I wrote:
There continues to be buying for forced easing, I will just highlight EDU0 9887.5/9937.5, 5.5 was paid this week ref 9848, then 4.5 on Friday ref 9841 with a settle of 4.75 vs 9844.0. The two strikes have 269k and 287k open, so the core long in this spread is ~150k or more. This call spread prices aggressive easing going into the election; it would take at least three 25 bp cuts to get above breakeven (9892.5) in the contract.
Note that back then, there were hundreds of thousands of call spreads bought. Currently, total open interest in ALL Sept SOFR calls is 694k which includes Friday’s 98k increase.
After Covid hit in 2020, I wrote a piece titled “They Knew” specifically referring to the buyers of the Sept’20 call spreads that were trading well over 40 by April 2020 as the Fed had slashed to zero.
Here’s an excerpt from my “They Knew” piece:
When the virus news was starting to really circulate in late January and February, a friend said, “those call [spread] buyers must have already known about the virus”. I replied that they couldn’t have, because the news wasn’t really known until January at the earliest. Now there’s a news story that supports the idea that they DID know. From ABC news:
Using techniques similar to those employed by intelligence agencies, the research team behind the study analyzed commercial satellite imagery and “observed a dramatic increase in hospital traffic outside five major Wuhan hospitals beginning late summer and early fall 2019,” according to Dr. John Brownstein, the Harvard Medical professor who led the research.
Brownstein, an ABC News contributor, said the traffic increase also “coincided with” elevated queries on a Chinese internet search for “certain symptoms that would later be determined as closely associated with the novel coronavirus.”
“Something was happening in October [2019],” said Brownstein, the chief innovation officer at Boston Children’s Hospital and director of the medical center’s Computational Epidemiology Lab. “Clearly, there was some level of social disruption taking place well before what was previously identified as the start of the novel coronavirus pandemic.”
Now, shall we read anything into present-day buying of EDU’23 9700/9800 call spreads? It’s abundantly clear that the market perceives Fed easing in late 2023 and into 2024; SFRZ3/SFRZ4 settled at -107.5 on Friday with hard inversion signaling rate cuts. Is the economy going to fall off a cliff? In 2019 the Fed held off from easing for eight months. This thing’s rhyming like a bad rap song.
Of course, our first order of business is to determine when the Fed stops HIKING. Goldman last week added a projected 25 bp hike in May in their updated forecast. Could the stop, then ease cycle be drawing much closer? On Saturday, Bostic said he’s ready to “move away” from large rate hikes, and added, “If the economy proceeds as I expect, I believe that 75 to 100 basis points of additional tightening will be warranted. I believe this level of the policy rate will be sufficient to rein in inflation over a reasonable time horizon.” He added that the Fed should guard against any temptation to cut rates, “even if the economy were to weaken appreciably.” (RTRS)
While current inversion of various spreads, both over stirs and treasuries, indicates expected future easing, the current buying of SFRU3 call spreads likely isn’t large enough to provide a strong signal. However, it’s worth keeping track of call spread positions.
OTHER MARKET THOUGHTS/ TRADES
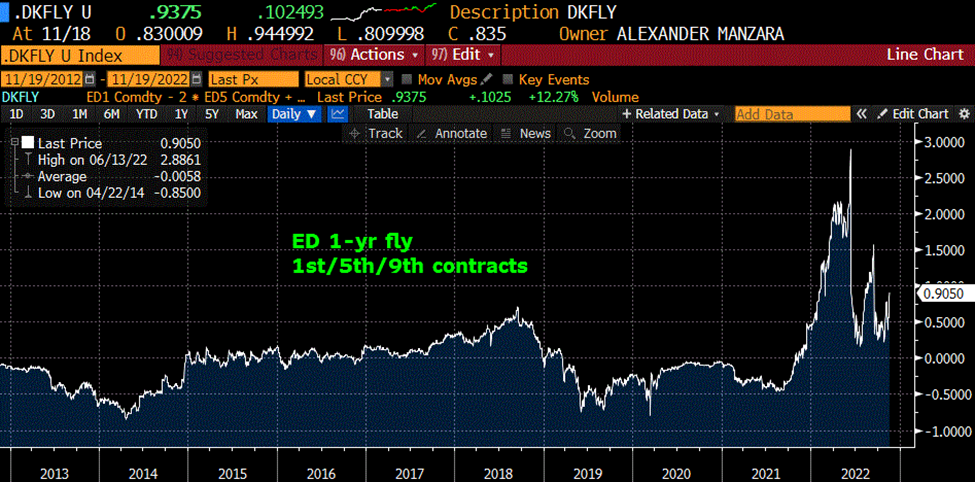
Below is the SOFR Dec’22/Dec’23/Dec’24 butterfly. SFRZ2/Z3 settled positive 0.5 and SFRZ3/Z4 settled negative 107.5, therefore the fly settled at a new recent high of 108.0. What’s interesting is that Dec’23 was pounded relative to the other contracts, and that’s because Fed officials are saying there is more to come in terms of tightening (and there will NOT be an ease). Therefore, the inversion from Z2 to Z3 vanished, yet the inversion from Z3 to Z4 became even MORE pronounced, as upcoming hikes are expected to crush the economy, leading to (forced) easing. It’s not unprecedented; in Euribor Z2/Z3/Z4 is 112 (Z2Z3 is +78, Z3Z4 is -34) and in Sonia the fly is 125.5 (Z2Z3 is +73.5, Z3Z4 is -52.0). It’s simply that the 4 ½ month move is dramatic. By the way, I am NOT recommending that this fly be sold; a look back at ED1, ED5, ED9 fly shows some levels as high as 200. The only takeaway is that monetary policy is uncertain at best, especially when compared to the period from 2015 to 2017 for example.
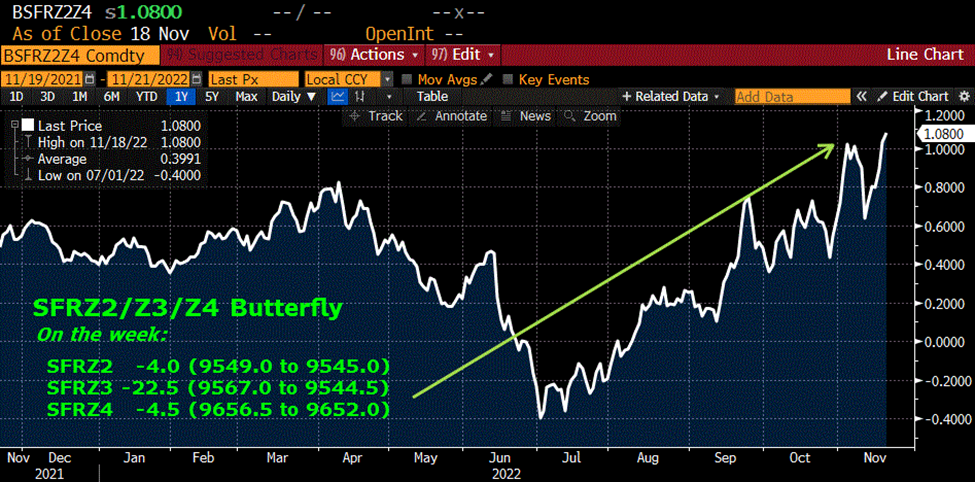
Top image is current SFRZ2/Z3/Z4 fly. Below is the constant maturity one-year Eurodollar fly covering the past ten years.
Auctions are crammed into Monday and Tuesday due to Thanksgiving: Monday: $42b in 2yr, $43b in 5yr. Tuesday, $22b 2y FRN, $35b in 7yr. Fed Minutes from November 2 on Wednesday afternoon.
The December 14 FOMC is three and a half weeks away. Note: Philly Fed at -19.4 was the lowest it has been in the past 20 years, except for the GFC and the COVID spike lower in early 2020.
Below is a wide range of Fed expectations, summarized by Ira Jersey of Bloomberg:
UBS sees 175 basis points of cuts next year and Deutsche Bank predicts a percentage point of reductions late in 2023
Nomura projects hikes to 5.75% before a retreat to 5%, while Barclays sees 75 basis points of cuts in the final four months of the year
Morgan Stanley, which sees the peak at 4.75%, and Bank of America look for a quarter-point cut in December 2023
Goldman Sachs and Wells Fargo anticipate rates peaking at 5.25% and remaining there through the rest of 2023, while JPMorgan Chase reckons rates will hit 5% and stick there until 2024
Citigroup Inc. sees the peak in a range of 5.25% to 5.5% hit by mid-2023, and holding there through the rest of the year
| 11/10/2022 | 11/18/2022 | chg | ||
| UST 2Y | 432.4 | 451.0 | 18.6 | |
| UST 5Y | 394.1 | 399.6 | 5.5 | |
| UST 10Y | 382.7 | 381.6 | -1.1 | |
| UST 30Y | 404.3 | 392.7 | -11.6 | |
| GERM 2Y | 216.9 | 210.5 | -6.4 | |
| GERM 10Y | 201.0 | 201.4 | 0.4 | |
| JPN 30Y | 150.7 | 140.2 | -10.5 | |
| CHINA 10Y | 269.6 | 283.0 | 13.4 | |
| SOFR Z2/Z3 | -19.5 | 0.5 | 20.0 | |
| SOFR Z3/Z4 | -83.0 | -107.5 | -24.5 | |
| SOFR Z4/Z5 | -24.0 | -28.5 | -4.5 | |
| EUR | 102.09 | 103.26 | 1.17 | |
| CRUDE (CLZ2) | 86.47 | 80.08 | -6.39 | |
| SPX | 3956.37 | 3965.34 | 8.97 | 0.2% |
| VIX | 23.53 | 23.12 | -0.41 | |
But I don’t even really work here…
November 18, 2022
–Worst Philly Fed number of the year at -19.4. Bullard set the tone early by saying FF should go to 5.0-5.25% and Kashkari capped the day by saying the Fed shouldn’t stop until inflation has peaked. New low in red/green ED pack spread -73.25 (spread is same level in SOFR). New low in 2/10 just above -68. Elon Musk has supposedly sparked a mass exodus of Twitter employees, which is nice, because now there’s a fresh source of labor.
–Japan CPI hit its highest level since 1982 at 3.6% but the BOJ vows to keep an easy policy stance. Hahahahaha…how crazy is that? That’s a negative real funding rate of 3.6%! That would be as if the US FF rate were 3.83% (3.75-4.0%) and CPI was 7.4%. Oh. Nevermind, last CPI was 7.75%.
–Vol firmed in short end yesterday as the market took a step back from post-CPI calm. There had been a large seller of SFRU3 9550 and 9537.5 straddles after CPI around 83/84. Yesterday, SFRU3 settled 9523.5. SFRU3 9537.5^ 91.25s (38.75/52.50) SFRU3 9550^ 93.75s (34.0/59.75). I guess that stings a bit, but it pales in comparison to Masayoshi Son who’s in a mad race to catch SBF amid reports that he owes $4.7 billion to Softbank on “side deals”. I’m going to forecast that this amount balloons to $10 billion before the month is out. We’ll call it the ‘Vision Fund’. Now you see it, now you don’t.
–Twos, fives and sevens crammed into the auction schedule on Monday and Tuesday, along with a 2yr FRN Tuesday. It’s like stuffing a turkey.
Historic new lows in stir spreads
November 17, 2022
–Historic lows in a lot of STIR calendars. Example on attached chart is red/green euro$ pack spread at -69. In 2007 that spread barely went negative, at a time of true crisis. Currently the unemployment rate is near all-time lows, and the consumer seems to be “hanging in there…though pulling back” according to Mary Daly post-retail sales. I guess the difference is just inflation (and perceived forward changes) and war. Of course, Goldman updated their rate hike forecast, adding a May hike of 25, (50 in Dec and 25 in Feb, March and now May). And Daly added that “pausing is off the table right now” keeping a lid on near contracts while the backs rallied.
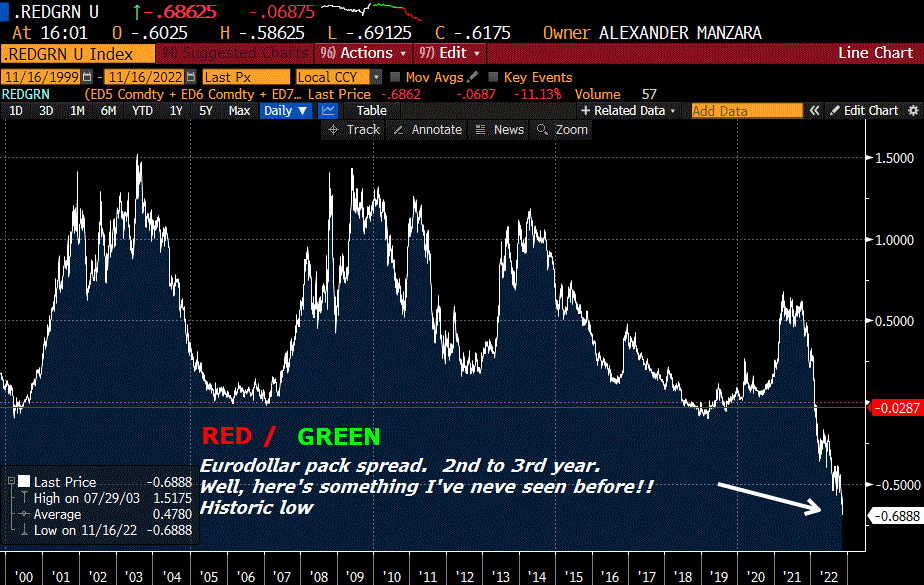
–EDM3/EDM4 fell another 4 bps to a new cycle low of -130.5 bps. White pack fell about 0.25 bp, Reds +2.25, Greens +9.25, Blues +8.25.
–The two-yr note yield was up on the day by 0.4 bp, while the thirty year bond fell 12 bps, sinking further below 4% to 3.86%. The 20-year bond auction saw strong demand; the wi was 4.06% late vs 4.185% on Tuesday.
–Three month libor yesterday set 4.67429, the highest since a brief spike in Oct 2008 up to 4.81 (In September 2008 it had been 2.81). SFRZ2/EDZ2 settled yesterday at 47.75 having recently been as high as 53. I guess the Fed’s robust regulatory framework ensures that there’s absolutely no chance that a financial crisis could spark a libor surge as that particular benchmark sails into the sunset. Right?
–In 2018, the last hike was in December to a peak of 2.25-2.50%. July of 2019 was the first ease. By the end of 2019 the target was 1.50-1.75%. In terms of timing in 2023, March/June calendar is +0.5 in SOFR and +1.0 in ED. However, June/Sept is -21.0 in SOFR and -26.0 in ED. Following the same timetable as 2019?
Broader implications?
November 16, 2022
–Implosion in near one-year calendars in short end curves. For example, EDM3/EDM4 closed -126.5, (9481.5/9608) down 11.5 on the day as 2024 contracts rallied around 15 bps. In SOFR, SFRM3 is the lowest contract on the strip at 9513.5, which implies a FF target of 4.75 to 5%. By contrast SFRM4 is 9634, consistent with FF target 3.50 to 3.75%. The main factors were continuing fallout of the FTX failure and reports of Russian missiles hitting a Polish village sparking Article 5 fears. Initial moves related to the latter sparked volatile moves, but temperatures have since been dialed down. PPI yoy was 8.0%, lower than expected 8.4.
–Implied vol jumped on the Poland news, with the TYF atm straddle jumping to 8.15; TYF 113^ settled 2’24 ref 112-27 vs 2’18 on Monday for the atm 112.5^. SFRU3 9537.5^ settled 87.5 ref 9534.0 from 86.25 Monday, having been sold down to 83 post-CPI.
–As of the 3:00 futures settlement, the 30yr yield was back below 4% for the first time in a month; marked at 3.98% with the w/i 20y at 4.185/4.18 in front of today’s auction.
–Retail Sales today expected +1.0%. Williams and Waller speak. In early to mid-October California sent out stimulus checks totaling $9.5 billion according to news reports, which likely boosted consumption. The NY Fed put out a couple of notes on Household Borrowing yesterday (link below). In Q2, “…credit card balances up $38b from the previous quarter. On a yoy basis, this marked a 15% increase, the largest in more than 20 years.” Of course, this is partially due to inflation. Delinquency rates are rising, but remain historically low.

