
SOFR put fly: higher for longer
August 26, 2022
–It’s all about Powell today. Yesterday, rate futures rallied as those who had needed short hedges were already done by yesterday morning, leaving little remaining upside resistance. Tens fell 8 bps to 3.024%. On the eurodollar curve longer contracts led the way: red pack +2.5, greens +4.125, blues +5.75 and golds +8. There was a large new buyer of about 70k 0QZ2 9650/9600/9550p fly for 8.5 (settled 8.75). This trade is a midcurve which expires December 16 on SFRZ3 underlying (9665.0s).
–The lowest contract on both the ED and SOFR curves is March’23. EDH3 settled 9596 and SFRH3 9623. By Dec’23, the market anticipates easing, as EDZ3 is 9639 (a rate 43 below EDH3) and SFRZ3 is 9665 (42 lower in yield than SFRH3). If the curve stays the same, then the Dec’23 contracts will roll down over time, and the Dec put fly that traded would naturally end up in the money. However, there are only 3 1/2 months until short Dec expiration. In my opinion, the large put fly isn’t so much about the idea of Powell being aggressively hawkish, it’s more that he will try to convince the market of a steadfast stance against inflation, which may mean either that hikes are stretched out over a longer period or that once a terminal objective is achieved, it won’t be coming down any time soon. If that’s the thought process, then it might make sense to do something like buy SFRZ2/SFRZ3 spread. But that’s already had a significant rally to -30 from around -65, so the fly is clearly more limited in risk, and not really dependent on 50 or 75, but on the idea of higher for longer, with a terminal rate around 4%.
–FFV2 settled 9701, still tilted toward 75 in September. FFF3 settled 9636 or 3.64%, currently projecting that the Fed needs to hike by 131 bps in the next three Fed meetings (Sept 21, Nov2, Dec 14).
Student loan forgiveness not likely to impact inflation
August 25, 2022
–Yields rose yesterday, TYU2 settled 117-08, down 12 while the cash yield rose 5.8 bps to 3.104%. Euro$ strip down 4.5 to 6 from reds through golds with slight steepening bias. Sept treasury options expire tomorrow; yesterday there was a (new) buyer of 45k TYU 117.75/118.75c spread for 10/64s, settled 10. Powell speech in Jackson Hole is tomorrow, and the market is reflecting expectations, or is at least hedging, that he will emphasize inflation concerns, which would translate to a 75 bp hike at the Sept 21 FOMC. October Fed Funds settled 9701.5, just slightly tilted toward 75 as the exact midpoint between 50 and 75 (specifically indicated by that contract) is 9704.5. Peak open interest in Sept TY options is at the 120 strike in calls, with 97k. The 117.75c strike has 56k open after yesterday’s gain of 49k. On the put side, open interest is diffuse, with peak strike being 116.5p with 69k open (settled 7/64).
–There’s a reasonable amount of press about Biden’s edict to forgive student debt in the aggregate amount of about $300 to $320 billion. I believe that student debt owed to the federal gov’t has been on moratorium since 2020, over two years. According to the Fed’s Consumer Credit report, as of June the Fed’l Govt was a holder of $1.46 trillion of consumer debt, the bulk of which is student loans (Total student debt outstanding is $1.7t). Whatever you think of this jubilee, it’s not likely to add to inflation because the debt wasn’t being serviced anyway. It’s a transfer on the gov’ts balance sheet. At some point the market may question the credit-worthiness of treasuries (call me crazy), or add a little premium to the yield. And that, at the margin, would make other yields increase as well (See mortgage payment chart which shows an increase in mortage payments). Line of the day: “Inflation is so bad it cost the Dems $300bn to buy the midterms.”
–The mortgage chart is self-explanatory. Mortgage rates surged since the end of last year. As did taxes, and now home-heating bills will bite. What does it do for the consumer? Nordstrom (JWN) stock was down 20% yesterday, as the full year outlook was slashed.

Weakening data prevents market from setting higher terminal rate
August 24, 2022
–Tone set early as Global US Service PMI was horrendous at 44.1, lowest since June 2020 (pandemic). New Home Sales equally dismal at 511k, lowest since early 2016. Data sparked a front end rally which wasn’t sustained, though red euro$ pack still closed UP 5.125 while golds were DOWN 4.0. Pretty much a reversal of Monday. Though SFRZ2 has had a couple of lows in the 9620’s, over the past month it has held at 9636. The chart looks like it could waterfall lower on a technical basis, but fundamentally the market seems to have accepted a terminal rate for this hiking cycle of 3.5/3.75%.
–A couple of large plays: -40k SFRH3 9625/9600 put spread at 11.25, settled 10.0 vs 9627.0. According to prelim open interest sheet, the top strike +11k and lower +2k so apparently new sale (at least of upper strike). Buyer of 40k EDZ2 100c for 0.25 likely cover.
–Late in the day a report claimed that St Louis and Minneapolis Feds favored going 1% at the last FOMC. Market easily absorbed that tidbit. Vol edged a bit lower, the ten year yield was up just over 1 bp to 3.046% in front of today’s five-year auction.
–Grains and oil look as if they’ve set bases from which to rally, led by corn yesterday. C Z2 settled 655 1/4, up 26 1/4 yesterday, the highest level since late June.
Financial Conditions again tightening
August 23, 2022
–Rates jumped Monday even as stocks tumbled. SPX down 2.1% while Nasdaq Comp was down 2.5%. Ten year yield rose 5 bps to 3.033% with the entire curve again yielding over 3%. The eurodollar and SOFR curves were much flatter with reds -12 and golds -3.625. The red/gold pack spread closed at -68.25…the year’s low was set on April Fools Day at -87.375, so less than 20 bps away. FFV2 settled 9703,0, again tilted toward 75 bps at the Sept 21 FOMC. The concern is that Powell will remain focused on the inflation fight and ignore collateral damage in risk assets (and, eventually, employment).
–Sept ED to Sept SOFR went out at 21.5, the lowest the spread has been since April. Perhaps somewhat interesting since the spread is set at 26 for contracts post the June 2023 transition.
–New highs in near ED spreads (curve steepened in front). EDU2/U3 settled 43.875 (+10 on the day) and SFRU2/U3 at 39.25 (+8.75). SFRZ2/Z3 where there had been a large block buy at -63 a couple of weeks ago, settled yesterday at -24, high since late June. The idea of stretching out hikes –or at least not pivoting toward ease– is gaining traction. Range on this spread has been spectacular. On June 9 it settled +20. The lowest settle was a month later on July 13 at -73 and now -24.
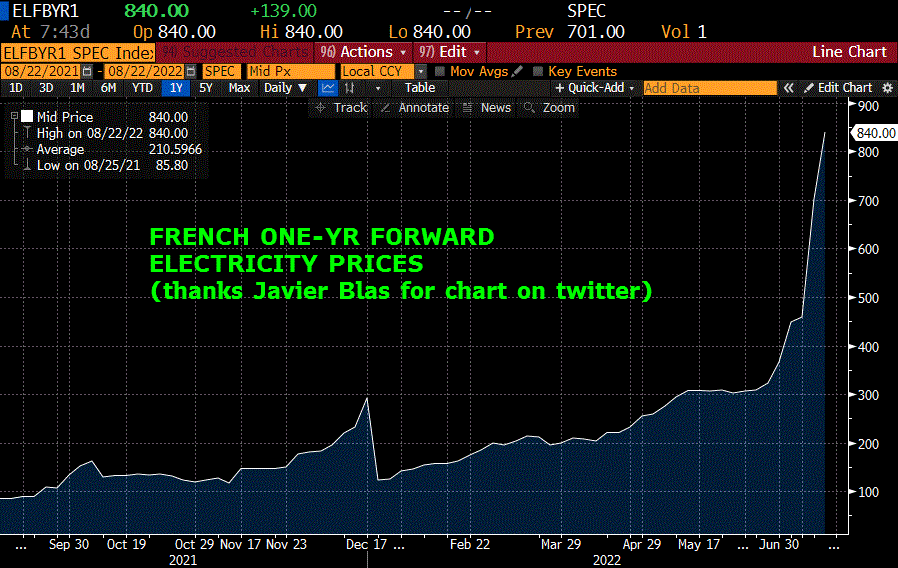
–Crude oil rebounded off steep losses yesterday as the Saudi energy minister “said OPEC+ had the means to deal with challenges including cutting production.” (RTRS). Yesterday’s low in CLV2 86.28. Price as of this note is 92.00. The attached chart shows one year forward French electricity prices. All european energy charts, whether electricity or Dutch natural gas, etc, look the same way: parabolic.
–DXY at a new recent high as EUR sinks below parity. US financial conditions rapidly tightening again with USD higher, rates higher, risk assets easing. Today’s news includes Richmond Fed and New Home Sales. Two-year auction, with 5s and 7s to follow Wednesday and Thursday.
The Tenth Contract
August 21, 2022 – Weekly Comment
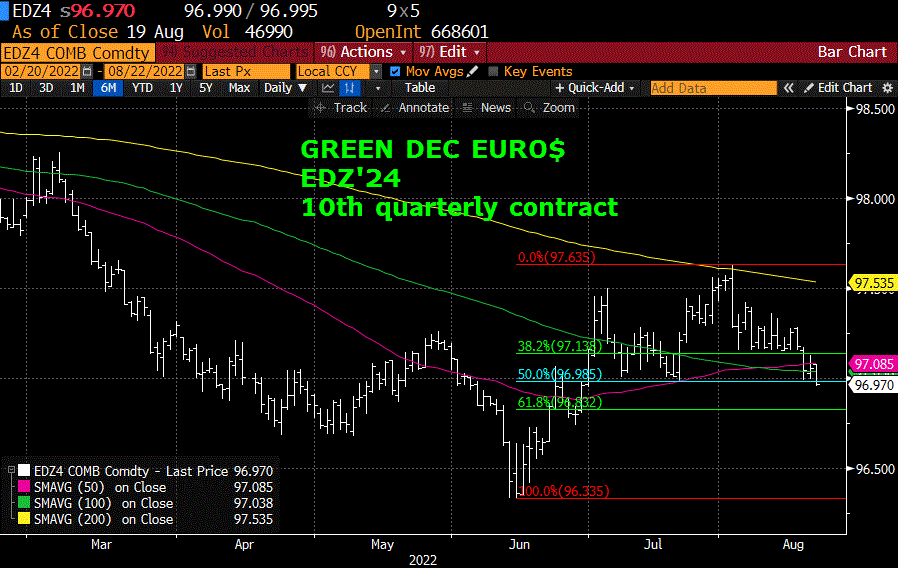
Attached is a chart of Green December Eurodollar, currently EDZ’24, the tenth quarterly contract. I chose to highlight this contract for a few reasons. First, it settled down 20 bps on the week at 9697.0, which is the largest net change for any eurodollar contract aside from green March, EDH’25, which settled -20.5 at 9705.5. By comparison, on the treasury curve the ten year was weakest, with the yield up 13.4 on the week to 2.983%. Second, it’s an end of year contract, which makes it appropriate for comparison with the Fed’s SEP, which indicates end of year Fed Funds targets. Third, it has an interesting technical set up, having closed just below the 50% retracement from the middle of June low (inflation data) of 9633.5, to the Nancy Pelosi Distraction (NPD) high of 9763.5 (Taiwan trip). Amazingly enough, that was a range of 130 bps, made in just 33 sessions. Notice that nine of the ten days from August 3rd to the 16th had a low of 9716.5 to 9715.0, essentially at the 38.2 retracement. Having broken this level strongly suggests a look at the 61.8 retrace of 9683.5.
At the June FOMC, the projection table indicated a median forecast for Fed Funds at 3.8% at the end of 2023 and 3.4% at the end of 2024. In the March projections, both end of 2023 and end of 2024 were pegged at 2.8%. On Friday, EDZ’23 settled 9648.5 and EDZ’24 settled 9697.0 a spread of -48.5. This level is fairly close to the -40 spread indicated by the FF projections in June. However, the LEVELS are quite different. EDZ’23 rate is 3.515% and EDZ’24 rate is 3.03%. Looking at SOFR, SFRZ3 settled 9674.5 or 3.255% and SFRZ4 settled 9723.0 or 2.77%, also a spread of -48.5. Of course, the difference between forward ED and SOFR contracts is 26 bps, as ED contracts will transition to SOFR after the middle of next year. The point is that end of 2024 rates are about 60 bps LOWER in the market than what was projected by the Fed in June: 2.8% in the market and 3.4% by the Fed. The Fed’s March projections are much closer to where the market is presently.
In terms of the actual dot plot, 8 of the 18 dots for end of 2024 were 3.25 to 3.5%. If the Fed were to hike 100 bps more by the end of THIS year, we’d be there. What is somewhat curious is that the Fed is making a concerted effort to disabuse the market from pricing eases NEXT year, even as the Fed’s own projections point to an ease from 2023 to 2024. I saw several news clips expressing this theme, captured by the FT on Sunday morning: “Some traders fear markets underestimate US central bank’s determination to stamp out inflation.” As a Fed plant, this one’s a bit clumsy, as if the FT carefully polled “traders” to identify their fear triggers with respect to the all-powerful CB.
The market continues to strongly suggest that the Fed will complete rate hikes by the end of this year or by the first quarter of next year. Eases are projected to follow (in terms of market pricing). However, the Fed’s protestations about rate CUTS being priced too soon did influence the week’s action. Reds and greens weakened on a relative basis, in front of Powell’s Jackson Hole testimony on Friday. For example, the most negative one-yr SOFR is June’23/June’24 at -60.5. EDM3/M4 is also the lowest. From Friday to Friday SFRM3/M4 went from -75.5 to -60.5. Last Monday the spread settled -78.0, essentially at the low for ANY 1-yr spread over this cycle.
The stunning reversals across many markets on August 2, when Pelosi visited Taiwan without generating much of an overt response by China, is telling. I personally am not convinced that we can turn the page on China’s non-response. In any case, the move in EDZ4 has been as clear of a marker as anything in terms of direction, having closed the week and the month of August at the beat low on Friday. In the early part of the upcoming week, in front of Powell’s speech on Friday, the pressure will likely continue.
With respect to Jackson Hole, Dudley’s article on BBG last week was as good a summary as any. Dudley said he expects Powell to emphasize three things: “that the economy still has forward momentum with an extremely tight labor market and unacceptably high inflation, that the Fed must tighten monetary policy further to restrain the economy and ease pressure on the labor market, and that the Fed won’t relent until it’s sure it has done enough for long enough to achieve its 2% inflation target.”
If Dudley is correct in his analysis, then it’s likely rates will continue August’s trend higher. Going into the speech I would expect that the October Fed Fund contract, which prices odds for a September 21 hike, will stay close to 9704.5, halfway between 50 (price of 9717) and 75 (price of 9692). FFV2 settled Friday at 9705. My bias is that Powell will attempt to convey a strong inflation fighting front, while indicating that hikes will be stretched over a longer timeframe in smaller increments. I think he would like to see how the market responds to the $95b/month QT going into the September FOMC
| 8/12/2022 | 8/19/2022 | chg | ||
| UST 2Y | 325.5 | 326.0 | 0.5 | |
| UST 5Y | 297.7 | 310.9 | 13.2 | |
| UST 10Y | 284.9 | 298.3 | 13.4 | |
| UST 30Y | 311.7 | 322.1 | 10.4 | |
| GERM 2Y | 60.8 | 82.4 | 21.6 | |
| GERM 10Y | 98.7 | 123.0 | 24.3 | |
| JPN 30Y | 109.7 | 107.9 | -1.8 | |
| CHINA 10Y | 274.3 | 263.0 | -11.3 | |
| EURO$ U2/U3 | 25.0 | 33.8 | 8.8 | |
| EURO$ U3/U4 | -69.5 | -56.0 | 13.5 | |
| EURO$ U4/U5 | -26.5 | -28.5 | -2.0 | |
| EUR | 102.61 | 100.40 | -2.21 | |
| CRUDE (active) | 91.46 | 90.44 | -1.02 | |
| SPX | 4280.15 | 4228.48 | -51.67 | -1.2% |
| VIX | 19.53 | 20.60 | 1.07 | |
Some of our clients are speculating…
August 19, 2022
–One of BBG’s lead-off stories today is ‘US Futures Slide as Global Rate-Hike Wagers Surge’. Hey wait a second…Turkey just EASED rates. Bloomberg: trying to authoritatively find a reason for every wiggle when some moves are simply driven by positioning.
–Yesterday’s curve was a bit steeper, reds +3.5 while blues and golds were nearly unch’d. Ten-year yield fell 1.6 to 2.877%. As I was looking through yesterday’s settles I noticed that FFF3, which prices Fed Effective (EFFR) for year end 2022, closed 9648.5 or 3.515%. FFQ3 (August) captures the first five meetings of next year. It settled at almost the exact same price as January, 9648. Current EFFR is 233. The market thinks the Fed will be done by the end of this year, or at least that’s what FFF3/Q3 spread suggests. Looking for hikes next year? Buy FFF3, sell FFQ3. Think they’ll pivot to ease? Sell FFF3, buy FFQ3.
Randolph Duke : Good, William! Now, some of our clients are speculating that the price of gold will rise in the future. And we have other clients who are speculating that the price of gold will fall. They place their orders with us, and we buy or sell their gold for them.
Mortimer Duke : Tell him the good part.
–After Wednesday’s minutes, the market again tilted toward pricing a 50 bp hike at the Sept FOMC. Then of course, Bullard said he’s open to 75. As motivational speaker Matt Foley would say, “Jim, I wish you could just shut your big YAPPER.” SFRU2 was trading 9691.5 just prior to Bullard, then ticked down to 88.5 and settled 89.5. Same with October FF, from 9708.5 to 05.5, and settled 06.5. As a reminder, 9704.5 is the exact midpoint between a hike of 50 and 75 for the Sept 21 meeting.
–Dudley wrote a nice summary op-ed of Powell’s last Jackson Hole speech: Inflation transitory WRONG, little evidence of wage increases WRONG. Dudley added, probably rightly so, that he expects Powell to emphasize three themes at next week’s talk; “that the economy still has forward momentum with an extremely tight labor market and unacceptably high inflation, that the Fed must tighten monetary policy further to restrain the economy and ease pressure on the labor market, and that the Fed won’t relent until it’s sure it has done enough for long enough to achieve its 2% inflation target.” Here’s another guy that could use some advice from Matt Foley.
–Not a lot of news next week. Powell is scheduled to speak at Jackson Hole one week from today at 10:00 a.m. the same day as Sept quarterly treasury option expiration
Stretching it out
August 18, 2022
–US rates ended higher Wednesday with tens up 7 bps to 2.893%. On the euro$ strip, weakness was led by greens (3rd year forward) which were down 13.125. Reds, the second year forward, fell 10.75. The Fed minutes indicated concerns over both inflation and growth, with risks to the latter weighted to the downside. Key lines: “Participants judged that, as the stance of monetary policy tightened further, it would likely become appropriate at some point to slow the pace of policy rate increases while assessing the effects of cumulative policy adjustments on economic activity and inflation. Some participants indicated that, once the policy rate had reached a sufficiently restrictive level, it would be appropriate to maintain that level for some time to ensure that inflation was firmly on a path back to 2 percent.” I.e. stretch out the front-load.
This section would suggest that easing reflected in the euro$ curve in late 2023 and 2024 is misguided (as Kashkari articulated this week). In fact, near calendar spreads rallied in sympathy with that idea. New highs in some spreads Wednesday, with EDU2/U3 settling 34.25, up 9.75 on the day, and EDZ2/EDZ3 -42.0, up 8 on the day. SFRZ2/Z3 settled -31.5. If the Fed is currently neutral, but needs to move to restrictive and then maintain, it would suggest that all ED prices from 6 months out to about 2 years would be nearly the same price. That is, Dec/Dec and March/March calendars should move from negative levels toward zero. Obviously we’re not currently priced that way; the market’s assessment of cumulative hikes thus far is that economic activity will deteriorate further over the next year or so and spark a Fed pivot.
–It’s worth noting that going into the June FOMC the EFFR was 83 bps. If the Fed does 50 in Sept, the rate will be 283 bps, a change of 2% in just one quarter. It could easily be argued that the “front-load” has already occurred and further policy actions can be a slow glide.
–News today includes Philly Fed expected -5 from -12.3 and Jobless Claims, 264k from 262k. Existing Home Sales for July expected 4.87m from 5.12m. July was the worst of the mortgage rate sticker-shock. According to the St Louis Fed website the high rate on the 30y fixed was 5.8% at the end of June, it has now fallen back to 5.25%.
A couple of excerpts from minutes:
In their assessment of the policy outlook, market participants expected significant policy tightening in coming meetings as the Committee continued to respond to the current elevated level of inflation. Nearly all respondents to the Desk survey anticipated a 75 basis point increase in the target range at the current meeting, and most expected a 50 basis point increase in September to follow. The market-implied path of the federal funds rate indicated a peak policy rate of around 3.4 percent, significantly lower than at the time of the June meeting.
Staff Economic Outlook
The projection for U.S. economic activity prepared by the staff for the July FOMC meeting was noticeably weaker than the June forecast, reflecting the economy’s reduced momentum and current and prospective financial conditions that were expected to provide less support to aggregate demand growth.
Participants judged that, as the stance of monetary policy tightened further, it likely would become appropriate at some point to slow the pace of policy rate increases while assessing the effects of cumulative policy adjustments on economic activity and inflation. Some participants indicated that, once the policy rate had reached a sufficiently restrictive level, it likely would be appropriate to maintain that level for some time to ensure that inflation was firmly on a path back to 2 percent.
Late stock profit-taking; oil down
August 17, 2022
–Curve flattened a bit as an early sell-off in the long end reversed. Twos ended +4.6 bps at 3.247 while thirties rose only 1.6 to 3.112. Near ED calendars closed at the top end of ranges as a Fed pushback against the idea of eases next year filtered in. SFRZ2/SFRZ3 settled -39.5 (9648/9685.5) while FFF3/FFF4 settled -32.5 (9648.5/9681). Still inverted, but much more circumspect about pricing eases over 2023. Recall a couple of weeks ago there was a large block buy of SFRZ2/Z3 at -63; since exited. FOMC minutes this afternoon.
–Late in the day CLU2 was 86.95, down 2.46. Retail Sales today expected 0.1 month/month. The price of energy has a large impact on consumer behavior. And, it seems as though stocks reacted positively to lower oil as well, making a new high for the move, though there was a late sell-off which saw SPX close only modestly higher.
Fed’s response to bad stuff pushed forward
August 16, 2022
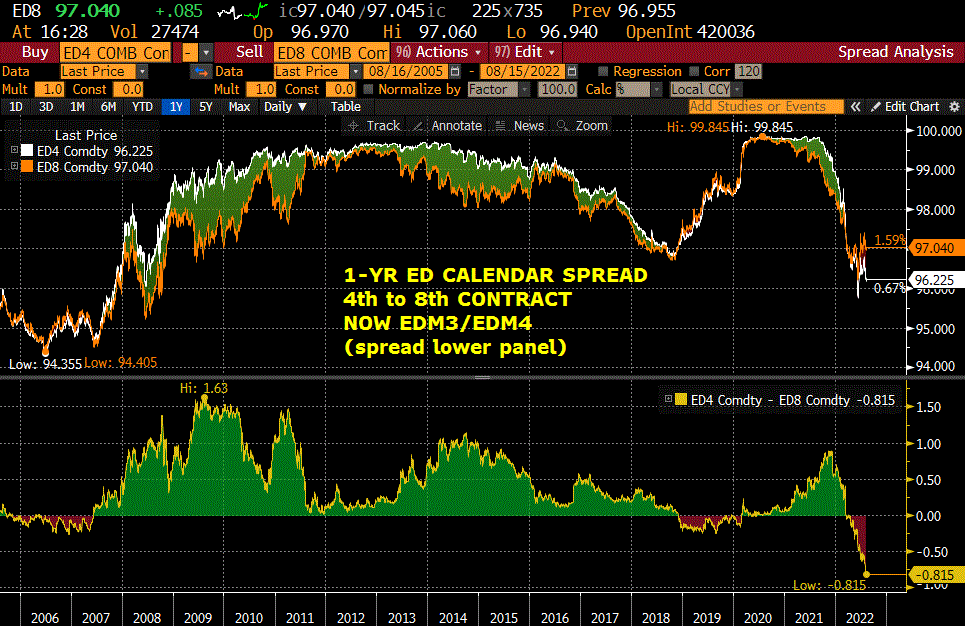
–Since the year 2000, the lowest ED one-year calendar was the 1st to 5th contract spread at the end of 2007, at -158 bps. Makes sense, the level of rates was high at the time (5.25% FF at the end of 2006) and it was becoming clear the Fed would have to cut hard. It’s typically the 1st/5th that inverts the most, as the market prices a near term pivot to easing. In 2019 the first to fifth contract spread got to -82.5 (lowest in the cycle). The situation is different now as inflation keeps the Fed on a front-loaded hike path. Currently the lowest one-year spread is nearly one year forward: EDM3/EDM4 settled -81.5, a new low for any 1yr this time around. The implicit forecast is that bad things will be happening in the economy by the middle of next year that will prompt Fed easing.
–Of course, there are already warnings on growth. China eased yesterday due in large measure to real estate woes. In the US, Empire State Mfg was -31.3 vs +5 expected, not only a miss, but a level equal to the lows of the GFC if not Covid. Same thing with NAHB; it was 49 vs 54 expected. Today we have Housing Starts (1528k expected) and Industrial Production at +0.3.
–I highlighted EDM3/M4 but the red pack to all deferred contracts edged to new lows; red pack to green pack settled -53.75. On the treasury curve there was flattening pressure early. which abated by the end of the day. 2/10 closed -41.1, up about 0.5. Commodities were crushed yesterday, with CLU hovering around $88/bbl late, down over $4 on the day.
China pulls down everything
August 15, 2022
–CLU2 once again near recent lows at 88.20 this morning, down 3.89 as China’s weakening economic data caused a sharp and broad-based commodity slump. Just over one month ago, CLU2 was over 115. Sept Copper is 3.56, representing a sharp pullback from the rally over the past month. Continued real estate end covid problems in China led to softer than expected economic data and a surprise rate cut by the PBOC which lowered “…the rate on 400 billion yuan of one-year medium-term lending facility loans to some financial institutions by 10 bps to 2.75% from 2.85%.” (RTRS). Industrial Production and Retail Sales both missed and credit demand is weakening. Small rate cut, but likely a signal of more to come. US stocks slightly lower, gold off $20, grains hammered. China’s ten-yr is 2.66%, testing the year’s low set in January. It was 7 years ago in August of 2015 that China surprised by devaluing the yuan.
–US curve flattened Friday with reds down a bit more than 5 bps and golds up just over 5 bps. Tens and bonds had tight ranges with a slight bias toward lower yields, with the ten-year yield ending at 2.85%. ED 1-yr calendar spreads from the middle of next year to 2024 remain severely inverted and are pressing new lows this morning. On Friday, EDM3/M4 settled -79 (lowest on the strip). EDU3/U4 -69.5 and EDZ3/Z4 -59.0 (new lows).

