
Beans in the teens? How about the 20’s?
January 31, 2022
–March’22 soybeans print 1489 this morning, which is a new high for that contract. I believe the all-time high for a front contract was 1758 in 2012. While it’s probably the case that inflation prints will start coming down later in the year, the absolute price for food will likely still be going up. Prices of fertilizer and other inputs have been soaring. The price of DEF, diesel exhaust fluid, a product that diesel users need to meet EPA standards, was up 160% last year. Eventually base effects will bring down inflation numbers, but the cost of living will likely dominate news headlines, making it tougher for the Fed to raise rates quickly.
–Flattening along the back end of the curve continued Friday with all euro$ one-year calendars from EDZ22/EDZ23 back making new lows (Z2/Z3 settle 49.5, down 4.0, while Z3/Z4 is just 3.5, down 1.5). Some calendars in blues have again inverted. For example EDH25/EDM25 three-month spread settled -0.5. Bostic helpfully said in an interview with the FT that a 50 bp hike could come in March. I did not read the interview, so I am sure I am missing some nuance, but it doesn’t really matter. The hint of 50 in a market already beginning to price that way is negative for the curve, which in turn sends the signal that the economy will be slowing. The three years of euro$ contracts from EDH’24 to EDZ’26 are within a six bp difference of 9803 to 9797, right around 2%. These contracts are NOT forecasting an inflationary spiral ahead. I personally think all back rates should be much higher, but a Fed who now has found the old Bundesbank religion is clearly able to inflict damage on an asset-price dependent economy.
–That’s where the Fed stands: at the intersection of higher cost-of-living expenses, spurred in part by energy policies and the gushing fiscal and monetary response to covid, and an economy now accustomed to high and increasing prices of financial assets. They might successfully squelch the latter without doing much to alleviate the former.
Often Wrong, Never in Doubt
January 30, 2022 – Weekly comment
The ten year note ended the week at 1.777% and the thirty year bond at 2.08%. Core PCE prices 4.85%.
The news media duly noted Powell’s hawkish press conference, with repetitive comments about the strength of the labor market, the resilience of the economy, and the fact that some factors feeding inflation aren’t likely to quickly abate. Of course he also said he expects inflation to come down, and noted that the federal government’s contribution to growth this year will be negative. The financial press and analysts are tripping over themselves to ratchet up hiking estimates. Nomura is calling for a 50 bp hike in March, and Bostic, in an interview with the Financial Times suggested 50 is on the table for March.
I was completely wrong in anticipating a dovish press conference. My thought was that the Fed, from a risk management perspective, faces little pushback from a slow and steady increase in rates, and trimming the MBS portfolio would be a good adjunct over time. I felt as if Powell wouldn’t want to relive the humiliating last quarter of 2018, which featured a 20% decline in SPX culminating in Mnuchin having to call the heads of the major banks to ensure liquidity in the event of a further meltdown. Recall that in October of 2018, with the FF target 2.0 to 2.25% and the ten year yield about 3.05%, Powell said rates were nowhere near neutral. QT had ratcheted up to $50b per month. It may be that the stock market sell off was also a reaction to the sugar-rush tax cuts that had been enacted at the very end of 2017, but monetary policy was definitely a factor, and the flattening yield curve was a clear sign of trouble. Powell was forced into an embarrassing about-face. At the start of Q4 2018, the “Buffet Indicator” of total stock market cap to GDP was 146%. A 20% decline in SPX bordered on panic. At the start of this year, market cap to GDP was a record 200%. A 20% decline would equate to 40% of one year’s income.
The Fed’s preferred measure of inflation is Core PCE prices, released last week at +4.85%. Every idiot knows that real rates are highly negative. I most certainly agree rate hikes are in order. But the back end of the curve is NOT signaling desperate concern over spiraling inflation. The long bond is barely above 2%. At the end of June Core PCE prices were +3.6%, well above the 2% target. The ten year rate ended June at 1.47%. At the end of September, Core PCE was 3.7%, with a ten year yield of 1.52%. There has now been rapid acceleration of Core PCE prices to 4.85%, and yet the ten year yield has gone up about ¼% from Sept. The two-year note has risen 87 bps since the end of September.
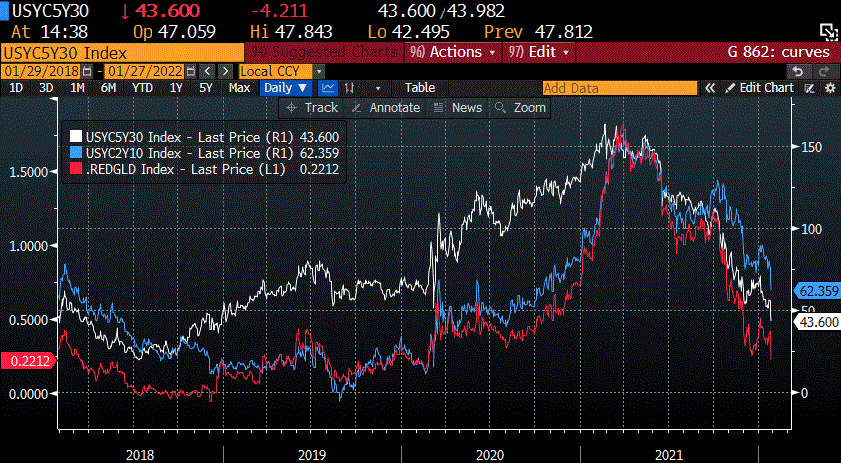
Once again Powell was dismissive when asked a question about the yield curve. He mentioned that 2/10s were about 75 bps, and deemed that level relatively steep. Of course, by Friday this spread was 61, a new low. The 5/30 spread was 46 and red/gold euro$ pack spread at just 19.25, less than 25 bps from 2018’s inversion. As can be seen on the chart below, the red/gold euro$ spread and 5/30 treasury spread seem to lead 2/10 in forecasting warnings; both are now at pre-covid levels.
[chart: 2/10 blue line, 5/30 white line and red/gold red line]
When asked by Steve Liesman at the previous FOMC press conference why the Fed didn’t immediately stop buying treasuries, Powell said that monetary policy works best when it’s moving in a predictable way, and that it works in concert with market expectations. Now all of a sudden we have Bostic floating an initial 50 bp move. Why not just hike by 200 bps and immediately get real rates closer to normal Raphael? Here’s China’s President Xi from January 18: “If major economies slam on the brakes or take a U-turn in their monetary policies, there would be serious negative spillovers,” Xi said. “They would present challenges to global economic and financial stability, and developing countries would bear the brunt of it.”
Currently FFF2/FFF3 is 120.5 bps, a new high, forecasting nearly 5 hikes in 2022. EDH2/EDH3 closed at a high of 113 on Thursday. The Fed’s most rapid hiking cycle was in 1994. After one and a quarter years at the then historic low 3% FF rate, the Fed started 1994 with three consecutive 25 bp hikes in 3 months, followed by 50 in May. By the end of 1994 Mexico devalued the peso: the tequila crisis. An IMF bailout ensued. If I recall correctly, the Fed, in hindsight, considered its course of action as too aggressive, which contributed to economic dislocations. That one was a bit different from the current tequila crisis that Diageo mentioned a few days ago on an earnings call. There are supply constraints due to barrel aging and bottle shortages. But a financial crisis could easily develop if the Fed goes too fast. Which, naturally, leads to more tequila consumption. You can see where I’m going here. It’s a vicious cycle.
OTHER MARKET THOUGHTS/TRADES
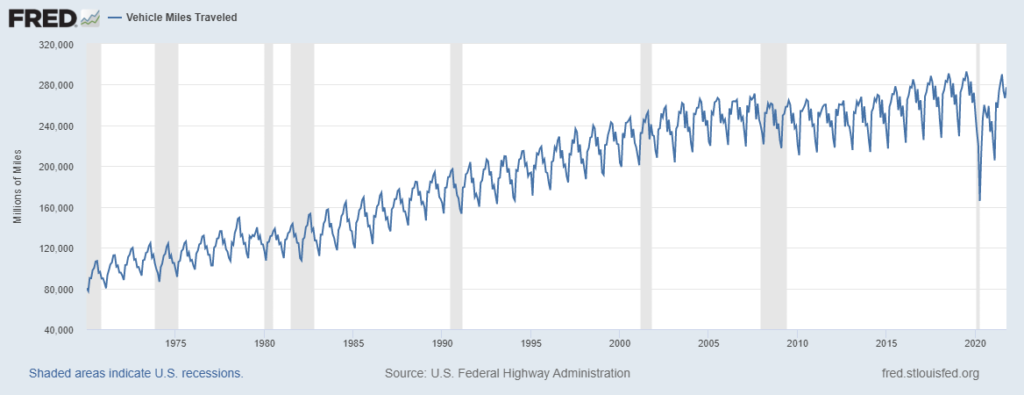
WTI ended the week at 86.82 (CLH2). Highest level since 2014. One might think that it’s due to the rebound in economic activity, and that’s how things should work: more demand, higher prices, more investment in productive capabilities which brings increased supply thus capping prices. But in this case, perhaps the war on fossil fuels has something to do with it. I’m not sure how this data is computed, but below is a chart from the St Louis Fed on Vehicle Miles Traveled. The 2019 peak has not been exceeded.
As mentioned above FFF2/FFF3 calendar settled 120.5, nearly 5 hikes. April FF settled 9962.5, more than one hike. FFJ2/FFN2 settled 40, closer to two hikes than one in the period that encompasses the May and June FOMCs.
Last week I thought EDH4/EDH5 was an enticing buy at 6.5. Powell crushed it. Settled 1.5. As my friend Larry used to say, “I don’t want the cheese any more, just help me get my head out of this trap.”
On Tuesday ISM Mfg is released. Price index topped in June at 92.10. The high in 2018 was 79.5. Last was 68.2 with expectations of 67.0. Payrolls on Friday with NFP expected 150k from 199k.
The Fed’s semi-annual testimony to Congress is usually at the end of February, though I don’t see it on the calendar yet. If stocks now take a tumble, the Humphrey-Hawkins testimony might be the setting for a dovish pivot.
| 1/21/2022 | 1/28/2022 | chg | ||
| UST 2Y | 103.2 | 116.8 | 13.6 | |
| UST 5Y | 155.7 | 161.9 | 6.2 | |
| UST 10Y | 174.4 | 177.7 | 3.3 | |
| UST 30Y | 206.0 | 208.1 | 2.1 | |
| GERM 2Y | -61.8 | -60.7 | 1.1 | |
| GERM 10Y | -6.5 | -4.5 | 2.0 | |
| JPN 30Y | 70.8 | 75.4 | 4.6 | |
| CHINA 10Y | 270.7 | 271.1 | 0.4 | |
| EURO$ H2/H3 | 104.0 | 111.5 | 7.5 | |
| EURO$ H3/H4 | 45.5 | 34.0 | -11.5 | |
| EURO$ H4/H5 | 6.5 | 1.5 | -5.0 | |
| EUR | 113.44 | 111.49 | -1.95 | |
| CRUDE (active) | 85.14 | 86.82 | 1.68 | |
| SPX | 4397.94 | 4431.85 | 33.91 | 0.8% |
| VIX | 28.85 | 27.66 | -1.19 | |
Everything you need to know is in a Dead song
January 28, 2022
Set up, like a bowlin’ pin
Knocked down, it gets to wearin’ thin
Truckin’ Grateful Dead
–If you just look at EDM’24 from yesterday’s trade, you might say, “What’s the big deal? Nothing moved. EDM4 is down half a bp.” However, EDH’23, the weakest contract, was down 12.5 bps and EDM’27, the strongest, was UP 10.5. I.e. massive curve flattening. Powell was somewhat dismissive of a reporter’s question about the flatness of the curve at Wednesday’s presser…paraphrasing: “2/10 is about 75 bps, and that’s fairly steep, within the range of what is usual.” Well yes, it WAS about 75 but yesterday fell 13.5 bps to a new recent low of 62.4. Red/gold euro$ spread settled 21.5 down 19 bps, only about 1/4% from the inverted low of 2018. 5/30 closed 43.3, down 6.8 to a new low for the move, and likewise only about 25 bps from 2018’s low. From the KC Fed paper in October of last year: “A flat or inverted yield curve may signal pessimism about the economic outlook. More importantly, however, it can also materially affect firms that profit from the spread between short- and long-term interest rates, such as banks and investment funds.” Helpfully, Bloomberg today is leading with a story about the possibility of an initial 50 bp “shock and awe” move from the Fed. Dopes.
–Add into the mix Powell’s comments about federal gov’t stimulus, it will be negative this year. After yesterday’s report of 6.9% Q4 GDP growth, the government’s contribution will now be one of restraint. Is Robinhood’s (HOOD) plunge of 6.5% to just 11.61 from an average of about 41 in October and Sept last year a reflection of what happens when the gov’t checks run out? Or should we just consider AAPL’s $30b profit and say the private sector will gracefully transition from gov’t support? How will April’s tax date affect things? In the very short term, inflation remains the number one issue, with PCE prices released today, expected 5.9% from 5.6% last. U of Mich inflation expectations also released.
–A friend pointed out the price of the expiring Feb Nat Gas price, +1.988 to 6.265 (while NGH2 was only +0.247 at 4.283). Just a one-off supply demand blip I’m sure, but a 47% rally in a day is still notable. Another friend said conditions in the muni market may be the worst in recent history, with bid/ask spreads on high quality bonds 20 to 30 bps wide. Bid/offer sizes in treasuries and euro$’s seem to have dwindled recently as well. There was a buyer yesterday of 10k Feb week-1 (emp day) 122p for cab7, and of some way out US puts also on Week-1 Feb. Every so often, a Federal Reserve bank puts out a paper decrying reduced liquidity in the treasury market, noting possibly broader (dire) ramifications. Well, how’s it going to be when the Fed starts cutting the balance sheet? I figured it might be time to buy some vol, so I checked Feb VIX calls. The 60 call was 80 cents bid! I bought some anyway, just to ensure for the broader trading community that a crash would thus be averted, at least until Feb 17.
The end of accommodation
January 27, 2022
–Can someone please tell Powell that employment is a lagging indicator? A few months ago his concern was that we needed to get the marginal worker re-employed, now he is amazed at how strong the employment market is (which he repeated several times). It was a much more hawkish performance than I expected, and he nonchalantly brushed off a question about the risks of a flat or inverted yield curve. The curve was the clue in 2018 that the Fed had gone too far, leading to a 20% drop in equities in Q4. In any case, near eurodollar contracts were absolutely hammered. Reds (2nd year) closed -9, but sold off another 9 before the end of the electronic session. FFJ2 (April funds) which price the March FOMC, traded 9961 late, which I think of as 25 bps with a 25% chance of 50 (should settle 9967 on a hike of 25 only). Powell has guided the market into expecting front-loaded hikes, and has moved the conversation on balance sheet reduction forward. EDH2/EDH3 settled 105, forecasting a bit more than four 25 bps hikes over the year, but interestingly, FFF2/FFF3 settled 107.5, the first time this nearer spread exceeded the latter.
–TYH 127p were quite active again, with open interest dropping 37k contracts to 317k. Early in the day they traded 19, but as TYH approached strike trading 127-08, a late day seller exited about 50k from 26 to 30. Settled 29. The most OI in any April TY put is the 126.5 strike with 40k open.
–CLH2 is at another new high 87.40 this morning. Bitcoin probably on its way to 30k as liquidity dissolves across markets.
–The added press release/link “Principles for Reducing the Size of the Fed’s Balance Sheet” was another zinger: “…planned approach for significantly reducing the size of the Federal Reserve’s balance sheet.”
“…reducing the size of the Federal Reserve’s balance sheet will commence after the process of increasing the target range for the federal funds rate has begun.”
“…the Committee intends to hold primarily Treasury securities in the SOMA, thereby minimizing the effect of Federal Reserve holdings on the allocation of credit across sectors of the economy.”
Translation, we’ve juiced the housing market by buying MBS, and now that we’ve sucked those buyers in, we’ll let spreads normalize. (Clarida probably already bought his puts on homebuilders…). https://www.federalreserve.gov/newsevents/pressreleases/monetary20220126c.htm
4 hikes a year
January 26, 2022
EDH2/EDH3 one-year eurodollar calendar settled 99.0
FFF2/FFF3 one-year Fed Fund calendar settled 97.75
It’s all teed up for you Jay. Don’t f it up
Steeper curve as hike prospects lessen
January 25, 2022
–An early plunge in stocks reversed like the end of the Bills Chiefs game with the indexes ending in the green in overtime. The possibility of stock market weakness made some realize that perhaps their aggressive rate hike calls have been over-zealous, and the short end modestly re-priced near term hiking prospects. For example, on Thursday EDZ2 settled at 9865, but it was 9877.5 at yesterday’s settle. EDH2/EDH3 one-yr calendar made a high of 110 bps on Thursday, but closed 96.5 yesterday, an over/under on 4 hikes. FFF2/FFF3 settled down 5 at 92.75.
–As the odds of hiking decreased, the curve steepened. On the dollar curve: reds (2nd yr) +8.875, greens (3rd) +7.25, blues (4th) +4.25 and golds (5th) +2.75. In treasuries, the two yr yield fell 3.8 while 30s were up 2.8. Even as stocks were plunging, TYH appeared capped at 128-18 and settled at 16+, with the cash yield at 1.74%, down a fraction of a bp. Long end is again under pressure this morning with USH2 155-01, down 28 even as stocks take another swan dive.
–I’ve found that when volatility jumps like this, short-term technical levels become much more important in terms of trade location. For example 126-26+ is the halfway retrace from last week’s low to yesterday’s high in TYH2, I would look to be a buyer there. Five-year auction today. FOMC tomorrow.
Roller Coaster Markets
January 24, 2022
–Yields fell Friday as stocks melted, with both SPX and NDX closing below 200 DMAs. On the euro$ curve, reds outperformed, up 8.5, while golds (5th year) were up 7.0. Ten year was the leader on the treasury curve, with the yield falling 8.7 bps to 1.744%. Open interest was down significantly in every treasury contract apart from 2’s as shorts pared back and Feb options expired. FV -51k, TY -34.5k, UXY -33.7k, US -16k and WN -1.3k. New lows Friday in 5/30 at 51.6, and the ten year treasury/tip breakeven at 2.36%.
–Bitcoin is below $34k this morning. According to coinmarketcap.com total cap of cryptos is about $1.5 trillion, an equal amount has vanished since the beginning of November. For example, in early Nov, Ethereum was 4800, this morning it’s sub 2300. It’s the wealth effect in reverse, and the Fed will likely tone down the hawkishness at Wednesday’s FOMC as financial assets in general weaken. Treasury auctions 2s and 5s today and Tuesday, with 7s following on Thursday. IT has already been quite a ride in ESH since last night. Early ESH trade 4427, or up 37 from Friday’s close. As of this minute it’s 15 at 4375, a new low.
Gimme three steps
January 23, 2022
Gimme three steps, gimme three steps, mister
Gimme three steps toward the door?
Gimme three steps, gimme three steps, mister
And you’ll never see me no more. Lynyrd Skynyrd
I was running down the road and the classic Lynyrd Skynyrd song came on, which I of course cranked up, and it reminded me of the old Wall Street adage, ‘Three Steps and a Stumble’. This pithy rule says that when the Fed hikes three times, stocks are likely to suffer a serious setback. Given the Fed’s enormous transformation from an institution that had previously relied on changes in the Federal Funds rate to calibrate the economy, into an Oz-like entity that has stretched its dual mandate of price stability and full employment to encompass financial conditions, climate risks, and a healthy dollop of input on economic and social equality, ‘three steps and a stumble’ has headed out toward the door.
Anyway, as I was driving along, I once again thought I had stumbled upon a novel and entertaining tie-in between Fed policy and classic Southern Rock. As I surfed on Saturday morning, I was highly disappointed to see that Liz Ann Sonders had already stolen my idea in 2017, with her Gimme Three Steps and a Stumble article from 2017 (linked at bottom). Had I not been listening to the Allman’s Midnight Rider in the background I might have been a bit deflated and abandoned the idea, but I’m bound to keep on riding.
The fact is, the short end of the market had already priced four hikes before this week’s stumble (EDH2/EDH3 spread only moved from 105 to 104 bps from Friday to Friday). A greater concern is likely balance sheet drawdown (which will never happen). There are other looming challenges for the US economy which I will mention below.
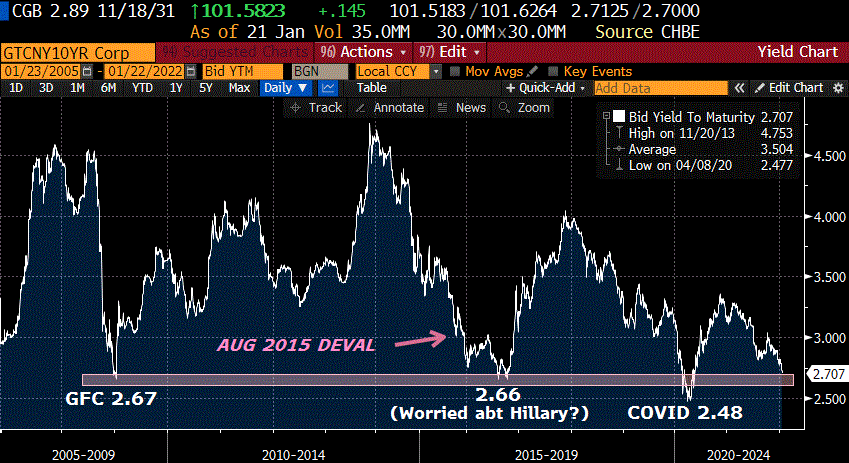
The US is dependent on financial asset prices in the same way China was dependent on property development. It’s a slo-mo train wreck in China, with a new low in the ten year yield to 2.70%. That low equates with other stressful periods as shown in the chart below. I know nothing about China’s monetary policy, but I think I know when a market is telling me all is NOT well. The Beijing Olympics run through February 20, but after that I would think China will take steps to weaken its currency.
Broad markets in the US are also sending the signal that all is not well. This week CCMP (Nasdaq Comp) decisively closed below the 200 DMA and is just below the 0.618 retrace from the March 2021 low to the Nov 2021 high. Anyone who bought this index in Q3 or Q4 is under water. Nasdaq 100 likewise closed decisively below the 200 DMA, but is not quite below the Oct 2021 low. SPX closed just under the 200 DMA, and RTY, which went sideways throughout 2021 ended the week at 1988, the lowest level of all of 2021 except for the first two sessions of the year. Remember that total market cap to GDP started the year over 200%, so a 10% drop in market cap equates to around 20% of a year’s income.
And then there’s this from Credit Bubble Bulletin:
Sinking 10.0%, the Bank Index actually suffered larger losses this week than the Nasdaq100 (down 7.5%). Goldman Sachs fell 9.7%, JPMorgan 8.1%, Bank of America 6.2% and Citigroup 5.5%. Robinhood sank 14.3%, Wisdom Tree 9.7%, Interactive Brokers 7.3%, and Charles Schwab 6.6%.
The Bank Index is symbol BKX and a 10% loss in a week is quite rare. Looking back, there’s another interesting note: this index had topped in February 2007, just prior to the Bear Stearns mortgage fund blow-up that preceded the GFC. SPX didn’t ultimately top until October 2007.
So, what is the US looking forward to? An April tax date with the prospect of large cap gains taxes due because of the cash-infused gains of 2021. An election that is going to mean NO MORE fiscal stimulus. A President who is inviting the Russians to waltz into Ukraine with the State Dept preparing to evacuate US diplomats from the embassy. One other factor to keep in mind is that PPP loans from the Cares Act of March 2020 had two-year terms. I would imagine almost all of these loans either have been or will be forgiven. However, a friend (thanks DK) mentioned that commercial real estate may come under added stress, and that banks will have to start writing down asset values. Finally, the Atlanta Fed’s GDP Now estimate for Q4 has declined from about 9.8% at the start of December to 5.1% now. The US is clearly looking at decelerating growth ahead.
What’s the easiest way to ameliorate damage to bank balance sheets and make sure lending continues? Through a steep yield curve. What are BKX and a new low in 5/30 at 51.5 bps telling us? That a BBG article titled “Goldman Sees Risk Fed Will Tighten at Every Meeting from March” is simply ludicrous. This week’s FOMC on January 26 is unlikely to emphasize a hawkish tilt. More likely is that it will signal a steady and slow adjustment (one hike per quarter) in the FF target to gently lean against inflationary pressure.
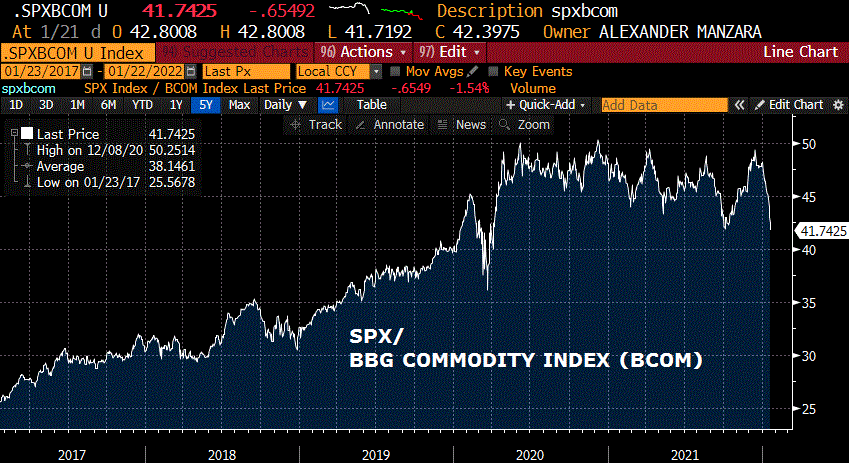
Bonus chart below shows the ratio of SPX to BCOM, the Bloomberg Commodity Index. New low this week as commodities outperformed stocks. I only show the past five years, but as recently as 2013 this ratio was 10. It hit 50 in 2020 and is now 42. Another possible signal of deflation in financial assets ahead.
OTHER MARKET THOUGHTS/TRADES
Friday’s risk-off treasury rally saw large declines in futures open interest: FV -51k, TY -34.5k, UXY -33.7k, US -16k and WN -1k. While there was notable selling in TYH 127 puts which have massive open interest, the decline there was only 10k to 323k. (18/64s with -0.24d vs 128-10). TYH 126 puts saw new buying, with OI +26k, settled 8/64 with -0.12 delta. There was a new seller of some 75k FVH 120 call which settled 17.5/64 delta 0.35, OI +63k, vs FVH2 119-180. Underlying sentiment in treasuries continues to be bearish, but moves in risk assets are causing a pare-back of positions.
There was a buyer last week of about 75k EDM2 9925/9937.5/9950 call fly at 2.25 with futures around 9920.5. EDM2 settled 9923.5 and the fly at 2.25. This trade should work out on one 25 hike at both March and June FOMC meetings.
| 1/14/2022 | 1/21/2022 | chg | ||
| UST 2Y | 96.5 | 99.1 | 2.6 | w/I 103.2 |
| UST 5Y | 154.4 | 154.4 | 0.0 | w/I 155.7 |
| UST 10Y | 177.0 | 174.4 | -2.6 | |
| UST 30Y | 211.3 | 206.0 | -5.3 | |
| GERM 2Y | -58.3 | -61.8 | -3.5 | |
| GERM 10Y | -4.5 | -6.5 | -2.0 | |
| JPN 30Y | 71.7 | 70.8 | -0.9 | |
| CHINA 10Y | 279.2 | 270.7 | -8.5 | |
| EURO$ H2/H3 | 105.0 | 104.0 | -1.0 | |
| EURO$ H3/H4 | 48.0 | 45.5 | -2.5 | |
| EURO$ H4/H5 | 5.5 | 6.5 | 1.0 | |
| EUR | 114.16 | 113.44 | -0.72 | |
| CRUDE (active) | 83.30 | 85.14 | 1.84 | |
| SPX | 4662.85 | 4397.94 | -264.91 | -5.7% |
| VIX | 19.19 | 28.85 | 9.66 | |
https://www.advisorperspectives.com/commentaries/2017/05/23/gimme-three-steps-and-a-stumble
Two out of three ain’t bad
January 21, 2022
–NFLX fell 1.5% to a new low yesterday on weaker than expected subscriber growth. PTON continued its plunge, falling 24% to a new low, a complete roundtrip from the onset of Covid in March 2020. It started around 20, exceeded 160 at the end of 2020, and is now back at 24. Now for the bad news, Meat Loaf died, the artist who gave us “two out of three ain’t bad”. So NFLX and PTON are good news? Yes, because they were the Covid darlings, and if they have rolled over, so has covid. Another aspect is that much of the business world has moved to a subscription model; no one actually owns anything anymore. Perhaps we’re seeing the initial warning stages which questions the validity of that particular model.
–ESH had an astonishing range yesterday going into today’s option expiration. An early gain of 70 points from Wednesday’s settlement vanished; at the low ESH was down 87. Feb options on treasury futures also expire today, with TYH appearing to peg the 128 strike, but it could be a wild day today. Predictions of a 50 bp hike for the Fed’s first move appear a bit outlandish after yesterday’s price action. At the futures settlement the dollar curve was flatter, with red eurodollars (2nd year) down 2.75 on the day and further out contracts ranging from -1.5 to +1.5. 5/30 treasury spread edged to a new low just above 52. Red and green eurodollars are currently +4 to +4.5.
Every quarter
January 20, 2022
–While financial commentators have wildly sketched out scenarios for 6 to 7 hikes this year, a buyer of 70k EDM2 9925/9937.5/9950 c flies is targeting the quarterly meetings. EDM2 is currently 9921.5. The call fly traded and settled 2.25. Max profit of 10.25 occurs at middle strike 9937.5. 3m libor set yesterday at 25.514 bps, but it’s been grinding up as we move closer to the first hike, a week or two ago it was more like 20 to 22. Let’s take 22, and forecast a hike in March and one in June leading to a libor setting of 72 or a final settle of 9928.0 for EDM2. Because the June meeting is just after contract expiry, there’s a chance that the contract might not even price 100% odds of a hike, so it could conceivably trade 9930 or a bit higher. There is an FOMC meeting on 27-July; odds of a hike at that meeting would negatively impact the price of EDM2. So the fly buyer is most likely thinking March, June. Sept and Dec. Four on the year.
–Many references to Nasdaq being in “correction territory”, down 10% from the high. Once again, it’s worth a mention that total market cap to GDP is over 200%. A drop of 50% would erase a year’s worth of income. If you believe in the wealth effect, and I believe the Fed does, then there will be no surprises in the tightening schedule because a hard break in asset prices could throw the economy into a tailspin. By the way, a long term mean of mkt cap to gdp is 85 to 90%.
–Yields eased yesterday with tens -4.1 bps to 1.825%. There was an exit sale of 15k USH 153/152 put spread (19 settle ref 154-18) corresponding with yesterday’s 20-yr note auction. 5/30 spread grinding to a new low at 52.7.
–Today’s news includes Jobless Claims (225k) and Philly Fed (19.0 from 15.4).

