
Finding neutral ground
Dec 5, 2019
–Both bonds and SP500 gave back about half of the large moves seen Monday and Tuesday to leave markets in a more neutral stance going into the employment data. On Nov 21, TYH0 topped at 130-04 and on Tuesday at 130-045, and is now 129-135, leaving a double top. As seen on the chart below, EDZ20 has left three tops at 9857 to 57.5 since the beginning of November. It would likely take a very weak non-farm payroll number to pierce these levels. The employment report on Friday expected to show NFP +180k
–According to an article on Reuters yesterday: “Capital investment by Chinese firms has ground to its slowest pace in three years…a Reuters analysis showed.” While wrangling for a Phase 1 trade deal continues, the below article from the South China Morning Post is of broader interest: General Mark Milley, chairman of the US Joint Chiefs of Staff and his Chinese counterpart General Li Zuocheng conducted an “introductory” telephone call, to “…discuss building a constructive and results-oriented defense relationship.” “The two military leaders agreed on the value of a productive dialogue effectively managing differences and cooperation on areas of common ground.”
–I don’t know whether to take comfort from that article or the exact opposite.
–EDH0/EDH1 settled -25.5. FFF0/FFF1 at -29.5. EDH0 9825 straddle settled 12.0, a 24 bp range breakeven around the 9825 strike. The market has gotten pretty comfortable with the idea that the Fed is just going to manage things with repo operations and not adjust the FF target all that much next year. I’m not all that confident in that sort of assessment.
Stalled negotiations
December 3, 2019
–Yields rose and the curve steepened yesterday, even as stocks fell with the prospect of stagnant trade talks and slower growth. ISM Mfg yesterday was only 48.1 and Prices were soft at 46.7, both weaker than expected. The ten year yield rose 5 bps to 1.826%, though it’s reversing some of that rise today as Trump said that a China trade deal may have to wait until after the election.
–Yesterday, 2/10 rose 4.4 bps to 21.8, 5/30 was up 3.7 to 62.2. Red/gold euro$ pack spread posted a slight new recent high at 21.625, +2.125 on the day.
–Feb/April FF spread settled -4.5 bps, but will likely to begin to invert further if stocks continue to be pressured by year-end profit locking. There’s a fairly large open position consisting of long EDM0 9850/9875cs vs short 9837/9825ps in size greater than 100k. Yesterday the put side was covered in size of 20k (7.0 paid cov’d 9837.5) and overnight 20k of the call spread was sold at 5.0 vs 38.5.
–The calendar is fairly full over the near term in what should be less liquid conditions. FOMC one week from tomorrow on 11th. China tariffs set to ratchet up on Dec 15. Employment report is this Friday.
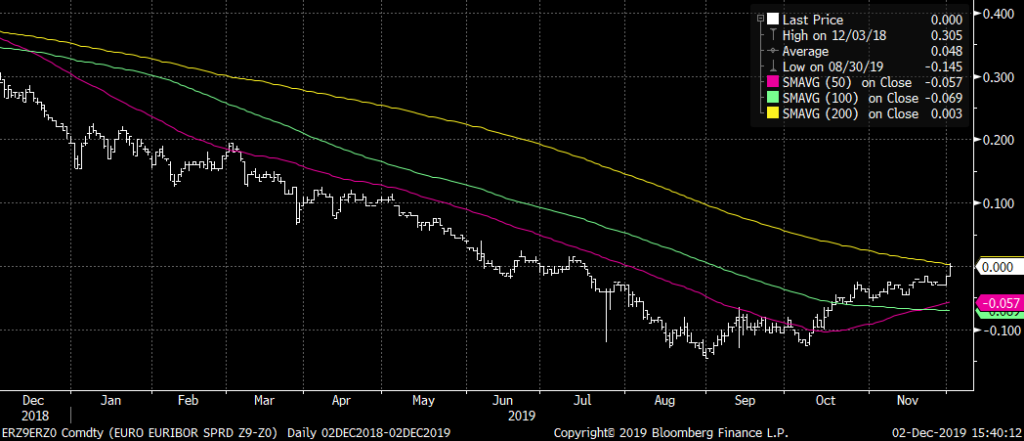
–Chart below is Dec’19/Dec’20 Euribor spread, traded positive for the first time since summer.
–Trump threatening to tax champagne and other French products in protest of the digital tax. This is the most damaging of all. Because, without fine champagne (no one can long resist the lure of those delicate bubbles…) Christopher Walken would have been unable to make, ‘The Continental’
https://www.nbc.com/saturday-night-live/video/the-continental/2869208
Dr Woo
December 1, 2019 – Weekly comment
This week we start out with some notes on Dr Copper, a commodity previously said to have a PhD in economics because it was such a ubiquitous manufacturing input and therefore its price indicated turning points in the economy. At this point, I’m not sure if its price has any predictive power, since such a large slice of activity these days is in service, information, and money flows. However, there’s an interesting note on ZeroHedge about the likely $300 million dollar bond default of Tewoo Group, a state-owned enterprise in China’s Tianjin province. The news here isn’t unexpected; its bonds have already been hammered amidst rating downgrades. The news is that China is allowing restructurings without a bailout, and the company is apparently asking investors to accept losses of 64% on its bonds. Back in April, Tewoo Group was facing a liquidity crunch. Just for background, “The group ranked first among Tianjin Top Hundred Enterprises and is the first company in Tianjin to be listed among the Fortune Global 500.” By way of comparison, Tewoo is said to have annual revenues of $66 billion, which is just about the same as Archers Daniels Midland in the US ($64B in 2018). Tianjin is the third to fifth largest municipality in China depending on measurement. Can you imagine if a city like Chicago in the US was staring down bankruptcy due to gross financial mismanagement? : – /
Anyway, let’s get back to Tewoo. But not before another tangent… whenever I see ‘woo’ it reminds me of a story about Don Wilson, a former euro$ option pit trader who built the financial powerhouse DRW. In the early days, Eurodollars traded in Singapore on the SIMEX floor during night hours in the US. Of course, Wilson was a large trader. His account number was DRW 00, which would be written on the tickets. So naturally, in that part of the world he was then known as Dr. Woo. Misinformation in markets? “Dr Woo is a large seller.” To continue,
Tewoo applied for a bank loan extension on 3 April 19. Subsequently on 8 April, the group announced the sale of its copper stocks to ease its tight financial liquidity condition. On 9 April, Fitch Ratings placed Tewoo Group on negative watch, and downgraded the company’s rating from ‘BBB’ to ‘BBB-’ on 18 April. Finally on 29 April, Fitch again downgraded Tewoo’s credit rating, this time by six notches to ‘B-’.
In late March to early April copper was trading around $2.90/2.95. By the beginning of June it fell to 2.63 and remains around that level now. For a longer term perspective, the current price (HGH0) is 2.6615, having been as low as 2.00 at the end of 2015 and into 2016 as emerging markets and oil were in a wash-out, and as high as 3.30 in the middle of 2018 when all assets were buoyed by the stimulus of the US tax package. In the big picture, this price action probably isn’t all that informative.
But perhaps Tewoo and Tianjin are rather important in a larger sense. In 2007/08, the US exported a global financial crisis, courtesy of the US mortgage market and transformation of questionable cash flows into tailored financial products. China has slowly been letting the veil of a guaranteed backstop slip for SOEs. This weekend, PBOC chief Yi is assuring that the central bank will not devalue, nor engage in quantitative easing. (BBG) “China’s monetary policy should remain prudent with room for adjustment as a prolonged downturn in the global economy is likely.” From South China Morning Post, quoting Yi, “We should not let the money held by the Chinese people become worthless… Maintaining positive interest rates and an upwards inclined yield curve is generally conducive to the economic entities, and in line with the Chinese people’s saving culture, thus beneficial to the sustainable development of the economy.”
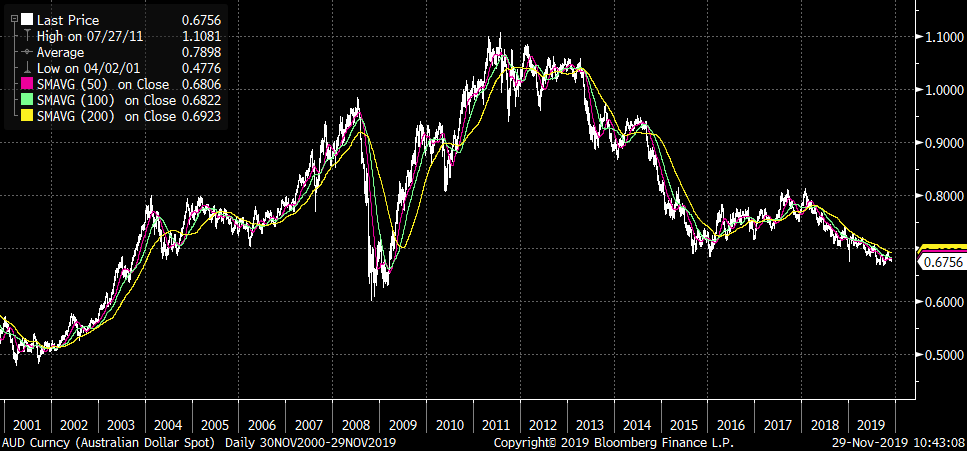
With respect to a prolonged global slump, note that S Korea’s exports fell for the 12th consecutive month, falling 14.3% year-over-year in November. And, as a reflection of China’s weakness, consider the Australian dollar which has fallen to 0.675 from over 1.00 as recently as 2013, and is within shouting distance of the 2008 crisis low. So even though the Tewoo numbers aren’t all that large, the story may be emblematic of troubles ahead.
OTHER MARKET/TRADE THOUGHTS
Let’s review a few interest rate straddle markets.
The following table shows prices from 8/30/2019 (with days until expiry as of Sunday 9/1/2019)
| Contract | Settle | strddle strike | strddle pr | dte |
| EDH20 | 9845.0 | 9850.0 | 43.5 | 197 |
| EDH21 | 9883.5 | 9887.5 | 69.5 | 561 |
| EDH22 | 9883.0 | 9887.5 | 86.5 | 925 |
| 2EH2 | 9883.0 | 9887.5 | 46.0 | 194 |
On Friday 11/29/2019 prices are as below (days until expiry as of Sunday, 12/1/2019)
| EDM20 | 9838.0 | 9837.5 | 24.5 | 197 |
| EDM21 | 9854.5 | 9850.0 | 60.0 | 561 |
| EDM22 | 9848.5 | 9850.0 | 83.0 | 925 |
| 2EM2 | 9848.5 | 9850.0 | 41.5 | 194 |
At the end of August, EDH0/EDH1 was -38.5, as easing was expected to continue. Currently, in the same relative time slot, EDM0/EDM1 is -16.5 as forward easing expectations have declined substantially. Near straddles have, perhaps unsurprisingly, compressed. With 197 days to go, the EDH0 atm straddle was 43.5, but EDM0 is now only 24.5. However, there is still a bid for longer dated vol. With 925 days to go the EDH22 atm straddle was 86.5 at the end of August and now, with 925 dte, EDM22 is 83.0. Of course, relative to strike price changes, even the long dated straddles have come in quite a bit, as 86.5 is a much bigger percentage of the 1.125% strike than 83 is relative to a 1.50% strike. In any case, near term premium has come in due to the Fed conveying a message of stability. However, the global economic picture could change significantly after the US election. In a way, this argues for owning premium in 2021. At the end of August, the red/green March (EDH21/EDH22) atm straddle spread was 17 bps. But the same relative straddle spread now i(EDM21/EDM22) is 23 bps.
The Fed seems to have contained the repo problem. However, if the PBOC is correct about a continued global downturn, it’s still possible to see a rate cut here, if not in December then perhaps as early as January. February Fed Funds reflect little chance of an ease at the Jan 29 FOMC, settling at 98.465 on Friday, and April FF, which also capture the March FOMC settled at just 98.505.
There’s a good deal of news this week, culminating in the employment report on Friday. On Monday, we get ISM Mfg, which is expected to show a small improvement to 49.2 from 48.3. On Wednesday, ISM Services expected steady at 54.5, from 54.7. Factory Orders and Durables also out on Wednesday. I think it’s likely that we will see a bit more of a price concession in long treasuries going into the employment report as liquidity and USD strength continue to underpin US equity prices.
| 11/22/2019 | 11/29/2019 | chg | |
| UST 2Y | 161.2 | 160.2 | -1.0 |
| UST 5Y | 161.5 | 161.8 | 0.3 |
| UST 10Y | 177.1 | 177.6 | 0.5 |
| UST 30Y | 222.2 | 220.3 | -1.9 |
| GERM 2Y | -63.6 | -62.6 | 1.0 |
| GERM 10Y | -35.9 | -35.3 | 0.6 |
| JPN 30Y | 42.1 | 40.7 | -1.4 |
| EURO$ Z9/Z0 | -40.3 | -37.8 | 2.5 |
| EURO$ Z0/Z1 | -5.0 | -4.5 | 0.5 |
| EUR | 110.23 | 110.19 | -0.04 |
| CRUDE (1st cont) | 57.77 | 55.17 | -2.60 |
| SPX | 3110.29 | 3140.98 | 30.69 |
| VIX | 12.34 | 12.62 | 0.28 |
https://secure.fundsupermart.com/fsm/article/view/15038/debt-crisis-erupts-at-tianjin-s-largest-soe
Credit flashers
November 29, 2019
–Stocks slightly lower as Trump signed the Hong Kong democracy bill, further complicating efforts for a trade deal with China. On Wednesday, US yields rose, with tens up 3 bps to 1.769%. This morning shows little change with TYH0 129-155. Today features an early close at 1:15 EST.
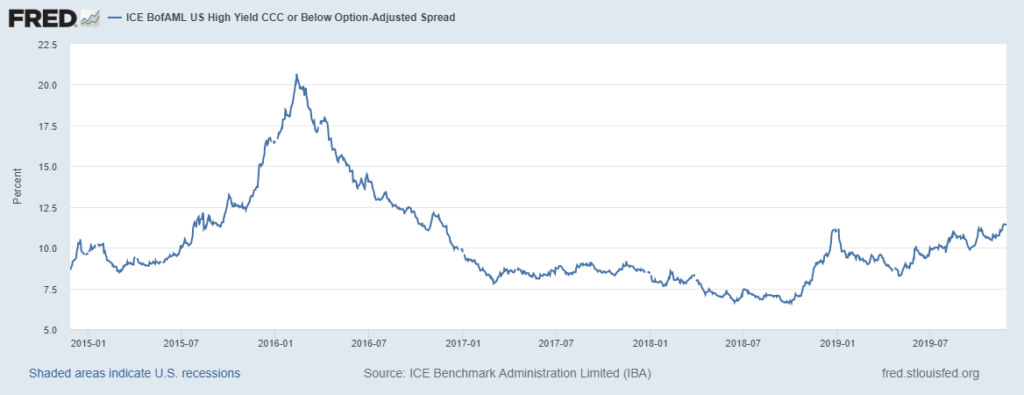
–Bloomberg running a headline this morning ‘China Financial Warning Signs are Flashing Almost Everywhere’. The story notes deteriorating health at smaller lenders and corporate debt at 165% of GDP in 2018. That’s an extraordinary ratio. As a comparison, according to an article in Forbes, as of July, US business debt (corporate plus small business) was 74% of GDP. A headline on FT says US distressed debt is flashing warning signals (hmmm…isn’t that why it’s DISTRESSED?). The sub-headline is: ‘More than 200 bonds in junk-rated index are trading at levels implying severe strain.’ Not too hard to believe, the St Louis Fed database shows that CCC option adjusted spread has now surpassed the high from late 2018, when stocks were cratering. In 2018, the CCC spread reached 11.15%,
–We’re now two weeks away from December eurodollar expiration. 0EZ, 2EZ and 3EZ 9850 straddles settled 12.0, 12.5 and 13.0 respectively on Wednesday, about fair. Eurodollar calendar spreads continue to convey the sense that the Fed will try to extend a pause through 2020, with a slight lean toward further modest ease. April Fed Funds settled 9850 or 1.50%, only 5 bps below the current EFFR with Dec, Jan and March FOMC’s in between. EDH0/EDM0 settled -9.0 (98.27 and 98.36), while Jan’20/Jan’21 FF spread settled -27.5, indicating just one ease next year.
Calm before the storm
Nov 27, 2019
–Even as stocks continue to make new highs, yields are falling. Tens fell a couple bps yesterday to 1.738%. New lows in several euro$ one-year calendars, for example EDM0/EDM1 closed down 0.5 at -19.0 and EDU0/EDU1 down 1 at -11.5. On November 7, this latter spread had actually edged into positive territory, closing +0.5. As several Fed officials have recently indicated policy is now appropriate, the front contracts are limited to the upside while backs press higher. This can also be seen in straddle spreads as near (white) straddles compress while long-dated reds and greens move higher. This was specifically noted by friend BC on the floor: EDM0 9837^ went from 31 on Nov 4 to 26 now, while EDM2 9850^ went the opposite direction, from 78.5 to 84.5 over the same time period. The election and possible political upheaval is likely firming up long dated vol.
–Given next year’s election, the Fed would probably want to ease, if needed, as early as possible in the year. Somewhat surprising that April FF only trade 9851.5, a premium of just 7 over the expiring November contract. There are FOMC meetings in late Jan and mid-March. As a comparison, EDH0/EDM0 prints -10.5.
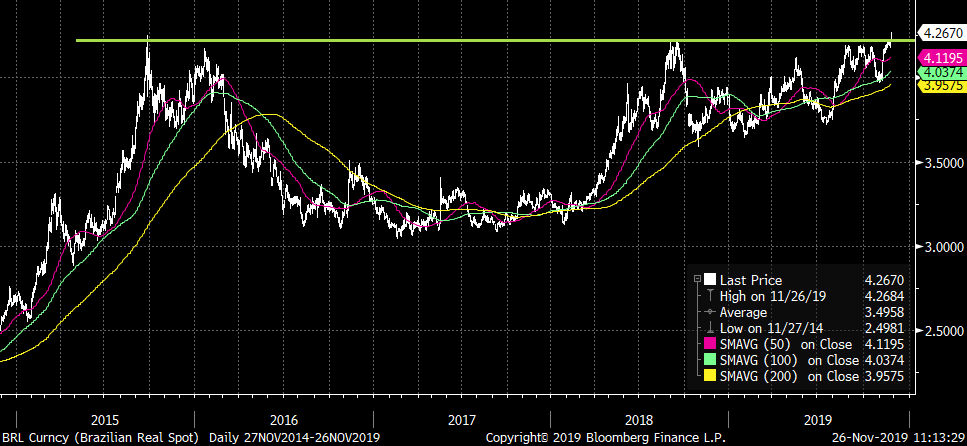
–Chart below shows long term breakout on BRL. The Brazilian currency is weakening in spite of intervention. That chart portends much further weakness in the real.
–In the US, news today includes Durables and Core PCE prices, expected +1.7% yoy. 7 year auction.
Does M2 Matter?
November 24, 2019
On Monday, President Trump called an unscheduled meeting with Fed Chairman Powell. Here’s what Powell could have said in that meeting:
Mr. President, I have
taken several strong steps in support of your re-election campaign. Beginning in the second half, we’ve cut rates
three times. It’s well known that
monetary policy acts with a lag of six to nine months, so this should help
power up the economy throughout 2020. In
addition, we’ve implemented new stealth QE by buying $60 billion in t-bills per
month. This action should provide plenty
of liquidity to keep equities firm going into next year. While we’ve continued to downplay inflation
threats, we’ve engineered a surge in money supply. As of November 11, the growth of M2 is 7.4%
annualized. However, in the last quarter
we’ve really ramped it up: from August 12, 2019 to November 11, the annualized
growth rate is 10%. In fact, this is the most rapid acceleration since our response
to the great financial crisis. Again,
the effects from this acceleration will likely kick in for the new year, just
after what will clearly be a somewhat soft Q4, which you can blame on
uncertainties related to wealth taxes and medicare for all. Because of the hiccup in late 2018, year over
year data comparisons are about to improve.
We’ve guided the market to expect a pause in rate cutting at the
December FOMC; this was done in order to make sure we don’t let a trend in yield
curve steepening take hold. It’s
essential for the housing market that long end rates don’t jump. This is yet
another way that we can ensure that the market can absorb increased treasury
supply from your excellent pro-growth policies. In short, the Fed has taken
concrete steps to accelerate economic growth as the election nears. Good luck
Mr President.
Trump’s tweeted response: “Just finished a very good & cordial meeting
at the White House with Jay Powell of the Federal Reserve…”
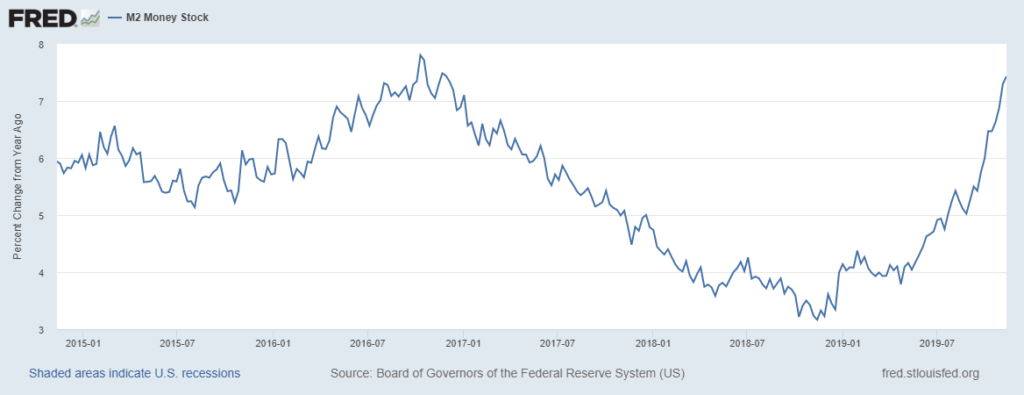
above: M2 % change from year ago over the past five years
There was a time, believe it or not, when the Thursday afternoon release of money supply was a big deal. That was in the late 1980’s and early 1990’s. However, in Congressional testimony in 1993, then Chair Greenspan said, “The historical relationships between money and income, and between money and the price level have largely broken down, depriving the aggregates of much of their usefulness as guides to policy. At least for the time being, M2 has been downgraded as a reliable indicator of financial conditions in the economy, and no single variable has yet been identified to take its place.”
Well, break out your Whitney Houston ‘I will always love you’ (which was the top song of 1993). Because M2 is back. Or if you’re feeling a bit disenfranchised, go with Creep (Radiohead) or Loser (Beck), which has this prophetic line, “The forces of evil in a bozo nightmare…” Interpret however you wish.
Is M2 really back? Well, former NY Fed President Bill Dudley doesn’t explicitly say so in his Bloomberg op-ed of November 20, ‘Two risks to stability are building amid short-term calm’, but he does say, “…the low bond term premia are unlikely to persist much longer. The Fed’s actions have reduced the risk of recession and increased the risk of higher inflation. Yet this has barely been priced into bond market valuations.” This is one of the risks that Dudley points out: “Low Treasury bond yields are not sustainable.” Calling a top in bonds hasn’t exactly been a money printer recently… But here’s the other risk: “…the buildup of corporate debt – especially in the BBB rated and high-yield areas.” This topic has been simmering for quite some time. Back in May, Powell referenced it saying, “Among investment-grade bonds, a near-record fraction is at the lowest rating – a phenomenon known as ‘the triple-B cliff’”. So, while it’s been an issue for some time, it now appears to be coming closer to a boil.
But there is another interesting note in Dudley’s piece: “…some of the changes made in the 2017 Tax Cuts and Jobs Act will increase the stress on highly leveraged companies. In particular, the law eliminated companies’ ability to offset losses during an economic downturn with refunds of federal corporate income taxes paid in earlier years. Also the law limits the deductibility of interest relative to Ebitda. As Ebitda falls in recession, those constraints will become more binding, further restricting the cash flow of highly leveraged companies.”
Combine this with the new FASB current expected credit losses methodology (CECL) which goes into effect after Dec 15, 2019. CECL requires expected losses on loans and leases are to be estimated over the remaining life of the loans, as opposed to incurred losses of the current standard. The impact on financial institutions, according to Wikipedia:
- Larger allowances will be required for most products. It is argued that this effect alone can change the structure of the products to scale down the impact.
- As allowances will increase, pricing of the products will change to reflect higher capital cost.
- Losses modeling will change. This will impact both data collection (data need to be more granular) and modeling methodology (backward-looking over a short period of time to forward-looking for the life of the loan).
I’m no accounting and regulation expert, but it sounds to me like these two rule changes could be considered a future headwind and tightening of financial conditions. Perhaps this is why both HYG and JNK, the high-yield etfs, have moved sideways since April, and last week pierced 200 DMAs even as SPX made new highs. (However, both popped back above the 200 DMA on Friday).
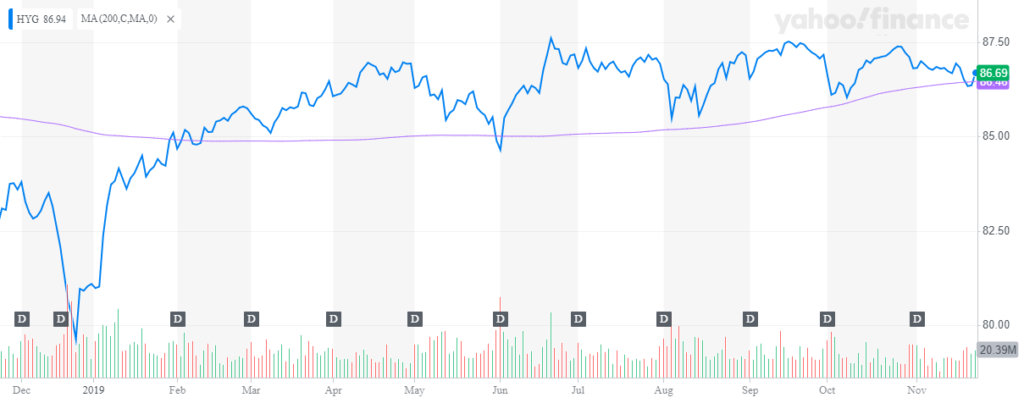
above: HYG with 200 DMA
If we accept Dudley’s thesis that bond yields can go up due to higher growth and inflation sparked by current Fed policy, and then extend that line of thought to postulate that higher rates will set the stage for recession, causing a corporate bond bust, both stocks and bonds could be in for a period of poor returns. On Monday evening, Powell will again address his views of the economy, with a speech titled, Building on the Gains from the Long Expansion.
Happy Thanksgiving.
OTHER MARKET/TRADE THOUGHTS
The curve ended the week on a flatter note, with 2/10 treasury spread ending at just 14.5, down 7.5 on the week as the treasury prepares to auction 2’s, 5’s and 7’s on Monday, Tuesday and Wednesday. Implied vol remains in the doldrums, especially in the front end, as EDH0 9825 straddle settled at just 15.0 bps with three and a half months to go.
One year euro$ calendar spreads weakened. EDH0/EDH1 settled -26.5, down 6 bps on the week. However, current pricing indicates low odds for near-term easing. For example, April ’20 Fed Funds settled at 98.52 or 1.48%, while the expiring November contract is 98.44 or 1.56%. There are FOMC meetings on January 29 and March 13. If it DOES appear as if the economy is in need of further stimulus, the Fed will likely move early in the year as opposed to closer to the election.
Eurodollar option pricing still reflects fear of easing as opposed to tightening. For example, 50 bp risk reversals are as follow with futures just above halfway; EDM20 settle 9839.5, 9800p 1.0 and 9875c 4.75 for RR settle 3.75. EDM22 settle 9851.5, 2EM 9812.5p 6.75 and 9887.5c 9.50 for RR settle 2.75. There has been plenty of put selling up front to finance long call spreads as the market remains convinced that chances of tightening are essentially zero. This is less of an effect in contracts further out the curve, but puts still remain cheap.
EDZ9 ended at the low of the week, settling 9808.25. Since Oct 14, there have been seven daily lows at 9807.5, 10/17, 10/25, 10/28, 10/29, 11/5, 11/12 and 11/13. I have to believe that a break below that level will cause heavy liquidation. EDZ0 9800 puts settled 0.75, but were well offered against a smaller 0.5 bid. Perhaps the odds of cascading sales in the front contract aren’t particularly large, but just remember it’s a holiday week and conditions could be a bit thinner than usual.
| 11/15/2019 | 11/22/2019 | chg | |
| UST 2Y | 161.0 | 162.6 | 1.6 |
| UST 5Y | 164.8 | 162.6 | -2.2 |
| UST 10Y | 183.1 | 177.1 | -6.0 |
| UST 30Y | 230.8 | 222.2 | -8.6 |
| GERM 2Y | -63.3 | -63.6 | -0.3 |
| GERM 10Y | -33.4 | -35.9 | -2.5 |
| JPN 30Y | 44.5 | 42.1 | -2.4 |
| EURO$ Z9/Z0 | -36.0 | -40.3 | -4.3 |
| EURO$ Z0/Z1 | -2.0 | -5.0 | -3.0 |
| EUR | 110.53 | 110.23 | -0.30 |
| CRUDE (1st cont) | 57.83 | 57.77 | -0.06 |
| SPX | 3120.46 | 3110.29 | -10.17 |
| VIX | 12.05 | 12.34 | 0.29 |
https://www.newyorkfed.org/aboutthefed/fedpoint/fed49.html
https://www.federalreserve.gov/newsevents/speech/powell20190520a.htm
In: Eurodollar Options
Done with austerity
Nov 22, 2019
-Reuters reports that President Xi wants to work out a Phase I deal, but isn’t afraid to retaliate if necessary. Right out of the Trump play book. Christine Lagarde gave her first speech as head of the ECB, but avoided monetary policy and said the ECB must generate internal domestic demand through public investment. The age of austerity is over, I guess. Today’s US news includes Markit PMIs, expected 51.0 for Services and 51.4 for Mfg.
–January 2020 FF settled 9845.5, down 1. This is just 1.25 higher than expiring November. While it appears to be a cheap play for a possible ease in December, a client pointedly asked me, “what happens if the turn is 3%.” Because Jan 1 is included in the turn rate, if the Fed effective on Dec 31 were 30 bps above the normal EFFR, it’s worth 1 bp to the FFF0 contract. This makes FFF0 a bit dicier of course, and shifts focus to Jan ED, EDF0, which is well past the turn and settled 9818.5 vs EDZ9 9809.75 and EDH0 9832.0. FFG0 /EDF0 settled 30.0, while FFJ0/EDH0 settled 22.0. I use Feb and Apr FF because both are right after FOMC meetings.–Implied vol continues to languish, especially in longer dated treasuries, as 5/30 spread edged to a slight new recent low of 62 bps.
–EDZ0/EDZ2 settled 3 bps, 98.515 vs 98.485. In euribor ERZ0/Z2 settled 16.5, 100.415 vs 100.250. Lagarde’s public investment message might further widen the spread in europe.
C students
November 21, 2019
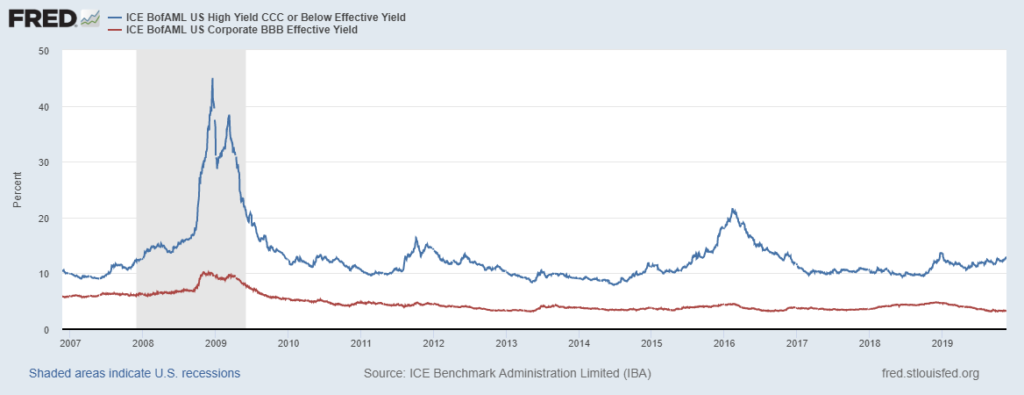
–There’s an interesting video post on twitter with Raoul Pal and Keith McCollough where the latter notes that the spread between BBB and CCC corps keeps moving higher. I created the attached chart from the St Louis Fed website. Indeed. the CCC effective rate is nearing the high seen at the end of 2018 when stocks had cratered into year end. CCC effective now 13.01% vs end of ’18 peak at 13.55%. As a comparison, BBB had peaked then at 4.69% but the yield has been declining since then, now at 3.25%. Dudley (and others) have warned that the next downturn will see an avalanche of BBB downgrades; Gundlach has sounded the same alarm and noted that a lot of BBB paper shouldn’t have investment grade ratings now. My thought is that this impacts the current repo funding debate. No one wants to fund bad collateral, and there’s a chance that there will be a lot more of it. [more on themacrotourist.com https://themacrotourist.com/dudley-does-his-best-icahn/
–Dominant theme for prices continues to be the trade war, with Reuters upending stocks yesterday by saying a Phase I deal might not get done this year. Bonds rallied; tens finished the day down 4.8 bps at 1.736%. This morning the lead China negotiator is saying he’s cautiously optimistic, but stock futures are still slightly lower. FOMC minutes release had little impact: rate path on hold, no standing repo facility, Fed staff saw downside risks.
–New lows in near ED one-year calendars suggest that the market sides with Fed staff. EDZ9/Z0 fell 4.5 to a new recent low of 43.5. EDH0/H1 fell 2 to a new low -26.0. FFF0/FFF1 spread (which is a proxy for easing through 2020) had closed as high as -18.5 in early November, indicating less than ONE 25 bp cut through the year. But in the past seven sessions it has cratered to yesterday’s close of -34.5. In August, the near one-year spread (then being EDU9/U0) had gotten below -75 and the second spread below -60. So current levels are no where near extreme, but the direction indicates increased bias toward ease.
–A few option trades indicate the same: Buyer of 30k EDM0 9850/9875 call spreads vs selling 9837/9825 put spreads covered 9845.5, 33d, 1.0 paid. There was also a sizable 3EZ 9825/9875 risk reversal, paid 1 for the call 35k covered 9850.5 to 51, settled 2.0 call and 1.0 put. Large buyer of 225k FVH 111 put for cab-7. Just a cap on risk.
Testing highs from the last FOMC in front of minutes
November 20, 2019
–In skimming various news items this morning on the US/China trade saga, both the possibility of tariff rollbacks and increases are mentioned. In any case, the path to an easy start with a Phase One deal has hit a snag with the Senate’s passage of a Hong Kong bill of rights which was immediately met with a negative response by China. This morning US stock futures are lower and fixed income higher. Some ED contracts are nearing the highs set the day after the Oct 30 FOMC meeting just as minutes from that meeting are slated to be released this afternoon. For example, EDH21 high on 10/31 was 9863 and prints 9861 this morning, having been as low as 9835 in between. Looking for clues on a December ‘pause’ in today’s minutes.
–VIX ended the past two weeks just above 12 but popped up to 13.4 yesterday, even as Nasdaq closed at another new record high. However, the Dow, while making a new all-time high yesterday, posted an outside day with a lower close as Home Depot (-5.4%) dragged the average lower. Also worth mention was a drop in crude, with CLF0 settling -179 at 55.35. Trump informed Congress he is sending more troops to Saudi Arabia as a deterrent to Iran as the latter faces increasing social unrest. All of which is another challenge to the Aramco IPO. I sometimes wonder, if it was so easy for foreign powers to sway the US election, how hard can it be to use social media to stir up social unrest in the US as that trend rises across the world.
–Dec treasury options expire Friday and TYZ has now eclipsed the 129.75 strike. This is where gamma kicks in; there are 95k open positions in the 130 call (last at 129-26). In eurodollars, there has been a spate of renewed call buying. For example, EDF0 9862c 1 paid for about 30k, and EDZ0 100 calls bought for 0.5 in 15k, pushing open interest in that strike to 283k. Near ED puts are offered quite cheaply as they’ve been used to finance call buys. For example, EDF 9825p settled 1.75 ref EDH0 9833.
–One last note, Dec’19/Dec’20 euribor spread settled at a new high of -2 bps (100.40 and 100.42). Somewhat interesting that this calendar is moving toward a positive value in front of Lagarde’s speech on Friday.
Come see me at the White House…
November 19, 2019
–Yields once again eased lower with tens down 2.6 bps to 1.805%. Another snag in US/China talks yesterday morning sparked a rally in fixed income, and reports of an unscheduled meeting between Trump and Powell underscored the administration’s pressure for easier money and a weaker dollar. While the Fed’s subsequent statement stayed tightly within the bounds of the mandate as required by law, Trump said negative rates were discussed and the meeting was cordial. Summary: If the China negotiations go south, can the administration depend on the Fed to mitigate any fallout?
–The message the markets seem to be taking is that liquidity, if not near term rate cuts, will be amply supplied. Year-end concerns are also fading. FFF0/EDZ9 spread closed at a new recent low of 34.5 with Z9 +1.5 and FFF0 unch’d. EDZ9 9812.5 straddle settled down 1 at 6.5. Stocks remain buoyant and futures are at new highs this morning.
–Red/gold euro$ pack spread (2nd to 5th year) edged to a slight new recent high at 20.625 bps, up half a bp. The demand for near term liquidity should perhaps translate into risk for the back end of curve, but it’s certainly not reflected in bonds or bond vol. With USH0 at 157-31, I marked the Jan 158^ at 3’08 or 7.6 vol, a new recent low. For context, one point in USH is worth just over 5 bps, so that straddle is roughly 16 bps with 39 days to go. By contrast, green Dec 9850 straddle is 17.5 bps with 25 dte. Of course, the belly of the curve is more volatile, but the comparison is interesting.
–Buyer yesterday of 37k EDG0/EDH0 9837/9825/9812 put fly strip for 9.5 to 10.0. This is new (adding). Feb settled 5.0 and March 4.75. Max value of a fly is of course, at middle strike at expiry, in this case max value 12.5 at exactly 9825 or 1.75%. Current 3-m libor has been hugging 1.90%, the Fed effective is 1.55% and SOFR has been 1.57 to 1.59%. (Libor setting will decline after the turn). FFJ0 to EDH0 spread is 22 bps. So if nothing happens in terms of the Fed cutting again, EDH0 should gravitate to the 9825 strike… 1.55% EFF plus 20-23 bp spread.

