
Oct 16. Front end weakness
Self Reinforcing Tighter Conditions
Starting with a couple of charts.
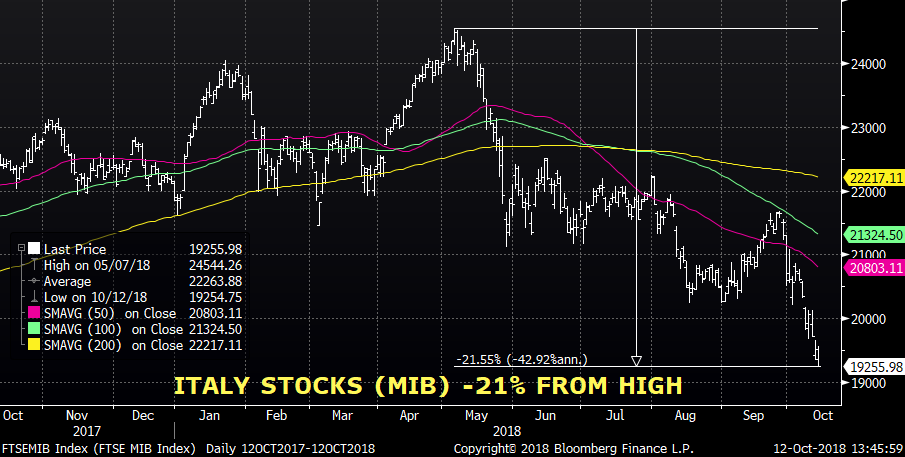
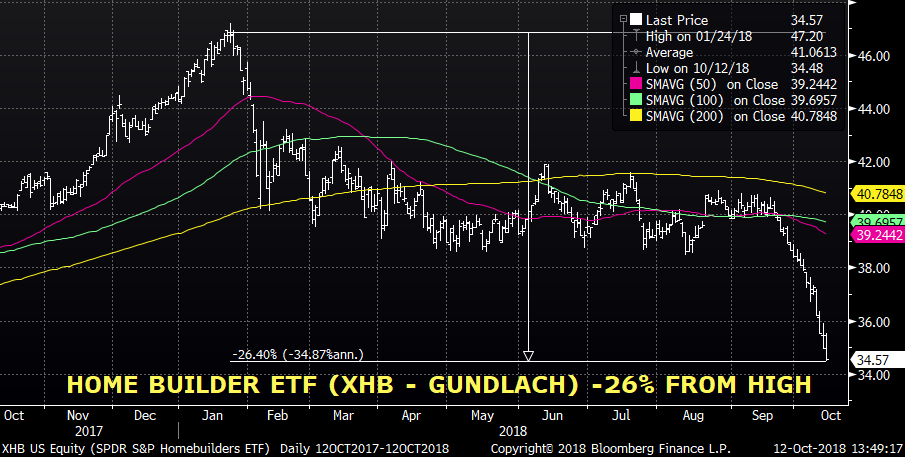
What do these two have to do with each other? Well, it’s pretty obvious, Italians are not buying new homes. (I’ll be here all week).
Besides that, both charts, in a way, are real time reflections of financial conditions. I cite Gundlach in the XHB chart because he menitoned carnage in homebuilders as a worry. Actually, there are a lot of charts in both the US and across the world that show comparable stresses and percentage declines for a variety of similar and dissimilar reasons. For example, this weekend Draghi told the Italian gov’t to “calm down” and stop questioning the euro. However, the official stuff in the US isn’t registering concern. For example, I looked at several Federal Reserve data series which purport to measure financial conditions. Chart below shows St Louis Fed’s Financial Stress Index (blue) and Chicago’s National Financial Conditions (Red). Both are below zero and trending down. No problems, right?
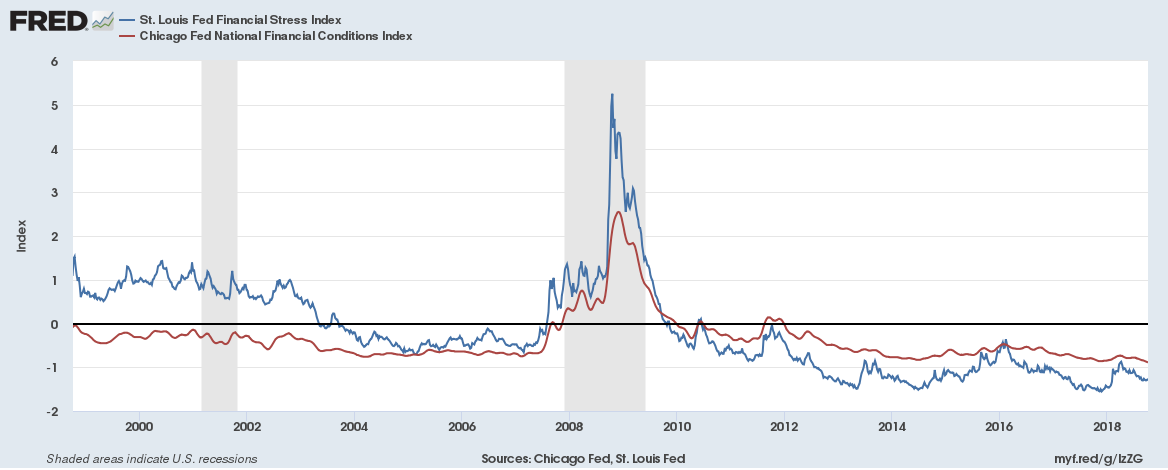
Former NY Fed President Dudley outlined several variables related to financial conditions: Short and long term rates, the value of the dollar, the level of equities, and corporate spreads. These are circular and dynamic indicators. Movements in some of them eventually affect the others which have the potential to culminate in a 2008/09 self-reinforcing spike. So when the Fed says they don’t want to rely exclusively on models, I suppose that the chart above – which contains model inputs and indicated little (and lessening) stress going into the financial crisis – is a reasonable argument for human interpretation and intervention regarding policy choices.
There was an informative Bloomberg article over the weekend regarding corporate spreads with excerpts below.
The result has been a surge in debt issuance in the lowest rungs of investment-grade—the biggest share of it driven by corporate acquisitions. There’s now about $2.47 trillion of U.S. corporate debt rated in the BBB tier, more than triple the level at the end of 2008. It now makes up a record 49 percent of the investment-grade bond market and has eclipsed the entire U.S. junk bond market, according to Bloomberg Barclays Index data. In 1993, for example, just 27 percent of blue-chip corporate bonds were rated at the BBB tier.
The worry now is that, with so many of those BBB ratings dependent on the ability of companies to deliver on their debt-cutting promises, any hiccup in the economy or exodus of investor cash will lead to a surge of downgrades to junk. That could lift companies’ borrowing costs substantially, adding new strains to those companies. And if it were to happen en masse, it could overwhelm the $1.3 trillion U.S. speculative-grade debt market and potentially cause the weakest borrowers to lose access to capital.
https://www.bloomberg.com/graphics/2018-almost-junk-credit-ratings/?srnd=premium
In 2007 it was adjustable rate and subprime mortgages which sparked the crisis. In considering the path forward, the factors we have to be concerned with are inflation and rates. I have used this quote from Albert Edwards of Soc Gen before, but I think it captures the big picture: “As the bond rout continues, the biggest call investors have to make is whether the break of the multi-decade downtrend marks the end of the secular bull market. This is the big one. Get on the wrong side of a new multi-year bear market in gov’t bonds and all investment portfolios will be shredded to ribbons, as bonds are the cornerstone of most equity valuation models.”
But it’s not just the price of capital, it’s availability and access.
A quick comment on inflation: Ben Hunt of Epsilon Theory, wrote an article where he argues that the inflation narrative is strongly taking hold. His methodology relies on AI which scans Bloomberg articles for comments on inflation, and relates those comments back to the main theme of the stories. The results are graphed, and my personal analogy is that these disparate comments are being gravitationally drawn together over time into the mass of a celestial black hole; the story itself BECOMES inflation. [Yes, I’ve overstated conclusion, but it’s a good read, below]
Back to rates and availability. The junk bond flare-up in late 2015/early 2016 was related to collapsing energy prices and emerging markets. It was, and remained, fairly specific. If there were to be another big crisis, it’s not going to be related to mortgages. By 2004-2006 the share of total subprime mortgages had doubled from the years previous to around 20% or $1.3T, but subprime ARMS were only 6.8% of all mortgages outstanding. Comparing these percentages to those in the Bloomberg BBB article, it seems as if the lower credit quality of the corporate market has the potential be much broader in scope and more pernicious in effect than 2015. Could it rival 2008/09 if ratings agencies start a series of downgrades? Both the level of rates and the level of spreads are critical in terms of companies’ servicing obligations. Rates, have of course, increased, with three hikes since the start of the year. The spread (chart below) took a jump in the early part of 2018, perhaps connected to the Feb VIX spike. While the spread is off the high of summer, actual debt servicing costs have increased. Note that many asset managers can’t hold junk. There are parallels to the GFC, but if problems DO develop, the main players won’t be gullible overleveraged households losing homes due to evil banks, it will be corporate entities that willingly engaged in a financial engineering minuet with bankers. The Trump administration is familiar with bankruptcy. The government will be much less inclined to provide assistance.
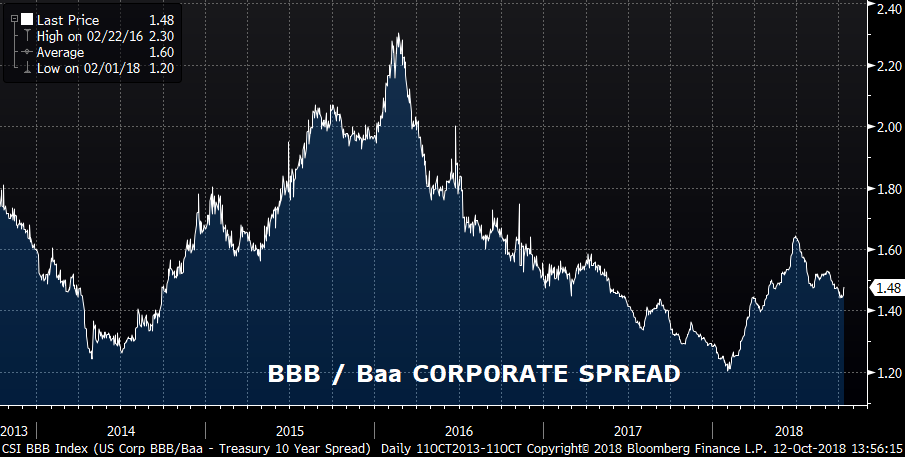
The broad points are that inflation is taking hold even if growth decelerates. If the Trump administration moves towards even more stimulus, the market may become less welcoming in absorbing supply, and the Fed has demonstrated a willingness to lean against fiscal profligacy. Financial conditions can easily tighten, rapidly, just through market action and demand for more compensation for funding in the face of an increase in perceived risk.
******************
Earnings season is kicking off. US news includes Retail Sales on Monday. Industrial Production and JOLTS on Tuesday, Housing Starts and FOMC MINUTES on Wednesday. Philly Fed Thursday and Existing Homes Friday.
Reports circulated late last week that Treasury staff had advised Mnuchin that China is not manipulating the yuan. The official report from the Trump administration comes out Monday. Yuan was 6.9222 Friday.
*****************************
| 10/5/2018 | 10/12/2018 | chg | |
| UST 2Y | 288.5 | 283.6 | -4.9 |
| UST 5Y | 307.1 | 299.3 | -7.8 |
| UST 10Y | 322.7 | 313.9 | -8.8 |
| UST 30Y | 339.7 | 331.6 | -8.1 |
| GERM 2Y | -51.4 | -56.0 | -4.6 |
| GERM 10Y | 57.3 | 49.8 | -7.5 |
| JPN 30Y | 94.1 | 90.6 | -3.5 |
| EURO$ Z8/Z9 | 59.5 | 51.5 | -8.0 |
| EURO$ Z9/Z0 | 5.0 | 3.0 | -2.0 |
| EUR | 115.23 | 115.60 | 0.37 |
| CRUDE (1st cont) | 74.34 | 71.34 | -3.00 |
| SPX | 2885.57 | 2767.13 | -118.44 |
| VIX | 14.82 | 21.31 | 6.49 |
https://en.wikipedia.org/wiki/Subprime_crisis_background_information
Oct 12. Pinning hopes on China?
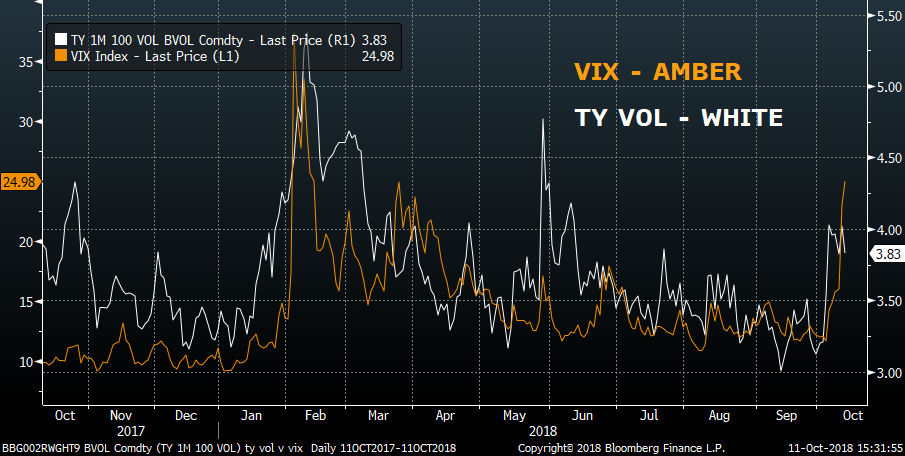
Oct 11, 2018. Going Loco
1010. Gold priced in yuan
Gold priced in yuan. Fairly stable, but the downside bias makes it look as if China would be justified in letting CNY go through 7….
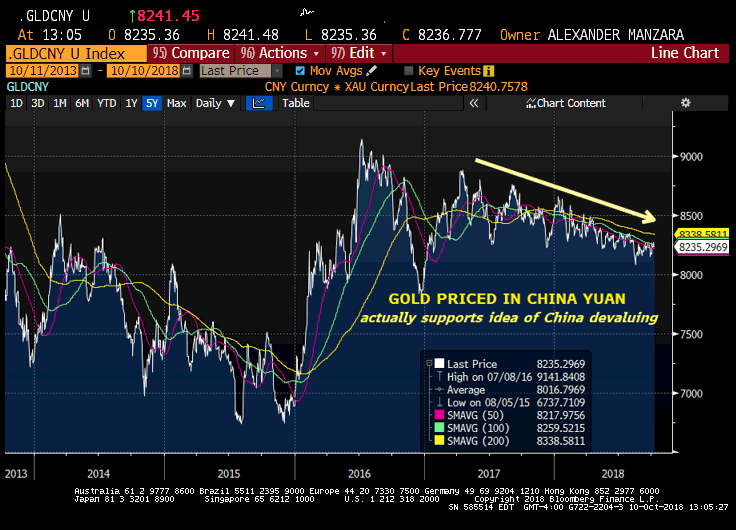
Oct 10. China’s not the only one depreciating
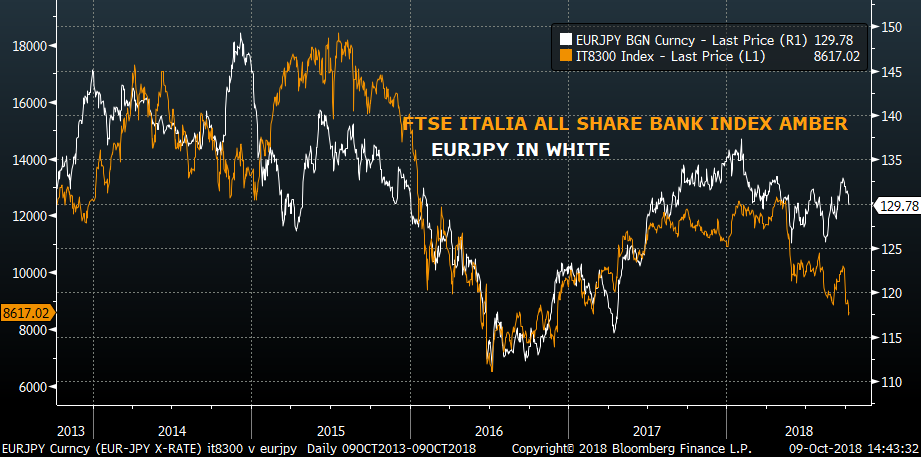
Oct 9. Rotation? Or just a spiral down?
Oct 8. Columbus Day
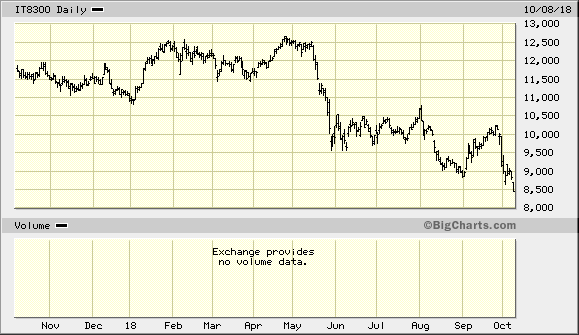
–Despite a cut in reserve requirements over the weekend by the PBOC, Shanghai Comp is down 3.7%. Concerns about Italy have taken the Italy Bank index down over 4% this morning. Salvini helpfully called Juncker and Moscovi enemies of europe, sending the btp/bund spread to a new high of nearly 310 bps. US stock futures are also lower this morning, but not through the lows set on Friday.
–The curve steepened on Friday’s sell-off, with both 2/10 and 5/30 up 2 bps to recent highs of 34.0 and 32.5. Near eurodollar calendar spreads also made new highs, with EDZ8/EDZ9 up 3 bps to 59.5, and EDH9/EDH0 up 3.5 to 43. While there was some profit taking on long US puts (USX 138/137ps sold at 27, 6k), there continues to be interest in buying long dated ED puts. For example, EDZ0 9550p 4.0 paid for 20k.
–More deferred ED calendars closed near the highs of recent ranges, but reds/greens and reds/blues are still negative. If things really go pear-shaped in US equities, then reds will probably lead on a rally. If inflation data picks up (PPI and CPI out Wednesday and Thursday), then the curve will likely steepen further, which should also push reds/blues into positive territory.
–An uneasy risk-off sentiment is building which may lead to demand for US treasuries, but it’s far from clear that yields will drop, as Uncle Sam has new supply to move off the lot. Treasury auctions of 3’s, 10’s and 30’s beginning Wednesday will raise $45 billion in new cash. Expect thin conditions today given the US holiday.
IT8300 FTSE All-Share Italia Bank Index (www.bigcharts.com)
Oct 7. Creative Destruction
“The urge to destroy is also a creative urge” – Picasso (as tweeted by banksy)
“We are prepared to destroy that which we have created because we believe more than any of them in the power of the picture, the poem, the prayer, or the person.” – Mishka Fyodorovich, in the novel A Gentleman in Moscow, describing the Russian psyche as compared to the Europeans’
 Banksy’s Rage Flower Thrower
As everyone knows by now, the underground street artist known as banksy apparently installed a shredder into the frame of one of his paintings, Girl with Red Balloon, so that if it were ever to come to auction, it could be destroyed. On Friday, Sotheby’s auctioned the painting for more than £1m. The frame began to shake; the shredder was deployed. (And now the painting might even be worth MORE!)
In the markets on Friday, the US employment report was released. It showed lower payrolls than expected at 134k, but the previous month had a robust revision higher, and the rate, at 3.7%, was the lowest since 1969. Yoy wages were +2.8% as expected. However, after a brief headline rally, treasuries were shredded and closed at new lows, with the ten year note ending at 3.22%, up 3 bps on the day and 17.5 on the week, while the 30-yr bond closed 3.396%, up 4.2 on the day and 20.2 on the week! Highest ten year yield since 2011, and the highest 30-yr since 2014. The end of the day was fairly quiet, with our office, like many throughout the city, riveted to the televised verdict of the Chicago policeman accused of murdering Laquan McDonald. I recall the old chairman of the CME, Jack Sandner, once giving a speech where he shouted, “the business of the CME is NOT trading futures, it’s RISK MANAGEMENT”. The City of Chicago, County of Cook, has taken that lesson to heart for disruptive protests (not so much for its own financial affairs). Chicago police and fire personnel were on extended shifts and high alert to control risks in case the verdict resulted in a destructive cauldren of rioting. As Mayor Richard Daley said in a famous malapropism in a 1968 press conference (linked below), “Gentlemen get the thing straight, once and for all. The policeman isn’t there to create disorder, the policeman is there to preserve disorder.” In this case, the verdict was guilty of second-degree manslaughter. The city remained calm.
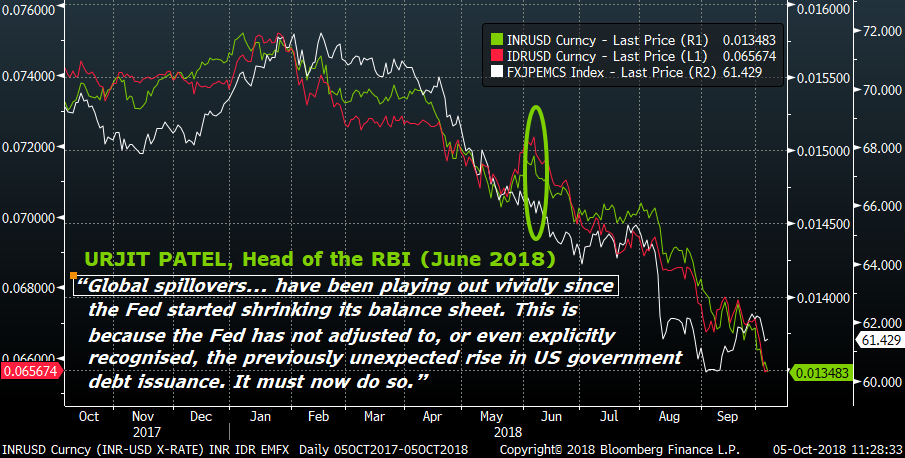
As mentioned in my note on Friday, during the summer, Urjit Patel, head of India’s central bank, complained that the Fed’s balance sheet normalization was adding undue pressure on EM economies as liquidity was drained at the same time that increased US debt issuance was crowding out other borrowers. The chart below shows the rupee in green along with the rupiah in red and the JPM EMFX index in white. Conditions persist. From BBG: “The US budget deficit expanded to an estimated $782b in Donald Trump’s first fiscal year as president, which would be the widest fiscal gap since 2012 when the country was still emerging from the Great Recession.” …The deficit was equal to an estimated 3.9% of GDP, up from 3.5% in the prior year.” Interest expense in fiscal ’18 was a record $523 billion.
With risk-free rates going up on treasuries, competition increases for flows of funds that previously funneled into US equity markets. Additionally, with the somewhat uncreative destruction of global supply chains due to trade policy, input costs and inflation in general are increasing. WTI Crude hit a new high for the year last week, and although it pared back gains into Friday, it still ended up over $1/bbl at $74.34. While the NYFANG index is off nearly 13% from the high posted at the start of summer, US equities are still well higher than the start of the year. Not so with China. Shanghai Comp, Hang Seng and S Korea’s Kospi are all lower. While the US Fed signals continued hikes, the PBOC cut reserve requirements. Sell US and buy China? The time might be getting close.
The sea change has been bear steepening of the curve. The five-year yield was up only 12.8 bps while the thirty-year surged over 20. Uncertainties about term premia and the neutral rate have increased as various Fed officials have discussed the topics. A few weeks ago ten year treasury vol was at historic lows. This week implied vol necessarily firmed. Risk is perhaps once again about to be priced into ‘risky assets’ without the Fed’s backstop. Oh, and perhaps it’s worth inserting a reminder here that the King of Debt suggested as recently as May of 2016 that if the US got into trouble as a result of borrowing, he could negotiate a haircut. Candidate Trump “…told the cable network CNBC, ‘I would borrow, knowing that if the economy crashed, you could make a deal.’”
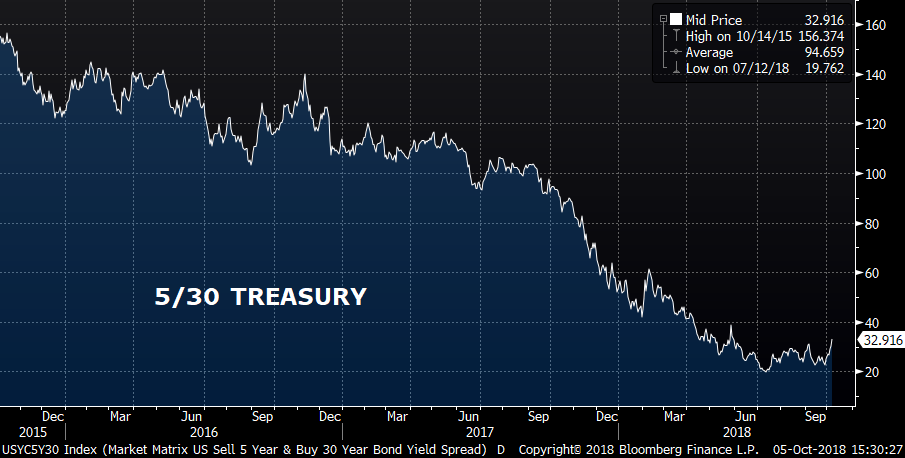
Below is a chart of 5/30 treasury spread which begins in late 2015, when the Fed began to hike. There have been a few false bottoms in the curve over this period (yes, I’m guilty), and a true change in trend typically doesn’t occur until the market perceives the Fed being close to the end of the hiking cycle. However, this chart certainly appears to indicate a bottoming process.
An interesting piece on WolfStreet.com this week (link at bottom) notes that since the Fed began its balance sheet unwind, holdings of MBS have declined by $89 billion to $1.682T. The high late last year was $1.780T. The Fed doesn’t hedge MBS risk. Private holders do, which can also lead to risk-management demand for options.
In short, the Fed is slowly dismantling the architecture put in place after the crisis, and allowing the market to create new risk parameters. In the long run, it’s a healthy process. At the same time, the administration has injected fiscal stimulus. Both of these policies operate with variable lags. Increased inflation expectations are beginning to take hold.
This week the treasury auctions 3’s, 10’s and 30’s (re-open of 10’s and 30’s) in size of $36, $23 and $15 billion respectively, raising $45 billion in new cash. Threes and tens on Wednesday; PPI is also released on Wednesday. 30-yr bonds on Thursday, after CPI is released. Although fixed income markets have already encountered selling pressure, these auctions might cause a bit of indigestion.
******************
Now I just want to sketch out a few thoughts about the supposed large spec short in the ten year futures that various commentators think (thought?) would have an influence on the market. First, hat tip to the shorts. You’ve been right. Second, I’ve done a few barroom napkin calculations for this next bit; if anyone is really interested I may dig deeper. I looked at three years, 2007, just prior to the GFC, 2012 and 2017. The Federal debt outstanding in 2007 was $6.074T. Five years later it was $12.848T and in 2017, $16.455 with our fearless administration set to blow it up further. The duration of the debt was around 55 months in 2007, 64 months in 2012 and 71 months in 2017 according to BBG. So in ten years, the amount of debt grew 2.7x and was extended by over one year. So now let’s look at the amount of open interest on treasury futures. In 2007 it was about 7.586 million contracts (I doubled the 2 year amounts since they are $200k notional compared to $100k for other contracts). In 2017 it was 14.45 million. Call it 2x. The point is, that even with the introduction of the Ultra ten year note and the Ultra bond contract in the last ten years, the open interest on the exchange hasn’t kept pace with the explosion in government debt. Yeah, I know that there are a million reasons for this, including the Fed siphoning off treasuries and MBS for its balance sheet. There have also been other competing etf products introduced. My point is this: if you use the Commitment of Traders reports as the cornerstone of your analysis, I don’t think it’s anywhere near as valuable as it once was. One other interesting side note: Even though ultra bond options never trade, there is more open interest in the ultra bond (WNZ8) than in the classic 30-year bond (USZ8) with 1.057m in the former and .935m in the latter. It’s been that way for a while, but increased interest in longer dated assets will likely grow. (I still don’t know why Mnuchin squashed the idea of 100 year bonds when he had the chance at lower rates).
| 9/28/2018 | 10/5/2018 | chg | |
| UST 2Y | 281.3 | 288.5 | 7.2 |
| UST 5Y | 294.3 | 307.1 | 12.8 |
| UST 10Y | 305.0 | 322.5 | 17.5 |
| UST 30Y | 319.4 | 339.6 | 20.2 |
| GERM 2Y | -52.4 | -51.4 | 1.0 |
| GERM 10Y | 47.0 | 57.3 | 10.3 |
| JPN 30Y | 90.3 | 94.1 | 3.8 |
| EURO$ Z8/Z9 | 48.0 | 59.5 | 11.5 |
| EURO$ Z9/Z0 | 2.5 | 5.0 | 2.5 |
| EUR | 116.05 | 115.23 | -0.82 |
| CRUDE (1st cont) | 73.25 | 74.34 | 1.09 |
| SPX | 2913.98 | 2885.57 | -28.41 |
| VIX | 12.12 | 14.82 | 2.70 |
https://wolfstreet.com/2018/10/04/feds-balance-sheet-normalization-reaches-285-billion/
Oct 5. Patel had the (Fed’s) number early
–Both the Indian rupee and the Indonesian rupiah are making new lows vs the USD for the move today. In the US, it’s Unemployment day. Is there any connection?
–The jobs data are expected to show NFP of 185k and yoy Average Hourly Earnings of 2.8%. It’s possible that results will be skewed by Hurricane Florence. So, if the market chooses to do so, it can explain away a miss in either direction, and fall back on the larger issue.
–Who were the first two central banks to openly complain (in op-ed pieces), that the Fed was removing global liquidity, thus hurting their economies? It was India, followed by Indonesia. In early June India’s Urjit Patel wrote in the FT “Global spillovers… have been playing out vividly since the Fed started shrinking its balance sheet. This is because the Fed has not adjusted to, or even explicitly recognised, the previously unexpected rise in US government debt issuance. It must now do so.” In June the rupee was 68 to the USD, it’s now 74. Shortly thereafter the same sentiments were echoed by Bank Indonesia’s Warjiyo. The withdrawal of liquidity hits the periphery first. Currently the US is seeing both stocks and bonds depreciate simultaneously. If the BIG issue is liquidity, then the employment number isn’t all that important, except that a strong wage number will give the Fed a green light to continue to tighten. Today it’s not the news, it’s how the market reacts. If the overarching issue is liquidity, and I of course, think it is, it’s bearish for everything.
–Along the same lines, Draghi met with Italy’s president Mattarella on Monday to discuss the budget (Rtrs). I saw a paper from Cumberland Advisors that says Italy has the third largest sovereign bond market in the world. Could that be possible? I don’t think so, but it’s still important, and can still impact funding issues. Finally, the China chip story (China infiltrated US systems with tiny computer chips) adds another layer of complexity to the trade issue, pushing resolution further away.
–Once again new highs were posted in near ED calendar spreads, with EDZ8/EDZ9 up another 3.5 bps to 56.5. EDZ9/EDZ0 is not quite at a new high, but gained 0.5 to close at 5.0. That’s quite a difference from the euribor curve, where ERZ9/EDZ0 is the peak, and notched a new recent high at 42 bps. In what was earlier this year called global synchronised growth, central bank expectations are anything but. I’ve heard a couple of comments about the market gunning for the big open short positions in long dated euro$ puts. If so, it’s only because underlying conditions allow the press. After a modest nudge higher in implied vol on Wednesday’s action, yesterday saw a surge to new recent highs, though premium is still low given the environment.

