
Jan 13. Treasury vol crushed Friday as yield levels retreat due to weak employment report
–NFP of only 74k caused a short covering rally in interest rate futures. New recent lows set in 2/10 treasury spread at 249 (it ended the year at 262) and in red/gold eurodollar pack spread at 284.5 (ended the year at 306). Ten year yield fell over 9 bps to 286, and blue eurodollar pack (strongest) gained 17. Red/green pack spread fell over 6 bps to 102; given that the market has targeted this time period for the onset of Fed tightening, it seems low.
–Implied vol in treasuries was crushed, with tens and bonds closing at levels not seen since last May when the market was just beginning to awaken to the idea of tightening/tapering. More on that below.
–In eurodollars there was selling of green and red midcurve puts vs blues as positions were exited, but open interest changes weren’t overly large. While I’ve noted the compression between green and blue midcurve straddles, it’s worth noting that Five year vol has also declined significantly relative to green midcurves.
–Not much news today. Retail Sales on Tuesday expected 0.0, +0.4 les autos.
Jan 9. Green euro$’s crushed
–Big day in the front end of the US rate curve. Green pack was the weakest, settling -14.5 bps. Red/Gold pack spd nearly unchanged at 293 (-8 and -8.5). Ten year yield rose 6 bps to 3% while 30 yr bond yield was up just 2 bps to 390.5. There were some big volume trades, for example EDZ4/EDM5 bought about 125k on the day from 27.5 to 30, though open int up only 28k and 19k. Heavy outright selling in EDZ5 (OI up 27k). Late in the day Green Feb 9825/9812ps 2.5 paid for 75k. (This appears to be exit of the short put spread associated with 9850/9837/9825/9812p condors). 0EZ 9862p cover 9879 ppr paid 28 for 15k (new).
–5/30 treasury spread plunged 6 bps to 214.5 and was a couple of bps lower after pit close, new recent lows. In 2013 the low in 5/30 was 203 at the September Employment report when tens first flirted with 3%.
–If one just looked at long end vol, one would think it was a pretty quiet session. USH 129 straddle bled a few ticks to close 2’50 at 7.8 (new recent low). Ten year vol hanging around 5% as yesterday’s auction sailed through and the employment report looms. 30-yr bond auction today.
–Green/blue straddle spreads further compressed with 125 bp strike difference straddles only 4-4.5 bps wide. Example 2EH 9850^ 34.0 and 3EH 9737^ 38.5. Red/green/blue pack butterfly jumped 8 bps to close +2.25 bps. In other words, red/green pack spread +6.5 to 108.5 as greens were crushed, while green/blue pack spread fell 1.5 to 106.25.
–Probably worth taking a shot a buying bond vol here.
Jan 7, 2014. Everything’s cool in this market…
–Monday featured a flattening curve with red/gold pack spread down 4.25 to 296. Ten year yield fell about 4 bps to 296. Overall trade was quiet, though there were a few large option packages.
–With both tens and red/gold pack spread hovering around 300 bps, it seems to me that the market has settled into a complacent state. Almost as if it’s in a deep freeze. (See? That’s a joke). The general feeling seems to be that tens can’t really sustain higher yields, and that forward rates are simply too steep. I’ve been in that mindset before: “Really, how much higher can this thing go?” It doesn’t matter what the market is, the answer that I’ve personally learned is: “Enough so that it will rip your f**king liver out and drain your account.” Maybe it’s just me…
–The tendency is for green and blue straddles to grind lower. I’ll continue to focus on green/blue June straddle spread (82^ vs 71^) that settled just 6.5 bps (54.5 and 61). Total straddle premium of blue is just 12% higher than the green, even though the blue yield level is 60% higher. Not really the way to measure it, but somewhat fits with the market’s misguided theory that nothing can happen at the long end. In fact, someone mentioned research to me from David Zervos of Jeffries regarding a strategy (spoos+ blues) of buying SPX and Blue eurodollar packs, the thought being that if something bad happens in stocks then the large yield cushion provided by the blues will offset whatever minor bumps stocks encounter. Who am I to argue? It’s worked the past few years. I will only say that I can easily envision a scenario THIS YEAR, where that trade stings on both sides. It’s not that I’m sure that long end yields are going to instantaneously leap to victory, say around 3.4%. It’s that the market isn’t keen on pricing that possibility.
–And if I were to argue, it would be along these lines. “Dude, the whole premise of your trade is unlimited QE. They are beginning to taper. There are concerns growing like green shoots globally that QE has risks. Even Japanese stocks are a bit more tentative and JGB’s appear to want to probe higher yields.” Well, that’s how I would start anyway…
Jan 5, 2014. Interest rate option comment
US interest rate options ended the week reflecting a market bias of moving Fed action to a somewhat more forward time frame. This is apparent in, 1) tame vol levels at the longer end, 2) interest in buying puts moving forward on the curve, and 3) deferred midcurve straddle calendars narrowing.
In a longer time frame view, TY at-the-money implied vol is rather subdued, running around 5.1 to 5.2% with the ten year yield hovering around 3% and supply coming next week in tens and thirty year bonds. Last year when yields jumped as the market became concerned about tapering and the possibility of Fed tightening, vol was much higher. In early July, TY implied hit nearly 8%, and in early September when the ten year yield reached 3%, TY vol was around 7.7. On Friday, TYH 123 straddle settled 1’53 at 5.2. If implied volatility was at the same level as the last time we were at 3%, the straddle would be a point higher (8% would give a straddle price of 2’53). In the event, the market has adjusted to tapering at the long end. There is clearly an absence of panic for a surge to higher yields this time around, as reflected by relative lack of put skew. However, there are some fissures evident in the calm facade. More on that below…
In terms of treasury open interest, the largest strike is TYG 121.5 put, with 121k open (12 delta). The next highest is TYG 123.5 put with 104k open (59 delta). Large buyer last week of 122.5/121.5 put spreads; the 122.5 strike is about 8.5 bps away. February treasury options expire 24-Jan, the week prior to the FOMC. While there has been some rolling of positions into March, we would expect the pace to pick up appreciably this week. The biggest open interest strike in March is the 123 put (corresponding to 3% yield) which has 53k open. TY futures have 2.217 million open interest.
In eurodollars, the picture is a bit clearer with respect to the MARKET giving the FED forward guidance on tightening. There are several midcurve put strikes with open interest near or above 200k. For example, Blue March 9700 puts have 193k open. That’s due to large positions having been taken several weeks ago in Blue March 9750/9725/9700 put butterflies and 9750/9700/9650 put flies. But on Friday, we saw a seller of 25k of the 9750/9725 put spread, (an exit of the upper put spread on the fly) and a buyer of 25k Green Feb 9837 puts. May not have been the same player, but the bearish net adjustment forward on the curve was also reflected by weakness in red and green futures after Bernanke spoke on Friday. (Red pack closed -3.375 and Green pack -2.25). The largest open interest options are Green Feb 9837 puts as noted above (216k open), and the Green March 9850 puts with 232k open. Both of these are related to large put condor purchases a few weeks ago. It’s worth mentioning that most large bearish positions taken recently are capped, that is, put flies and condors. There is little expectation (or protection) for a violent sell off.
One last note concerns straddle spread levels between green and blue midcurves. On the futures curve, the widest pack spread is still greens/blues around 111 bps. However, reds/greens have been widening relative to green/blue and that’s also clear in straddle spreads. For example, on Friday Green June 9825^ settled 55.0 and Blue June 9712^ settled 62.0, a difference of 7 bps. But on 12-December, Green June 9850^ was 56.0 while the Blue June 9737^ 70.0, a difference of 14 bps. A fairly significant compression in the space of a few weeks, (in ALL green to blue straddle spreads), which portends a forward shift of volatility.
Jan 2, 2014. Ten year yields poised to test higher levels
Jan 2, 2014. The new year begins with 3% ten year note yield and stocks continuing to power higher. New high settle just below 306 in red/gold pack spread. While there has been relentless buying of green midcurve puts, weakness in the curve seems to be edging out a bit further.
–Today’s economic news includes Jobless Claims 338k. PMI expected 54.5 and ISM 57.0. Several Fed speakers tomorrow including Bernanke in the afternoon.
–I read recently that at its core, the Japanese problem is one of demographics. The population has been in continual decline since 2007, and last year the plunge hit a new low with a decline of 244k, surpassing 2012’s fall. At the same time, tensions with China are constantly edging higher.
–Emerging markets still reeling from political crises, with a new low in Thai baht today. Perhaps regional uncertainties are creating a foundation for gold prices, which featured a rapid rebound from a new low of 1180 to close above 1200, and up another 20 this morning.
Dec 31, 2013. Happy New Year!
–In spite of the holiday period, there have still been some large trades going through euro$ and treasury options, all leaning bearishly. For example, 0EM (red midcurve june) 9937/9925/9912/9900p condor was bought, bringing the position to over 100k (settled 2.5 ref 9934.0). There was also a buyer of 2EG (green feb) 9862/9837/9812p fly with 9850-9812p condor, at least 25k of each. The put fly settled 5.5 ref 9859. Normal curve roll would render these positions worthless, but robust employment data and the FOMC meeting at the end of January could still move perceptions of Fed tightening forward. Of course, given large outright longs (buyer of 30k EDM15 Friday 9932-32.5), these positions could also represent protection. A three month roll of 15 bps on 30k M’15 futures would net 450k bps, more than covering 300k bps spent on the midcurve June put condor which would still maintain some value three months hence. Simple. Unless the bottom falls out.
–Odds of a huge downside rout aren’t large, but certainly are growing. For example, I watch the ten year note to ten year inflation index note, which I marked yesterday at a new recent high of 225. The high of the year was 260 (April) and it ended last year at 250, so the current reading is still quite tame. On the other hand, the market doesn’t really seem to share the Fed’s concern about deflation, and an uptick in monetary velocity for whatever reason, would be like lighting an inflationary match near the huge pile of parched tinder known as excess reserves.
–News today includes Chicago PMI, expected 61.3 from 63.0, and Consumer Confidence at 76.8.
–Happy New Year
Dec 30, 2013. The start of a new cycle.
–Red eurodollar pack was the strongest part of the curve Friday, closing +3. There was a new buyer of about 25k EDM5 Friday, enough to create an impact in an otherwise quiet market. Ten year yield closed just above 3%, essentially at the high of the year. Many markets and spreads are at extremes for the year. For example, 2/10 treasury spread hit a new high of 261. Red/gold eurodollar pack spread is holding over 300 (closed just under 305). The highest one year eurodollar calendar spread (currently EDZ15/Z16) closed at new high of 124. $/yen is at the high for the year at 105, and gold is closing near the year’s low around $1200. Even the euro hit a new high for the year on Friday as stops were elected in a push toward 139. (Many gappy moves recently…bonds, copper, euro…). Stocks of course, are at new highs.
–Clearly the markets cannot maintain these trends in the face of the completion of the solar polarity flip. Right? Intuitively obvious, especially when considering the enclosed chart of solar cycles (looks like Nasdaq!). http://en.wikipedia.org/wiki/File:Solar_Cycle_Prediction.gif
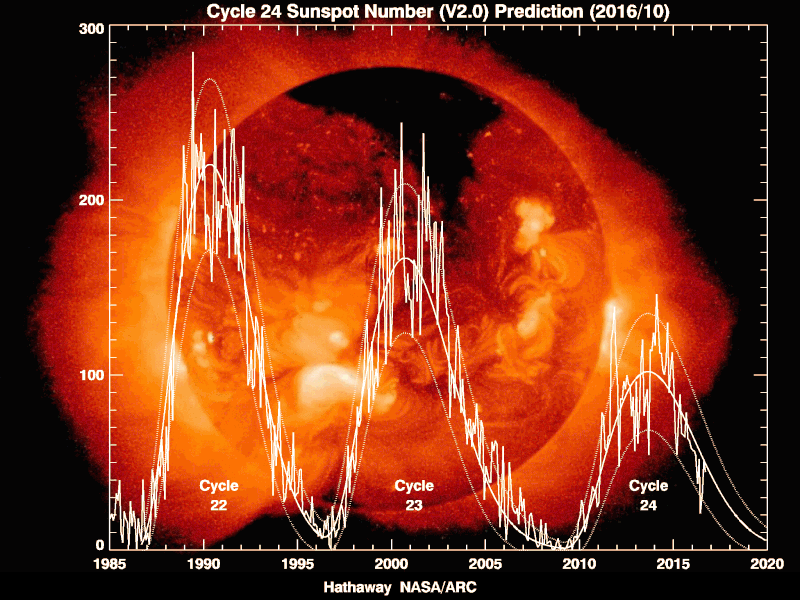
–Any dang fool can see that the model is peaking right about now. However, market reversals may lose some of their relevance if caused by solar flares that knock out the power grids and cause societal chaos. Zap. No more computerized models that trade in milliseconds. Just back to the good old days of trading floors with paper cards and fat pencils (with erasers, another important aspect of the technology in the early days).
http://www.independent.co.uk/news/science/video-sun-has-flipped-upside-down-as-new-magnetic-cycle-begins-9029378.html
–All the best in 2014. -MNZ
Dec 27. Remember the dot.coms?
Dec 27. Not much change in interest rate futures. Volume was light, though there were some large bearish option plays. Ten year yield stopped just shy of 3%, closing at 2.99. While most of the attention in puts has been paid in greens, yesterday the interest was slightly further out the curve. For example, Blue March 9737/9700/9662 p butterfly was bought 20k (paid 9 covered 33). Feb Five Yr 119/118.25/117.5 put fly was bought 15k for 7.5-8.0. FVH 119/117.75 p 1×1.5 bought 10k, 16-16.5. All new positions. And in tens, bought TYH +20k 121/123ps, +20k TYH 125c, -40k TYG 125.5c as a package (31 for 20k, exit of the Feb calls).
–Interesting note on ZeroHedge saying that at $40 billion in market cap, Twitter now is valued at a higher level than 80% of S&P 500 companies. Revenue is just over $1 billion, and I skimmed a few articles that say the company may make $200 million in 2015. As a comparison, if you put $40 billion into the five year note, you would get $700 million in yield each year, starting instantly. And in five years you will still have the $40 billion in principal. So, the Fed is buying the latter in an attempt to push the public into riskier assets like the former, in order to strengthen the foundation of our economy through the “wealth effect.” Happy New Year?
–If you are reading this post on the TJM website, please note that I have changed firms and am at RJ O’Brien. Please contact me directly for interest rate trading ideas. Alex Manzara
Dec 26. Heightened volatility in 2014?
–Green eurodollar pack continued to lead the way lower in interest rate futures Tuesday, closing down over 7 bps (average price 98.06 or just under 2% yield). There continues to be heavy put buying on the EDH16 contract, notably 40k 2EH 9800 puts at a premium of 4.0, new position. Red/green pack spread made a new high for the year, just under 111 bps. In fact, red/green pack spread closed higher than green/blue pack spread for the first time since mid-September as the market pushes the timeframe for a possible Fed tightening forward. (In other words, red/green/blue pack fly has gone positive, to +1, with red/grn 111 and grn/blu 110). It makes sense for the market to focus on the green pack which is two years hence, as a period when low rates come to an end. But nearer spreads are also making new recent highs, for example EDZ14/15 rose 4 bps to 72. The market has a way of testing the resolve of new Fed chiefs, and a dollop of increased uncertainty appears to be drawing nearer.
–Ten year yield rose over 5 bps but still remains below 3% at 2.98.
–Another topic which bears mention is a couple of instances of “fat finger” problems encountered in the last couple of days, notably a five point move in the US thirty year bond contracts in the middle of the night, and a jump in copper futures on Tuesday. Both contract highs were adjusted lower. The exchanges and the market in general have been complacent with heavy volume, and algos “keeping things in line”. Certainly part of it could be due to thin holiday markets. But it also might be a sign of things to come in 2014.
Dec 20. 5/30 Treasury spread tumbles in wake of the Fed taper

–Large 11 bp drop in 5/30 treasury spread (above) to 226 as 5 yr note yield jumped 10 bps to 164. Recall that in the early part of this year 5’s were more like 70 bps; yield has more than doubled. Green euro$ pack weakest on the board, down nearly 14 bps. 30 year bond yield was unchanged. Rather than QE to keep bond yields low, maybe the Fed should just re-instill fears of monetary tightening – long end yields will fall as the curve flattens. And stocks will maintain their bid because long treasury yields don’t provide competition. Voila!
–Of course, this idea comes with its own set of problems including: 1) falling inflation expectations as gold was hammered $40 yesterday, 2) a stronger dollar, 3) renewed capital outflows from emerging markets. As a post on ZH notes, one of the US Treasury’s risks for 2014 is ‘spillover from emerging market weakness’. (Yesterday the rupiah and turkish lira made new lows, and Brazil real weakened). As the US share of global GDP edges lower, US policy is more susceptible to outside forces…
–$/yen at new high around 104.50 as the BoJ pledges to retain easy money, while in China, interbank rates are surging and Shanghai Comp is down around 2%. “The seven-day repurchase rate was up to a six-month high of 7.6% in Shanghai on Friday…”from 7.06% Thursday (BizInsider). Apparently an attempt to quell rampant speculation.
–Heavy buying of Green midcurve puts yesterday, along with aggressive buying of Green and Blue March straddles suggests weakness in the belly may not be over.


