
Euro reacts to elections
June 10, 2024
**************
–EUR was 108.93 (ECM4) on Thursday’s close and has now plunged to 107.55 following weekend elections in Europe. In Germany AfD made a strong showing and in France, Macron is calling for snap elections after his party was trounced, while “Italy’s PM Meloni comes out on top in EU vote, strengthening her hand…and boosting her standing both at home and abroad.” (RTRS). US equities are also under profit-taking pressure as are US treasuries, with downside follow-through in the wake of Friday’s higher than expected 272k NFP. Supply is a concern with 3, 10 and 30 year auctions slated this week (Mon, Tues, Thurs).
–Yesterday, “A Ukrainian military source cited by Sky News confirmed this is’ the first Ukrainian Air Force (UAF) air-delivered munition delivered against a target within Russia’.”
–This week’s news includes CPI and FOMC on Wednesday. FOMC dot-plot will shave at least one ease from the estimate for 2024, as we’re already halfway through the year. As of Friday’s settles in December SOFR contracts, the market is pricing between 1 and 2 eases in 2024 and another 3 cuts in 2025. SFRZ4 settled 9505, or 4.95%. Current EFFR is 5.33, one ease would be 5.08% or 9492 while two cuts would equate to 4,83% or 9517. Of course, SOFR contracts also price odds for FOMC meetings embedded in their terms, but for now we can say the market is priced for 1 to 2 cuts in 2024, and SFRZ5 is 9597.5 or 4.025%. Therefore Z4/Z5 is -79.5. The SOFR curve repriced on Friday from a lean toward 4 cuts in a given year to more like 3-3.5.
–Implied vol was hit in rate futures, though the expiring midcurves aren’t particularly cheap. 0QM4 9550^ settled 18 vs SFRM5 9550.5, 2QM4 9600^ settled 18.0 vs SFRM6 9604.5. VIX ended Friday at 12.22, A WSJ article over the weekend: ‘Beneath the calm market, stocks are going haywire’. Here’s a snippet:
“Under the calm surface, however, there is furious paddling. Only once in the past 25 years have stocks swung about like this while the overall market stayed so placid. Traders in the options markets are betting on its continuing: Prices indicate the biggest swings in stocks for at least 10 years relative to the prevailing calm for the S&P 500.”
–Kevin Muir (MacroTourist) had cited the ‘dispersion trade’ as a possible risk some time ago…
Net Worth looks fine…
June 9, 2024 – Weekly comment
***********************************
The global economic system is debt-based. Below is an image of US Household Net Worth, released by the Fed last week in the Z.1 report, updated through Q1.
Liabilities are barely increasing (red bars), yet assets (equites and residential RE) just keep powering higher. That’s what various officials mean when they say Household balance sheets are in good shape. Of course, that’s in the aggregate. The coveted assets of the lower end of the balance sheet spectrum are torches and pitchforks. I guess this chart would make sense if productivity were on a tear higher, and maybe part of it is the AI craze. The other way it makes sense is if the measuring stick of the US dollar is deteriorating, which of course it has done, in terms of purchasing power.
After the 2007/09 Great Financial Crisis there was a lot of talk about the shifting of liabilities from the private sector to the Gov’t balance sheet. In that context, the above chart makes more sense.
Around 10 years ago, Q4 2014, HH Assets were $101T, Liabilities $14T and NW $87T. In Q1 2024, Assets are $181T, Liabilities $21T and NW (rounded) has nearly doubled to $161. The liability side has really been kept in check, up only 50%. Must be a really frugal and innovative populace. Of course, when one considers that at the end of 2014, Federal Gov’t Debt was $14.4T is 2014 and has now more than doubled to $29.9T (Z.1), it begins to appear as though private debts HAVE shifted to the public balance sheet, boosting equities, but perhaps making the aggregate snapshot look less healthy. FT’s top headline Sunday is ‘IMF warns US on ballooning fiscal debt’.
In the movie Planes Trains and Automobiles, there’s a funny scene where Del Griffith, shower curtain ring salesman (John Candy), and Neal Page, slick advertising exec (Steve Martin) are stranded on the highway, watching the rental car they were just in smolder and burn after a harrowing accident. Neal Page starts to laugh a little and Del Griffith, who caused the accident, is surprised, but he starts to laugh too.
Finally Del says, “What?” And Neal responds, “You finally did it to yourself. Good luck turning the car in!” Now they’re laughing harder and harder and Neal asks, “How could you rent that thing anyway, without a credit card?” Del, “Oh I gave this girl behind the counter a set of shower curtain rings.” Then Neal becomes serious and says, “You can’t rent a car with shower curtain rings Del.” It turns out that Del used Neal’s Diner Club credit card (a relic of the past).
I sort of consider Del Griffith to be the Federal Gov’t and Neal Page the public. I came to that conclusion after Friday’s employment data which sparked a 15 bp jump in the 10y yield to 4.428%. I’m not saying the data was manipulated to appear strong (though there seems to be quite a divergence between the establishment and household surveys). Maybe it’s just that the BLS’s Birth/Death plug factor isn’t quite capturing the latter half. In any case, Fed’l Gov’t efforts to juice economic growth in whatever way possible before the election might come back to scorch the public through higher yields. Maybe it’s going to be hard to pay for things with a charred Diner’s Club card. It’s funny when it just appears that an inept gov’t is buried in debt (You did it to yourself!). It’s not so amusing when the public starts to get the bill, in one way or another.
Auctions of 3 ($58b), 10 ($39b) and 30 ($22b) years are Monday, Tuesday and Thursday, bracketing CPI and the FOMC on Wednesday. The last auction cycle didn’t go that well…everything tailed. With respect to the FOMC, the new 2024 FF dot projections should be interesting. In March, the 2024 estimate was 4.6% or three eases, and the 2025 estimate was 3.9, up from December’s 3.6. The main question is whether the 2024 dot will shift to just one cut or two; my guess is two. So that would take the end-of-2024 FF estimate to 4.9. (SFRZ4 settled Friday at 9505 or 4.95%, essentially pricing 2 cuts). But then can 2025 remain constant at 3.9? That may have to shift up slightly as well, which the market expects. SFRZ5 settled 9584.5 or 4.155%; Z4/Z5 spread at -79.5. Considering the PCE deflator, for end of 2024 the PCE price index was penciled in at 2.4, last reported at 2.7%. Core was estimated 2.6, last at 2.75%. Those will likely remain the same, though the risk is a shift higher. Overall, I would deem the dot-plot risk to be slightly hawkish, which will be countered perhaps, by a more dovish press conference. A counterbalance to the ECB’s ease followed by a hawkish press conference.
FFQ4 settled at 9469 or 5.31%, just 2 lower than the current 5.33% Fed Effective and down 1.5 on the week. Therefore, there is little priced in for a July 31 rate cut. FFF5 settled 9504 or 4.96%, pricing between 1 and 2 cuts by year end.
CPI yoy expected 3.4% from 3.4 last. Ex Food and Energy expected 3.5 from 3.6. On Monday, NFIB Small Business Optimism is expected 89.6 from 89.7 last, still lower than the COVID spike. The divergence between data points like NFIB and Chicago PMI, which both indicate recession, and data like NFP is rarely more stark.
| 5/31/2024 | 6/7/2024 | chg | ||
| UST 2Y | 489.1 | 487.0 | -2.1 | |
| UST 5Y | 452.6 | 445.2 | -7.4 | |
| UST 10Y | 451.2 | 442.8 | -8.4 | wi 442.7 |
| UST 30Y | 465.2 | 454.7 | -10.5 | wi 454.7 |
| GERM 2Y | 309.7 | 308.3 | -1.4 | |
| GERM 10Y | 266.4 | 262.0 | -4.4 | |
| JPN 20Y | 187.2 | 176.5 | -10.7 | |
| CHINA 10Y | 231.9 | 231.0 | -0.9 | |
| SOFR U4/U5 | -81.5 | -88.5 | -7.0 | |
| SOFR U5/U6 | -38.5 | -41.0 | -2.5 | |
| SOFR U6/U7 | -8.5 | -10.0 | -1.5 | |
| EUR | 108.48 | 108.18 | -0.30 | |
| CRUDE (CLQ4) | 76.73 | 75.22 | -1.51 | |
| SPX | 5277.51 | 5346.99 | 69.48 | 1.3% |
| VIX | 12.92 | 12.22 | -0.70 | |
Gearing up for a July FOMC cut
June 7, 2024
**************
–ECB delivered a 25 bp cut, as expected, but Lagarde tried to temper enthusiasm for further easing. EUR ended a bit higher and is unch’d this morning. US yields closed slightly lower with tens down 1 bp at 4.277%; futures are going into today’s employment report at the top end of the range since April. NFP expected 180k from 175k and the rate is expected unchanged at 3.9%. The market appears to perceive risk is weighted to a weak number – heavy buying of week-2 FV calls. FV wk2 107c 19 paid for 30k and 107.25c 14.5 paid for 15k. Settled 21 and 15.5 vs FVU4 106-2575. Open interest in FV week-2 calls alone was +69k. Week-2 options expire 14-June, so next week’s CPI and FOMC are covered. There has already been a significant rally in all rate futures this week, but the fear is that there’s more to come. Ten year yield down nearly one-quarter pct since Friday. Same thing on the SOFR strip: SFRM5 +24.5 to 9569.5, SFRM6 +25 to 9622 and SFRM6 +26 to 9635.5 just since Friday, 31-May.
–Also out today is lagging data…Q1 Fed Z.1 report at noon, which highlights Household Net Worth. It will be reported as significantly higher due to the rally in stocks from Jan to March. Also, Consumer Credit, expected +10-11 billion. More obvious cracks are opening regarding Consumer finance, but this data is for April.
–New lows in the first two SOFR one-year calendars with M4/M5 -101.75, down 1.5 on the day (9467.75/9569.5) and U4/U5 -99, down 1.5 on the day (9489.5/9588.5). There was a monster buyer of 180k SFRM4 at 9466.75. New, as open interest jumped 140k. Appears to be a great risk/reward trade as a cut in July would add about 12 bps to the contract. As of now, FFQ4 settled 9472.5 or 5.275 vs Fed Effective 5.33, so around 22% odds of an ease at the July 31 FOMC.
AI is not like DOT COM
June 6, 2024
**************
–It’s all about NVDA which joined MSFT and AAPL with a market cap over $3T. GDP is $28.5T so the value of these three is about 35% of GDP. I got one of those ‘your memories from this day’ emails yesterday, and the attached Nasdaq chart was included.

From March 1999 to March 2000, Nasdaq doubled (NDX-100). Currently NDX is a bit over 19k; at the start of 2023 it was around 11k, not quite doubling in a year and a half. Of course, rates were high at that time (a friend kept reminding me, “It doesn’t matter, these tech companies don’t borrow money”). Dot.com mania was in full swing. And of course, going into the turn of the century Y2K fears were being plastered across headlines: Bank computers would stop working, air traffic control would fail, etc. There was a lot of investment in new systems By March of 2021 it was pretty much a full round trip, 72% off the high.
–Bank of Canada cut 25 yesterday. ECB on tap to do the same today. ADP was weaker than expected at 152k but ISM Services vaulted higher to 53.8. Rates still ended lower, with tens down another 5 bps to 4.287%. On Friday, to end last week and month, tens were 4.512%. As of yesterday, a drop of 22.5 bps, essentially a rate cut, just like the Bank of Canada and ECB, except the Fed’s not in on it (but we can expect Powell to blather about the weakening job market next week).
–Because the very front end of the US curve is pinned, the reds (1-year forward) were the leaders on the SOFR strip, with March, June and Sept 2025 contracts +5.5 to 9544, 9567.5, 9587). Near one-year calendars made new lows with M4/M4 at -100.25 and U4/U5 -97.5… 4 ease territory.
–Got my name in the paper yesterday (Sun Times)…of course it didn’t have anything to do with market stuff, but rather was from a picture I had taken and shared with a friend – a cicada emerging from its shell. The constant undulating buzz from this mass of insects is now a constant…and it’s loud!

If the Labor Market Stalls, it ALL stalls
June 5, 2024
*************
–Yields continued to tumble Tuesday, with tens -6.4 bps to 4.336%. JOLTS way lower than expected at 8.059m vs 8.355 exp. A couple of SOFR 1-yr spreads made new recent lows: Z4/Z5 at -84 (9512.5, 9596.5), down 3 on the day, and H5/H6 at -69.5, down 1.5 on the day. The front M4/M5 spread is still the most inverted and that one’s approaching the ‘four rate cut’ level at -95.25, down 7 on the day (9466.75/9562). FFQ4/FFQ5 settled -98.5 (9471.5/9570). Eases are still expected, and sentiment is again shifting to more rather than less.
–Of course the payroll data is out on Friday, but BBG had this little snippet yesterday: “…there’s more weak labor market data to come when the full Quarterly Census of Employment and Wages (QCEW) for 4Q23 is released tomorrow.”
https://www.bls.gov/cew/home.htm
| Quarterly Census of Employment and WagesQuarterly Census of Employment and Wageswww.bls.gov |
–QCEW is a BLS product. I skimmed a couple of things, but what immediately struck me was the table showing % changes in wages in the 10 largest counties in the US. Six of these, Cook, IL (Chgo), Maricopa, AZ (Phoenix), Dallas, TX, Orange, CA (LA), San Diego CA and Miami-Dade FL showed a NEGATIVE year-over-year wage!
–Another interesting snippet: (RTRS) reports Japanese real wages down 25th month in a row. The article reports that Japan nominal wage is 296,864 yen/month, or $1913.28 given the exchange rate. From google: “According to the latest figures by the Bureau of Labor and Statistics, the average salary in USA per month is $5,677 or $68,124 per year.” This week’s Market Huddle featured Tucker Scott, who mentioned similar stats to argue that the yen is way undervalued.
–We’ll see what Friday’s data brings, but the market is clearly postulating that the Fed is going to weigh the JOBS part of the dual mandate more heavily than inflation going forward. Of course, perhaps a small margin of the ftq bid yesterday had to do with the plunge in Mex Peso and in India’s SENSEX after the poor showing by Modi’s party.
–US equities seem to be cheering for a looser Fed. If the Fed leans easier due to deteriorating labor markets, that spells recession. Not likely to be equity positive. Patrick Ceresna (MacroVoices) notes that in January, 90% of stocks in the SP500 were above their 50 DMA. In March, it was 85%. Now…just 37%!
–ADP and ISM Services today.
Black Keys playing at the neighborhood bar down the street
June 4, 2024
*************
–This past weekend I mentioned a few developments in the financial landscape that echoed initial problems in 2007 which culminated in the GFC. Of course, today’s issues – problems in private credit and commercial real estate funds – probably don’t rise to the same level of systemic stress. However, Monday’s trade certainly had a whiff of something not quite right in the financial architecture.
–For example, 5, 10 and 30 year yields sank 10-11 bps (10y down 11.2 to 4.40%). Implied vol in treasuries firmed up. Gold rebounded and oil was hammered, with CLN4 down nearly $3/bbl late at 74.05 (and it’s below 73 this morning). USD traded lower. Just FEELS like something is going on beneath the surface. Stocks were weaker early but floated back to edge slightly positive given the cue of lower interest rates.
–ISM Mfg weakened at 48.7 vs 49.5 expected. New Orders soft, but the Employment component was 51.1, stronger than estimated. JOLTS today 8350k exp vs 8488k last. In the anecdotal news dept, a story making the rounds is that several major concert tours have been cancelled (J-Lo) while some artists shift to smaller venues (Black Keys). From a Yahoo article: “SeatGeek said in an email that the average resale ticket price to attend a summer concert is down to $213 from $257 around this time last year.” DEFLATION! Thanks Taylor. There are also legal actions pending against Live Nation and Ticketmaster which may be contributing to a slower season.
‘they want to get my gold on the ceiling/ i ain’t blind, just a matter of time/ before you steal it’
ISM Mfg today, NFP on Friday
June 3, 2024
*************
—Vicious end-of-month squeeze in stocks Friday. In the last half hour ESM rocketed 65 points from 5242 to 5307 and is holding this morning at 5302.5 (+7.0 from settle). CLN4 just slightly lower after OPEC extended voluntary production cuts. US yields eased Friday with 10s down 4 bps to 4.512% (now 4.473). TYU4 settled 108-25+ and is currently 109-01+.
–ISM Mfg this morning, expected 49.6 from 49.2. Since late 2022 it has been sub-50 with the exception of a 50.3 print for March. Prices Paid expected 59.5 from 60.9 last. Prices have shown strength, having moved up from 45.2 at the end of last year.
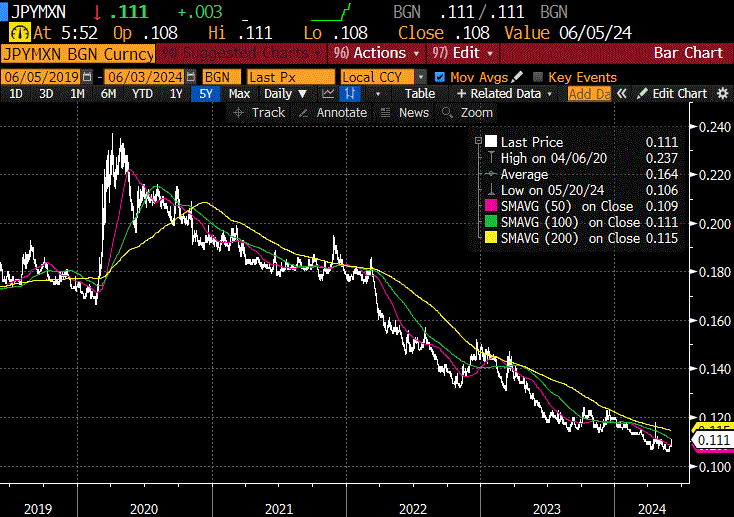
–On Friday John Deere (DE) announced layoffs and other operational cost saving moves, citing declining demand. Earlier in the year DE announced 684 layoffs across plants in Iowa and Illinois. DE is moving some production from the US to Mexico. MXN has generally strengthened against USD since covid, (from 24.00 to 16.26 this year) but it is weakening in the wake of Claudia Scheinbaum’s landslide win for President. I have also included a chart of JPY vs MXN…possible that MXN is turning here?
–ISM Services Wednesday. Payrolls on Friday expected 180 to 190k from 175 last. ECB fully expected to cut 25 on Thursday.
The Bell Tolls
June 2, 2024 – Weekly Comment
**********************************
In March 2007, an article in the WSJ cited problems at Bear Stearns’ subprime mortgage funds. In June 2007 Bear pledged a collateralized loan of around $3.2B to its sinking funds, the High Grade Structured Credit Strategies Fund and the Credit Enhanced Leverage Fund. By July 17, 2007, Bear reported that both funds were essentially worthless. They were ringing the bell.
A contemporary paper on that era’s credit crisis noted, “In the summer of 2006, it became clear that the subprime mortgage market was in stress. At this time, the ratings agencies issued warnings… Moody’s first took rating action on 2006 vintage subprime loans in Nov 2006.”
After a spirited 13% rally in 2H 2006, SPX pulled back in March ’07. Having ended 2006 at 1418, by July 13 it was 1552. A hard sell-off ensued on the ‘worthless’ news, but by October’07 SPX made a new high of 1576, as the Fed had cut 50 bps in September, from 5.25% to 4.75%. By the end of January 2008, FF had been slashed to 3% as stocks cratered. Incidentally, CPI was 3.4% in March 2006 (same as now) and peaked at 4.3% in June 2006. Thus began what is called the Great Financial Crisis.
Last Wednesday, Jamie Dimon said “There could be hell to pay” regarding private credit. “I’ve seen a couple of these deals that were rated by a rating agency and, I have to confess, it shocked me…”
Right on cue, BBG reported Friday: “Canadian investment mgr Ninepoint Partners is temporarily suspending cash distributions in three of its private credit funds, making it the latest lender to put a squeeze on investors to cope with a liquidity crunch.”
The largest of the three funds is Ninepoint-TEC, which reported C$1.2 billion in assets under management at the end of 2023. It makes asset-backed loans to companies that “may have difficulty obtaining financing from other sources” — and certain borrowers have the option of using a payment-in-kind structure rather than cash interest payments…So-called PIK loans allow a company to defer some or all interest payments until the debt matures.
The Ninepoint Alternative Income Fund, which has about C$600 million in AUM, has the bulk of its loans to middle-market companies in the U.S. and Canada. It normally targets payouts to investors of 10% to 12% of the average NAV in a calendar year, according to documents on Ninepoint’s website.
The firm is not winding down these funds… “Investors will continue to have access to the ongoing benefits of being invested in private credit as we remain focused on ensuring the sustained performance and stability of our current portfolio.”
Starwood has also gated funds. CEO Sternlicht last week wrote to investors in Starwood REIT that the firm would begin limiting redemptions, and Blackstone’s REIT has already done the same.
“Starwood founder Sternlicht said the change [gating redemptions] at the $9.9 B REIT, the second largest of its kind behind BREIT, is temporary. It is likely to be in place for 6 to 12 months ‘in anticipation of a lower interest rate environment and improved real estate capital market’…During the period of the amended share repurchase, he added, the adviser would waive the 20 pct management fee.
A BBG article cites a recent paper with this headline:
‘Big Banks’ CRE Exposure Rises 40% When REIT Debt is Factored In’ From the piece,
“Collateral damage to the largest banks from intensive credit line draw-downs means that systemic risk from total CRE exposure is probably much greater than if you only look at direct exposure,” said Manasa Gopal, an assistant professor of finance at Georgia Tech, who’s one of the report’s authors.
Ding. Ding. Ding.
The question of course, is whether these problems are systemic. Even if there’s conviction that they could be, the 2007 experience clearly illustrates that timing is important. Additionally, the retail public is conditioned by the financial news networks into the belief that Fed easing will solve, well, everything. What if the Fed’s already behind the curve and is steadfastly holding rates because it doesn’t want to appear political?
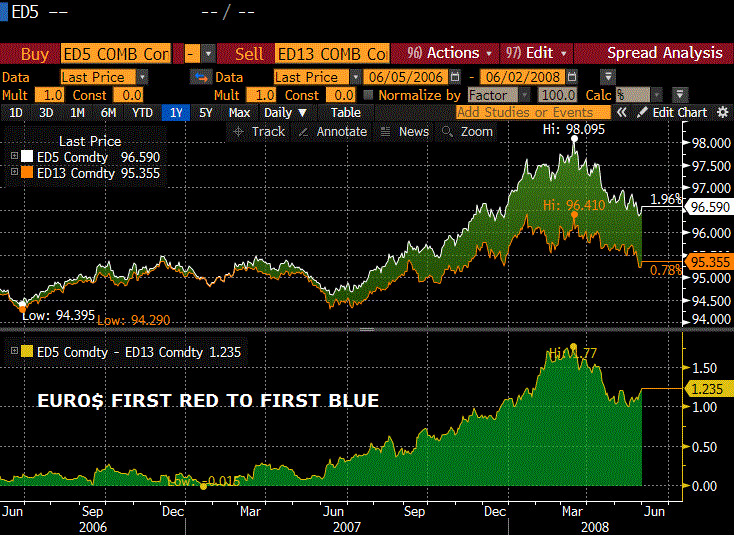
Below I post a couple of Eurodollar calendar spreads relating to the start of the GFC. Top panels show the contract prices and bottom panels are the constant maturity spreads. The hope is to help identify which spreads to favor, though this is just a cursory look.
The first spread is ED5 to ED13, or the first red contract (5th quarterly) to the first blue (13th quarterly). Note that BBG changed the syntax with SOFR contracts, since the first contract continues to trade past the IMM date. That is, on the ED curve the first would have now been June (a forward period contract) and now SFR1 is considered March’24. So for a proper comparison look at SFR6 to SFR14 currently.
In any case, there are a couple of takeaways. First, the spread was positive throughout 2006 and 2007. Even with FF constant at 5.25% from July 2006 to mid-Sept 2007, the first red was pretty much capped at 9550 and the spread ranged from around 0 to +25. Currently the first red to first blue, SFRM5 to SFRM7 is -64.5 (9545/9609.5). The next spread, SFRU5/U7 is -47 (9563.5/9610.5). In a couple of weeks Sept will be first red to first blue. Secondly, futures contracts bottomed and the spread generally rallied from June/July 2007. So, from +33 at the end of June the constant maturity spread rallied to +177 by March’08. My suspicion is that June 2024 and beyond may end up resembling the playbook following June 2007.
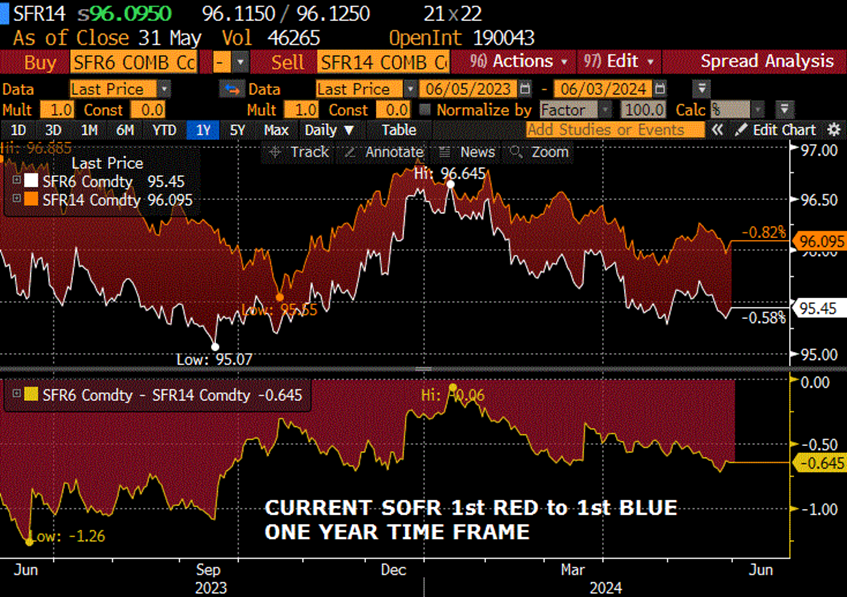
If that were to be the case, then buying the forward SOFR spread would be the correct strategy. That’s especially true given the severe inversion currently in place. However, there are mitigating issues this year, including the inflation fight and the election. So rather than buying SFRM5/M7 one might favor SFRU5/U7 (-47) or SFRZ5/Z7 (-32). I do favor a steepening trade, though there can obviously be quite a bit of volatility with this type of structure, and roll is a headwind. Additionally, in 2008 ED5 traded over 9800, or less than 2% yield. My belief is that the Fed no longer wants to push hard toward the zero bound, so reds may be limited on the upside, well below 9800.
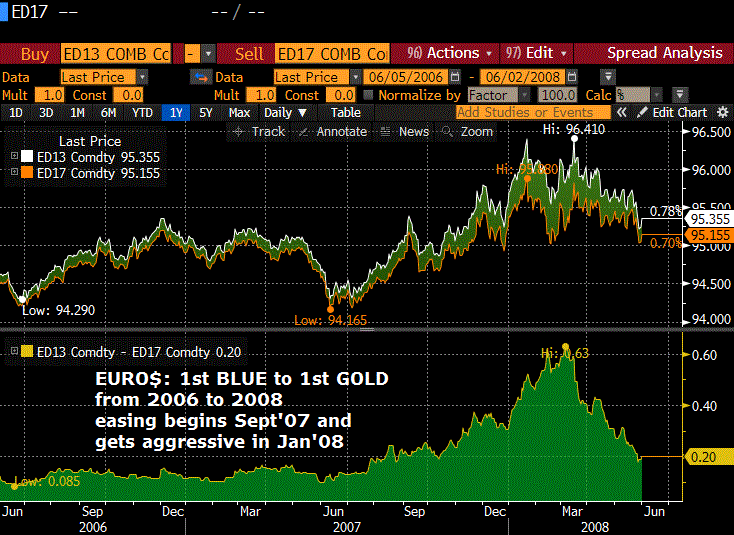
Below is the Euro$ chart, first blue to first gold, or the 13th to 17th contract from 2006 to 2008. Notice that in the year of a constant 5.25% FF rate (until Sept 2007) the spread traded in a pretty small range of +8.5 to +16.5. From the beginning of July 2007 to March 2008 it rallied 50 bps to +63. The first blue/first gold SOFR spread has been in a wider range this year, primarily between -1 and +17. It’s now at the low end of that range at +1.0 (SFRM7 9609.5 and SFRM8 9608.5). SFRU7/U8 is +2 (9610.5/9608.5). I could easily see a rally of 50+ bps in these spreads, relative to risk of about 10 from here.
| 5/24/2024 | 5/31/2024 | chg | ||
| UST 2Y | 494.8 | 489.1 | -5.7 | |
| UST 5Y | 452.9 | 452.6 | -0.3 | |
| UST 10Y | 446.6 | 451.2 | 4.6 | |
| UST 30Y | 457.1 | 465.2 | 8.1 | |
| GERM 2Y | 308.7 | 309.7 | 1.0 | |
| GERM 10Y | 258.3 | 266.4 | 8.1 | |
| JPN 20Y | 185.6 | 187.2 | 1.6 | |
| CHINA 10Y | 231.4 | 231.9 | 0.5 | |
| SOFR M4/M5 | -74.3 | -78.5 | -4.3 | |
| SOFR M5/M6 | -54.5 | -52.0 | 2.5 | |
| SOFR M6/M7 | -17.5 | -12.5 | 5.0 | |
| EUR | 108.56 | 108.48 | -0.08 | |
| CRUDE (CLN4) | 77.72 | 76.99 | -0.73 | |
| SPX | 5304.72 | 5277.51 | -27.21 | -0.5% |
| VIX | 11.93 | 12.92 | 0.99 | |
https://www.investopedia.com/articles/07/bear-stearns-collapse.asp
https://www.fdic.gov/analysis/cfr/bank-research-conference/annual-8th/turnbull-jarrow.pdf
https://blinks.bloomberg.com/news/stories/SE92EAT1UM0W
https://www.pionline.com/alternatives/canadas-ninepoint-partners-halts-cash-payouts-3-credit-funds
https://www.perenews.com/starwood-private-reit-gating-will-lead-others-to-consider-it
https://blinks.bloomberg.com/news/stories/SEAXI6T1UM0W
Inflation data today
May 31, 2024
**************
–News today includes the Fed’s preferred measure of inflation, Core PCE prices, yoy expected +2.8 same as last month. Headline expected 2.7, also same as last.
On a less important note (perhaps) Chicago PMI is released. Last at 37.9, it’s expected 41. The lowest print in the past 4 years was 37.8 in Nov 2022. If it doesn’t bounce, it’s another indication of weakness….like CRM, like Kohl’s, like Target, like Workday.
–Yields fell across the curve yesterday with tens down 7 bps to 4.562% and thirties down almost 6 at 4.684%. SFRM5 to SFRM8 +6.5 to 8.5. Felt like some trades were simply end-of-the-month liquidations. Not much reaction to Trump’s guilty verdict. Stocks generally weak. NVDA made a new high on an outside range and closed down 3.8%. Possible trend reversal.
Non-profits saw solid demand…oh great
May 30, 2024
**************
–Both stocks and bonds weak. 7 year auction tailed by 1.3 bps at a yield of 4.65% but treasuries stabilized post-auction. On the day, the ten year yield rose 8.2 bps to a new recent high of 4.622%. Treasury rolls have been substantially completed with heavy trade yesterday. Of course, June open interest has plunged in every treasury contract as expiration nears. I’m not sure if there is anything to read into this, but AGGREGATE open interest fell across UST contracts. I.e. September futures didn’t increase anywhere close to June’s losses (if data on prelim report is correct). For example, TYM OI fell 556k, but TYU only added 473k. UXYM OI fell 353k but UXYU only rose 272k. Somewhat strange given a move to higher yields, huge supply issues and a jump in implied vol. (TYU4 atm 108^ 2’32 or 6.0 vs Tuesday atm 108.5^ 2’27 or 5.7).
–Today’s news includes Q1 GDP 2nd estimate at 1.3% from 1.6% with Price Index 3.1% and Core 3.7%.
Jobless Claims expected 217k
PCE prices tomorrow.
–Large new sale of 0QU 9550^ 51.5/52. Settled 51.5 vs 9551.0 in SFRU5. Breakevens approx 4% and 5% with 106 days until expiry.
Exit buyer of 20k 0QM/2QM 9600 call spread for 4.5 to 5.0, paying up for the 2QM calls. As noted over the weekend, SFRM5/SFRM6 spread has continued to decline as reds bore the brunt of selling given the Fed’s insistence that rate cuts aren’t necessary in the short term. On May 1, M5/M6 was -44, on Friday the low was -54.5, though yesterday it settled -48.5. Being short 2QM 9600c was a bit close for comfort with SFRM6 settling 9583.
–Just a couple of cherry-picked lines from Beige Book: (they’re all doing it…I just admit it)
Retail spending was flat to up slightly, reflecting lower discretionary spending and heightened price sensitivity among consumers.
Wage growth remained mostly moderate, though some Districts reported more modest increases.
Contacts in most Districts noted consumers pushed back against additional price increases, which led to smaller profit margins as input prices rose on average.
Nonprofits and community organizations cited continued solid demand for their services… [ I don’t like the sounds of that one…]

