
Rates soar
March 19, 2026
****************
–Rate futures crushed yesterday as oil prices continued to rise and Powell emphasized economic and inflation uncertainty. Fed dots regarding FF were same as last, projecting one ease this year and one next year. PCE inflation for 2026 projected 2.7 from 2.4 at the Dec meeting, with 2027 up 0.1 to 2.2 from 2.1. GDP Growth also projected higher: 2.4 from 2.3 for 2026 and 2.3 from 2.0 for 2027. Powell noted there’s been zero growth in private payrolls, but zero might be equilibrium given immigration trends. “Zero employment equilibrium might feel like a downside risk”.
–Near SOFR contracts are in freefall. SFRZ6 settled 9647.5 yesterday, -9.0 bps at 3.525%. That’s not even reflecting ONE ease this year. This morning the contract prints 9640 or 3.60% vs EFFR of 3.64%. Ten year yield rose 5.5 bps to 4.255%, with a new recent low in 2/10 at 50.7 (2y 3.748%, +8.1). SFR settles yesterday: Z6 9647.5, -9, Z7 9665.0, -7.5, Z8 9657.5, -6.5.
–Carlyle’s Jeff Currie yesterday on BBG highlighted the disconnect between physical energy prices and ‘paper’ prices reflected by futures. He noted that the spread between Singapore and Rotterdam prices for jet fuel has collapsed, now both around $230/bbl. (no excess supply). Energy infrastructure damage will take a long time to rebuild. Currie’s summary: “You can’t PRINT molecules.”
–The other truly amusing X post is NY Gov Hochul asking high-net worth individuals to come back to NY to support generous social programs. (She says she ‘needs’ them). She notes that NY is in competition with other states and that remote work changed everything. Wow. Stunningly belated recognition of what everyone else knew several years ago.
–Worth a note that Micron (MU) blew estimates away yesterday (revenue nearly tripled yoy). However, the stock which closed 461.73 is 435 this morning, a somewhat ominous signal going into the biggest option expiry ever tomorrow.
–Today’s news includes Jobless Claines expected 213k, Philly Fed and New Home Sales (Powell mentioned weakness in housing during presse
dots and dissents
March 18, 2026
****************
–Boring day yesterday with little outright movement. Peak SOFR contract SFRZ7 rose 1.5 to 9672.5. Ten year yield fell1.8 to 4.20%. Implied vol continued to slip in front of today’s FOMC. As an example, 0QM6 (SFRM7 underlying midcurve straddle) was 54.5 on Friday, then 46.0 on Monday (9662.5^ vs 9664.0) to 43.0 yesterday (962.5^ vs 9665.5).
–Today there will be a lot of fluffy analysis about dissentions and dots. The last Fed meeting was Jan 26, which didn’t include SEP. However, I thought it might be instructive to look at actual market prices from Jan 28, the Friday after the last FOMC, to yesterday. To me, it doesn’t appear as if the market is clamoring for ease or hike one way or the other, even with obvious price ramifications of oil.
Price or yld 1/28/26 3/17/27
2y 3.573 3.667
5y 3.830 3.782
10y 4.244 4.200
30y 4.856 4.850
SFRM7 9671.5 9666.0
SPX 6978 6716
CL1 62.39 96.21
GOLD 5417 5005
DXY 96.45 99.57
The standout of course, is oil, +54%. SPX is down 3.8%. But rates have barely budged. It’s true that there’s been some volatility since the Jan meeting, and it’s clear the market has tamped down forward easing expectations. Dollar strength has likely added to the idea of economic restraint. But it doesn’t appear that there’s any compelling reason for the Fed to act prior to Warsh coming in.
Hedges unwound
March 17, 2026
******************
–Hedges placed for weekend risk on Friday were unwound yesterday, Red SOFR contracts were mostly +8, 5yr yield down 6.8 to 3.802% and 10’s fell 6.1 to 4.218%. Peak SOFR contract SFRZ7, +8 at 9671 or 3.29 vs current EFFR 3.64. Implied vol on rate futures imploded with many near SOFR straddles down 6 bps! As an example, the atm SFRM7 midcurve straddle (0QM6) went from 54.5 on Friday to 46.0 yesterday (9662.5^ vs 9664). Price action suggests little in the way of conviction with many spreads bouncing around on scant underlying news.
–LME halted metals trading due to a glitch. Soybeans were limit down after having had a nice run-up (partially due to concerns about fertilizer supplies). CLK6 (WTI) was down 4.38 yesterday at 92.46 but has re-gained about $3 of that this morning with renewed Iranian attacks on UAE. I’ve heard they’re offering Dubai office buildings at an even steeper discount than recent Chicago sales…
Morgan Stanley (according to BBG) says the default rate on private credit should hit 8%.
–20y US bond auction today. PPI and FOMC tomorrow.
Made it thru the weekend
March 16, 2026
****************
-Friday featured a slightly steeper curve after two weeks of relentless selling in the 2y and red sofr contracts. On Friday 2y fell 2.8 bps to 3.732% (2/27 low 3.38) and 10y rose 0.8 bp to 4.279% (3.94). Weekend hedges against disaster were, fortunately, mostly unneeded, leading to small reversals this monring. As of this writing stocks have levitated modestly (ESM +37 or 0.6%), WTI is down around $1, Treasuries are staging a tentative rebound off last week’s lows, April gold is back below $5000/oz (currently down 70). Once again, 10y breakeven (treasury – tip) edged to a new high of 244 bps, as long-term inflation expectations slowly grind higher.
–News today includes Empire Mfg and Industrial Production. FOMC Wednesday.
–During the time of COVID there was a boom in Recreational Vehicle sales. Just over five years later, there’s this tweet:
THE RV MARKET IS CRASHING — $239,660 WINNEBAGO NOW SELLING FOR $120,000 — A 50% WIPEOUT An RV dealer walking his lot just showed what’s happening across the RV market right now. He tours a 2024 Winnebago Vista Canyonlands National Park Foundation Edition 29NP with only 8,113 miles on it. Then he shows the original window sticker. MSRP from Winnebago: $239,660 Current price? $120,000.
We’ve already seen a lot of Commercial RE trade at significant discounts recently…maybe 5 years is the tipping point across many asset classes.
Worth watching Currie interview
March 15, 2026 – Weekly comment
**************************************
BIG jump in yields over the past week. The 2y surged 18.4 bps from 3.548% (essentially the bottom end of the FF target range of 3.50-3.75%) to 3.732% (just under the top of the target range). Tens and thirties rose just over 15 bps to 4.279% and 4.904%. On the SOFR futures strip, SFRM7 was weakest, down 20.5 bps to 9656 (3.44%). Peak contracts are now a bit further back: SFRZ7 and SFRH8 at 9663.0 or 3.37% or just about one-qtr pct lower than current EFFR of 3.64. Since the invasion, the market has squeezed out easing prospects from about 3 qtr-pt cuts to just 1.
Fascinating BBG interview with Jeff Currie, commodity guru at Carlyle (formerly at Goldman). It’s about 8 minutes long. His main theme is that infrastructure damage and Hormuz closure is a hugely disruptive global supply chain issue that will lead to an economic regime change. Key line: “There is NO policy response that can stop this ascent in crude. None.”
https://twitter.com/search?q=currie&src=typed_query
But there are a couple of other comments which perhaps shed some light on US bond weakness. Currie notes that prior to 2022, an oil shock in which excess dollars accrued to oil producers (OPEC), would tend to be recycled into US Treasuries, in effect cushioning the inflationary blow of higher prices, This influx of capital into the US acted similarly to QE. However, since the US and Europe froze Russian assets, that money now goes into gold, not US denominated assets that might be subject to sanctions. Currie recomments HALOs, Heavy Assets, Low Obsolecense…i.e. old economy companies rather than the ‘asset lite’ model which had been in place.
Having said that, this week’s price action featured USD strength, with DXY ending at 100.362, its highest level since May 2025. Gold closed the week near the low at 5019.49.
For now, the rise in the price of oil is being viewed through an inflationary lens. In the month from Friday, February 13, to Friday, March 13, CLJ6 has risen 57%, from 62.75 to 98.71. Currie warns of additional demand due to hoarding, and certainly the fear of unavailable supplies conjures up memories of the great toilet paper run during covid. Or, for those of an earlier vintage, John Denver (of Rocky Mountain High fame) installing gas tanks with a capacity of 30k gallons at his property in Colorado in the early 1970s).
In mid-June 2013, with US FF at zero, Bernanke hinted at a possible end to QE, The market was unprepared and Eurodollar contracts plunged, with near contracts falling below 9950, even though there was no indication of an actual rate hike. Recovery took a few weeks. The current wash-out in SOFR contracts reminds me of that period. With a variety of other factors already threatening economic growth (private credit issues, weak jobs sparked in part by AI, loss of immigrant demand) it’s hard to imagine the Fed considering a shift to higher rates, even with a shift to higher inflation. However, the market is starting to reflect that concern.
From here, if oil accelerates I would expect the major stock indexes to suffer, thus supporting treasuries. And, if oil falls, then I would expect slightly diminished inflation expecations, which should also supprt UST. A previous slogan was ‘buy bills and chill’, but at this point I would think ‘stand aside, take five’ makes sense. The 5y yield is 3.87%. Sure, PCE yoy is 2.8% with a large risk of higher (Core 3.1%), but there’s something to be said for sitting out what could be a significant drawdown in stocks.
This week features several Central Bank meetings: US and BOC on Wednesday. ECB, BOE and BOJ Thursday. As an indication of relative moves, below are CB base rates. And then Sept’26 futures of each, from Feb 27 until Friday:
Base rate Sept’27 on 2/27 Sept’27 on 3/13 Net Change
Fed 3.625 9677.5 9644.0 (3.56%) 33.5 bps
BOC 2.25 9781.5 9743.0 (2.57%) 38.5
ECB 2.15 9800.5 9752.5 (2.475%) 48.0
BOE 3.75 9676.0 9608.0 (3.92%) 68.0
| 3/6/2026 | 3/13/2026 | chg | ||
| UST 2Y | 354.8 | 373.2 | 18.4 | |
| UST 5Y | 371.0 | 387.0 | 16.0 | |
| UST 10Y | 412.7 | 427.9 | 15.2 | |
| UST 30Y | 475.2 | 490.4 | 15.2 | |
| GERM 2Y | 230.7 | 243.7 | 13.0 | |
| GERM 10Y | 285.8 | 298.0 | 12.2 | |
| JPN 20Y | 299.4 | 312.1 | 12.7 | |
| CHINA 10Y | 179.8 | 182.4 | 2.6 | |
| SOFR M6/M7 | -33.5 | -19.0 | 14.5 | |
| SOFR M7/M8 | 4.0 | -5.0 | -9.0 | |
| SOFR M8/M9 | 17.0 | 12.0 | -5.0 | |
| EUR | 116.18 | 114.17 | -2.01 | |
| CRUDE (CLK6) | 87.52 | 96.84 | 9.32 | |
| SPX | 6740.02 | 6632.19 | -107.83 | -1.6% |
| VIX | 29.49 | 27.19 | -2.30 | |
| MOVE | 81.26 | 91.17 | 9.91 | |
Short end implosion
March 13, 2026
****************
–On Wednesday afternoon/Thursday morning I suggested that selling pressure on the US front end may have run its course. I was spectacularly wrong.
–SFRM7 was the weakest contract yesterday, down EIGHTEEN bps to settle 9652.5. From the early morning March 2 high of 9711.5 to yesterday’s low 9651.5 has been 60 bps. SFRZ6 now only has about half a cut priced in (settled 9646.5 or 3.535% relative to EFFR and SOFRRATE 3.64). Near one-year SOFR calendars made new highs as reds bore brunt of the selling. For example, a recent low in SFRM6/M7 was -52.5, it settled -16 yesterday up 12 bps!! Some trades are expressing the chance of rate HIKES. Imagine Warsh coming in and the first move is a rate increase! Next thing you know they’ll be saying crude oil prices can go negative!
–March SOFR options go off the board today, and June’26 will be in the front slot of the strip tomorrow. In the four years spanned by SFRM6 to SFRH0 the range of yesterday’s settles was 9636.5 (M7) to 9661.0 (H8), just 1/4%.
–Understandably implied vol exploded. Example, SFRH7 9650^ settled 72.5 vs 9648.5. On Wednesday, SFRH7 9662.5^ settled 66 vs 96.66.
Also consider these midcurve straddle settles: 0QU7 9662.5^ settled 67.0 vs 9657.5 while 2QU7 9662.5^ settled 58.5 vs 9657.0. A spread of maybe 3 or 3.5 is reasonable, 8.5 seems a bit crazy for same amount of days, same strike price, and underlying contracts only 0.5 bps apart.
–Treasury vol also exploded as uncertainty grips the market. On Wed FVJ6 109^ settled 0’44 vs 108-28 in FVM6. Yesterday the atm 108.5^ settled 0’55 ref 108-1325. Two weeks left in April treasury opts. Back of napkin calculation is about 19.5 bps for that straddle (DV01 is 44.20). 2QJ 9662.5^ settled 26.5 with 2 weeks more time value.
–This morning dollar index is making a new high 100.13 last, testing highs from last year in August, 100.26 and November 100.39. Big level with clear sailing to upside on a breakout.
–It’s all about the flow of oil, but there are some pieces of data today: PCE Price yoy 2.9 exp vs 2.9 last with Core 3.1 from 3.0. U of Mich Sentiment expected 54.8 vs last 56.6. The 2022 low was 50.0 and last year’s low 51.0. JOLTS expected 6750k from 6542k.
Selling pressure on SOFR contracts likely drawing to an end
March 12, 2026
****************
–Pressure on interest rate futures has been relentless since the hostilities against Iran started. SFRU7 is peak contract on the SOFR strip; the 3/2 high was 9711.5 and yesterday’s (new) low was 9672, a total range of 39.5. The ten year treasury yield (closes only, not extremes) has gone from 3.941 to 4.211 or 27 bps. Going into March SOFR option expiration, SFRH6 settled 9632.75, while SFRZ6 is 9661, a spread of just -28.25, or around one 25 bp ease being priced into year-end. Yesterday’s CPI was a non-event, as expected yoy 2.4% with Core +2.5%.
–Iran escalated attacks on tankers, causing CLK6 to surge over 90 again this morning (now 90.30, +4.23). It’s often said that Trump operates without any long term plan, but Iran’s whole strategy seems to be to knock out energy infrastructure to bring the west to its knees. In my opinion, that’s a flimsy and desperate stance. Long term chance of success is zero. This morning Trump said the US may restrict exports.
–Other news snippets: Morgan Stanley gating a private credit fund. FBI warns CA of possible Iranian drone attacks. Financial stress in Private Credit/Equity was apparent before Iran and is likely to continue. The question is whether the labor market continues to deteriorate.
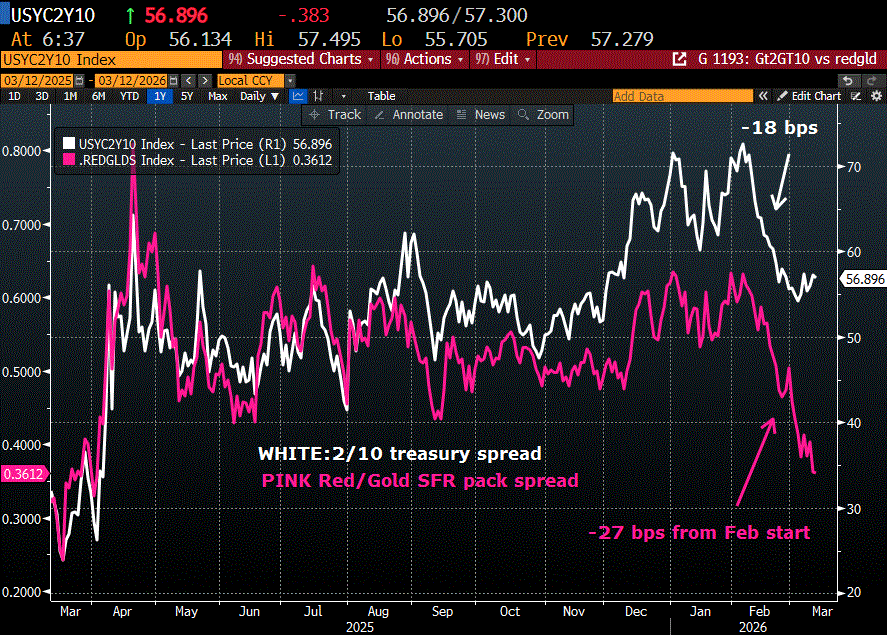
–A couple of technical notes of interest: 10y breakeven (treasury minus tip) edged to a new high 238.2 bps, so those who are convinced of another inflationary surge can point to this metric (however, from last May forward the range has been 224 to 246, so the signal is weak at best. Of more interest, red sofr contracts (currently year 2027) to more deferred contracts made new lows on spread yesterday. For example, red pack to gold pack (2nd to 5th year) settled 36.25, down 4 bps (9671.125/9634.875). Makes sense: the market has squeezed out forward easing expectations. However, 2/10 spread rose 0.4 bps to 57.2 (3.632, +6.5 and 4.204, +7.0). Perhaps longer end weakness is tied to yesterday’s 10y auction (with 30s today).
–I’ve attached a chart of 2/10 vs red/gold. Perhaps the relative moves are just a function of the ten year swap spread falling from -35 in Jan to -46 now. However, there is evidence of long SOFR option exits. As an example, SFRU6 9700/9750/9775c fly at 2.5. Not a big trade, and not much delta, but other exit trades occurred as well. (I’d be a buyer of the Sept broken fly NOT A RECOMMENDATION).
All about oil infrastructure
March 11, 2026
*****************
–Markets continue to be dominated by the oil chokepoint of the Strait of Hormuz. Yesterday’s X-post by Energy Sec’y Chris Wright that the US had escorted a tanker through the strait saw oil immediately sell off a few bucks, but the post was then deleted and oil recovered. With various reports of Iran now mining the waterway, CLK6 is +4.96 at 87.06 (this morning). Stocks modestly weaker and treasuries also under pressure in front of today’s CPI and ten-yr note auction. CPI is expected m/m 0.3 with Core 0.2. Yoy 2.4 with Core 2.5%. Currently the market is leaning toward the inflationary aspects of second derivative effects of oil supply issues.
–Rate futures showed little net change; small bounce in near contracts with SFRZ6 and H7 both +3 (9669.5 & 9674.5). Two year yield eased 2 bps to 3.567% and 10s essentially unch’d at 4.134%. There continue to be a fair amount disaster insurance trades, for example a buyer yesterday of 25k SFRM6 9700/9850cs for 1.5 (settled there ref 9645). The most notable feature yesterday though was the crush in implied vol. Examples: SFRU6 9662.5^ 39 on Monday (9657.5) and 36 yesterday (9660). SFRH7 9675^ 69.0 on Monday and 63.0 yesterday. TYM6 112.5^ 2’07 to 1’61. In my opinion, rate futures are not signaling an inflationary surge.
–March midcurves expire Friday. 0QH 9675^ settled 9.0 ref 9674.5, 2QH 9675^ settled 8.0 vs 9677.5.
Oil pullback helping stabilize markets
March 10, 2026
*****************
–Through last week and into yesterday selling pressure was evident in rate futures, particularly in shorter maturities, as Iran hostilities boosted oil prices and gave rise to increased inflation concerns. On Friday 2/27 red sofr pack settled 9704.625, popped higher Sunday night and has declined ever since. Yesterday’s settle was 9676.25 (-3.875) so closer to 3.25%. However, Trump’s hints of de-escalation late yesterday and this morning have sent oil lower and fixed income prices higher. After reaching 113.41 on Sunday night, CLK6 is currently 84.00 (-7.48 on the day). This morning Netanyahu warns that the war on Iran ‘has not ended yet’.
–Some curve measures closed at new lows yesterday, with 5/30 100.6, down 3.6 bps (recent high 112.3). 2/10 is stuck near the low at 54.4 and red/gold pack spread is just 38.375. If oil continues to retrace lower these spreads will likely rebound somewhat. The market is NOT pricing near-term easing, however fears of accelerating labor market weakness due to AI and general uncertainty are still lurking. Private credit/equity issues remain as well.
–Today’s news includes Existing Home Sales and 3yr auction ($58b, followed by 10, 30 on Wed/Th). Small pullback in NFIB Small Business Optimism to 98.8 from 99.3. CPI tomorrow.
–March midcurve options expire Friday. As of yesterday settled 0QH 9675^ 13.0 ref 9671.5, 2QH 9675^ 12.5 ref 9677.5 and 3QH 9662.5^ 11.5 ref 9662.0. Probably priced appropriately, though if I had to be involved I would favor long calls into the end of the week.
Oil Surge Weighs on FI
March 9, 2026
***************
–The WSJ site features this chart of inflation adjusted oil prices:
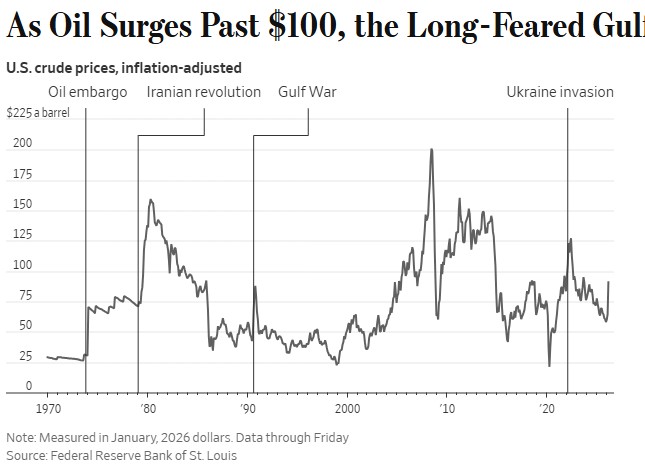
–WTI spiked close to 120/bbl early this morning but is now back around $100. It’s worth noting that the front WTI contract was also above 120 at the start of the Russia/Ukraine invasion. As is typically the case, gov’t actors step in to help (as is being considered now) by releasing reserves etc. I’m sure China will be a willing buyer if Western Gov’ts are able to force prices down.
–Friday’s lower than expected payroll release of -92k sparked a brief rally in bonds which was quickly extinguished. Ten-yr cash yield tested 4.10 but ended at 4.127%. High in TYM6 was 112-21, settled 112-14, now 112-04 (early Mon morning). High in the peak SOFR contract, SFRU7, was 9685, though later in the day the high tick was 9686.5, Settle was 9682, currently 9677.5.
–Nikkei down 5.2% today, though the index had nearly doubled from just over 30k to just under 60k from last year’s Liberation Day to the end of February. From end of Feb high print to now Nikkei fell around 13%. By contrast SPX from this year’s high to low is a pullback of just over 4%.
–FOMC is next week, Current EFFR is 3.64 or 9636. April Fed Funds are 9637, so these is essentially no expectation of ease. The May FF contract captures the April 29 FOMC and that settled 9640, so there’s currently less than 20% odds of an ease at that meeting. Perhaps another bad payroll report next month will increase odds of an ease, or maybe it won’t happen until Warsh is installed. In any case, weight on the short end has been unrelenting over the past week.

