Yields powering higher
October 22, 2024
******************
–Yields are climbing. Yesterday 10’s rose 10.9 bps to 4.182%. I had mentioned the midway point of this year’s range in the 30y bond, from the April high of 4.81% to the Sept low of 3.93%. That level is 4.37% and the market had bounced around that area for a few days. However, late yesterday we popped above the 0.618 retrace of 4.475%. With a futures settle of 118-22 on USZ4, I marked 30s at 4.487%, and as of this note the futures print 118-10.
–Flows were biased to the downside. For example, a buyer of 50k TYX4 111.75p for 26 ref 111-17. Settled 27 vs 111-165, with open interest up 44k. Nov options expire Friday. Somewhat interesting that these could be done at one price, as the delta was around 60, equivalent to 30k TYZ4. Also a new buyer of 35k 2QZ5 9625/9600p spd for 5.0 to 5.25, settled 5 vs SFRZ5 9654.5. (This is around 5y treasury part of the curve).
–Dollar was strong. Maybe not much of a surprise as easing expectations are whittled away in the US. There was selling in FFX4 at 9534 (settled there). A cut of 25 should result in a final settle of 9536.2. SFRZ4 closed down 4 at 9559.5 and SFRH5 down 7 at 9598. The peak contract on the SOFR curve is SFRM6 at 9658.5. One month ago on Sept 24, the peak contract was the first red at 9714. So about 50 bps have oozed out of reds. Again with respect to DXY, while SFRH5 was down 7, there was a buyer of 50k ERF5 9787.5/9812.5/9837.5 c fly for 2.75 (euribor) against ERH5 9766.0s. Central banks stepping on different pedals.
–Kashkari keeps wondering if the neutral rate is higher than he thought. Logan leaned a bit hawkish and indicated there could be more volatility in funding rates. Here’s a short snippet from her speech yesterday:
At present, liquidity appears to be more than ample. Reserve balances are around $3.2 trillion, compared with around $1.7 trillion in early 2020. The economy and financial system have grown, and the dash for cash at the start of the pandemic as well as the banking stresses in March 2023 may have led banks to increase their demand for liquidity. Still, I think it’s unlikely banks’ liquidity demand has nearly doubled in half a decade.
The Fed is working toward a regime of “ample” liquidity as opposed to excess liquidity. Obviously there could be an undershoot of ample. I thought the comment that she finds it unlikely that banks’ liquidity demands could double in five years a bit odd. Go buy an Egg McMuffin. Or, look at SPX. Five years ago, it was 3000, now just shy of 6000. A lot of doubles in the past five years…
In: Eurodollar Options
Gold bugs
Oct 21, 2024
*************
–Rate futures were little changed last week. 2s, 5s, 10s and 30s were within 1.5 bps of the previous Friday’s close (at futures settlement time). On Friday, the 10y yield was -2.2 at 4.073 and the 30y was 4.38, down 1.3 bps. However, this morning, after having settled 120-08 on Friday, USZ is testing last week’s low, printing 119-18 as of this note. The previous week’s low was set Monday on the Columbus Day treasury holiday, at 119-14. Friday’s low was also 119-18. The high print of the week was 121-23. The re-test of lows suggests that level will be broken.
–While rates have been quiet, precious metals are off to the races with GCZ4 up 20 to a new high 2750 and SIZ4 up another $1 to 34.23. It was back in 2011 that silver hit $50. CLZ4 was another big mover last week, falling over $6 bbl to 68.69. Small bounce this morning, +1.24 to 69.93.
–FFX4 settled 9535 on Friday, indicating an ease of 25 at the Nov 7 FOMC, which would cause a final settle of 9536.2. On Friday, SFRH5/H6 settled at a modest new low of -62, down just 0.5 on the day (9605/9667). SFRZ4/Z5 settled -99 and SFRU4/U5 settled -131.25, so curve roll suggests more pressure on H/H. As an interesting aside, SFRH5 has sold off to where SFRZ4 was on Sept 25, when Z4 settled 9606 (there had been a block seller of 118k on that day of Z4 at 06.5). On Sept 25, SFRZ5 was 9710, so the one-yr calendar was -104 as opposed to current level of H/H at -62. (9/25, Z4=9606, Z5=9710. 10/18, H5=9605, H6=9667).
–Leading Indicators this morning expected -0.1. Lorie Logan (Dallas President, hawkish) speaks 8:55 EST.
In: Eurodollar Options
Which Consumer
October 20, 2024- Weekly Comment
***************************************
Does this make sense? I set the time period as the last twenty years, from 2004 to 2024. Covers the mortgage bubble, zirp, QE, covid, etc. In Q2 2004 Household Assets were $64.9T and Liabilities $10.5T. Currently, Q2 2024, Assets (green) are 185 and Liabilities (red) are 20.7. So assets up 3x and liabilities up 2x. Does it seem reasonable? I guess it does with an aging (old) population.

Let’s look for a second at Home Mortgage Debt Outstanding. In 2004 it was $7.86T, in 2005 $8.95T, in 2006 $9.95T and in 2007 $10.63T. Up about a trillion per year. Which would mean in 2024, 17 years later, about $27T right? Nope, it’s $13.17T. Not much higher than the GFC peak in 2007.
As an aside: Federal Debt in 2004, $5.25T and now $30.4T.
So I guess you MUST conclude, a more bigly indebted Federal Gov’t creates wealth.
Now look at HouseHold (HH) equity in real estate as a percentage of total value: It’s an astonishing level of 72.7%. The high since the 1960’s. It was higher before, but mortgages probably weren’t as prevalent or easy to get then. This is Fed data. Once again, I guess an older population owns assets outright. Everyone else can rent from Potter Blackrock. It’s Marie Antoinette type stuff.
Above all, one hideous figure grew as familiar as if it had been before the general gaze from the foundations of the world – the figure of the sharp female called La Guillotine.
Dickens knew and wrote about the Fourth Turning with a sweep of literary brilliance long before Strauss and Howe. It’s why, like so much fluff in our society, the new motto of ‘turn the page’ is a mockery of its own shallowness. But I digress…
Here’s the chart of HH, Owners’ Equity in Real Estate as a % of HH Real Estate.

The thread of this note was sparked by a post from @KobeissiLetter:
The median value of US consumers’ stock holdings spiked to $250,000 in October, the most on record.
Over the last 12 months, this amount has DOUBLED, according to the U of Mich consumer survey.
In 2010, American’s investments in single stocks, mutual funds and retirement accounts were worth just ~$50,000, or 5 times less.
Now, equities account for 48% of US households’ net worth, the highest since the 2000 Dot-Com bubble peak. This rally has truly been unprecedented. [chart below]
https://x.com/KobeissiLetter/status/1847318505743356410
When I look at the latest Z.1 report from the Fed, I see ‘HH and nonprofit corporate equities, asset’, as $33.953T as of the end of Q2 (line 15). Net Worth is around $165T. So I see the ratio of equities to net worth as 21%. HH Real Estate is $52.32T. HH Mortgages $13.17T, so about $39T in RE net worth. I am not going to quibble with Goldman and U of M, my only point is that we have a Tale of Two Consumers with respect to future economic growth:
Is it the highly indebted consumer with Credit Card and Education debt that slows things down? Or the older unlevered consumer, owning equities, t-bills and real estate that powers everything forward? My belief is that the former group is growing large enough at the margin to topple things, but I have no idea when.

What’s the limitation on Gov’t “increasing” wealth by deficit spending? It’s the interest expense on the debt. When is it too much? When the dollar loses value to alternatives: Gold and Real Estate for example. When long-dated rates start to ‘inexplicably’ rise. It feels like the end game is drawing nearer.
While I am not pulling these threads together to form a strong conclusion, I simply get the feeling that we’re closer to an inflection point.
A couple of interesting links to finish: The NY Fed is now releasing a new data set: RDE or Reserve Demand Elasticity.
https://www.newyorkfed.org/research/reserve-demand-elasticity/#interactive
The paper describing the need for this is “Tracking Reserve Ampleness is Real Time Using RDE”
“To operate in an ample reserves framework and avoid reserve scarcity, it is therefore important to identify the transition point between abundant and ample reserves.”
Basically, QT can lead to reserves NOT being abundant. And we want reserves to be “ample”. You better believe the Fed is worried about a funding hiccup with respect to rolling gargantuan debts.
And here’s link to the last BofA Participant Pulse, which has data on 401k plans and loans, hardship and otherwise:
https://business.bofa.com/content/dam/flagship/workplace-benefits/id20_0905/documents/Q2-Participant-Pulse.pdf
OTHER THOUGHTS AND TRADES
Rather than the above transitional economic themes, here are a couple of trades that went through last week which I found interesting. First, a buyer of SFRM5 9637.5/9612.5/9581.25 put tree for flat. Trade does well if the Fed stalls on easing and SFRM5 rolls lower. The only real problem comes on a hard break, but the downside breakeven of 9556.25 is actually below the current SFRZ4 price of 9563.5. SFRM5 settled 9635.5, trade worth 2 on ultimate settle there. No gain or loss > 9637

| 10/11/2024 | 10/18/2024 | chg | ||
| UST 2Y | 393.9 | 395.0 | 1.1 | |
| UST 5Y | 387.7 | 387.5 | -0.2 | |
| UST 10Y | 407.1 | 407.3 | 0.2 | |
| UST 30Y | 438.1 | 438.0 | -0.1 | |
| GERM 2Y | 223.5 | 210.8 | -12.7 | |
| GERM 10Y | 226.5 | 218.3 | -8.2 | |
| JPN 20Y | 173.4 | 174.9 | 1.5 | |
| CHINA 10Y | 214.7 | 212.3 | -2.4 | |
| SOFR Z4/Z5 | -96.5 | -99.0 | -2.5 | |
| SOFR Z5/Z6 | -2.0 | -3.0 | -1.0 | |
| SOFR Z6/Z7 | 8.0 | 7.5 | -0.5 | |
| EUR | 109.52 | 108.70 | -0.82 | |
| CRUDE (CLZ4) | 74.85 | 68.69 | -6.16 | |
| SPX | 5815.03 | 5864.67 | 49.64 | 0.9% |
| VIX | 20.46 | 18.03 | -2.43 | |
The risk of loss in trading futures and/or options is substantial and each investor and/or trader must consider whether this is a suitable investment. Past performance, whether actual or indicated by simulated historical tests of strategies, is not indicative of future results. Trading advice is based on information taken from trades and statistical services and other sources that R.J. O’Brien believes are reliable. We do not guarantee that such information is accurate or complete and it should not be relied upon as such. Trading advice reflects our good faith judgment at a specific time and is subject to change without notice. There is no guarantee that the advice we give will result in profitable trades.
Above all, one hideous figure grew as familiar as if it had been before the general gaze from the foundations of the world – the figure of the sharp female called La Guillotine.
It was the popular theme for jests, it was the best cure for headache. It infallibly prevented the hair from turning grey, it imparted a peculiar delicacy to the complexion, it was the National Razor which shaved close who kissed La Guillotine, looked through the little window and sneezed into the sack. It was the sign of the regeneration of the human race, it superseded the Cross. Models of it were worn on breasts from which the Cross was discarded, and it was bowed down to and believed in where the Cross was denied.
In: Eurodollar Options
Bonds. Monday’s weakness wasn’t an aberration
October 18, 2024
******************
–Housing Starts today. Waller speaks at 12:10 on Decentralized Finance. Kashkari at 10:00. Some have said that Kashkari’s recent remarks are concerned with excessive bond market (funding) volatility, so worth noting.
–Data stronger than expected yesterday with Retail Sales +0.4, Philly Fed 10.3 from 1.7 last and Jobless Claims 241k from 260. However, Ind Prod was -0.3. Yields rose 5-9 bps across the board, with pronounced weakness in the long end as 30s rose 9.4 bps to 4.393%. Again, this yield level is right around the midpoint of the year, but the return visit to the 119 handle (settlement was 120-00) in USZ4 was quite bearish. On Monday morning, USZ4 posted a new low of 119-14 on light volume as cash treasuries were closed. Prices rebounded into Tuesday and Wednesday (hi 121-23), but the long-end led yields higher yesterday with USZ4 low 119-30 (currently 119-29).
–ECB eased by 25 yesterday, and immediately there were projections of another 25 cut in Dec. ERZ4 settled 9707 Monday, 9715 yesterday and is printing 9719 this morning, in contrast to SFRZ4 which settled 9564 on Monday and slid to 9561.5 yesterday. EUR (ECZ4) has fallen from 1.1166 on Sept 30 to 1.0851 yesterday.
–Largest volume TY option yesterday was a buy of 30k TYZ4 106p for 3, bringing open interest in the strike to 68k. The only put with more OI is 109.5 with 106k open, settled 18 with -0.18d vs 112-015. Ignoring convexity there’s about 15.5 bps per TY point, so the 106 strike is around 94 bps otm and the 109.5 is about 39 bps out.
–GCZ4 settled at a new all-time-high 2702.50 yesterday and prints 2727 this morning.
In: Eurodollar Options
Changes
October 17, 2024
******************
–Retail Sales today expected 0.3 from 0.1, ex-auto and gas +0.3 from 0.2. Jobless Claims 260k, Ind Production -0.1 from +0.8. Philly Fed 3.0 from 1.7.
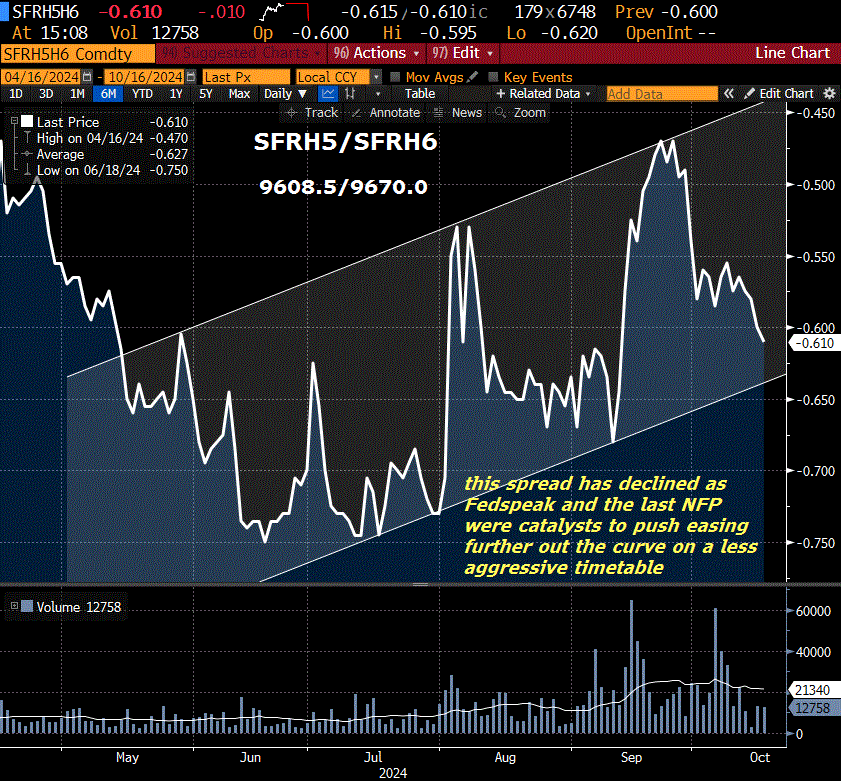
–As attached chart shows, new recent low yesterday in SFRH5/H6 at -61.5 (9608.5/9670). SFRU4/U5 is -134 (U4 continues to trade) and Z4/Z5 is -99 (9655.5/9665.5) so the roll suggests H5/H6 can continue to slide, IF nothing happens to suggest a renewed shift to aggressive easing. Of course, there’s another way the spread could rally and that’s if the back contracts sell off hard on the idea that the Fed may no longer be in an ‘easing cycle’ on a change in US administration. Druckenmiller says markets are convinced of a Trump win. Would likely change the perceived trajectory of easing. Not quite sure why treasury vol would be seeping out, but it did. TYZ4 112.5^ now 2’04 from 2’10 Tuesday.
–ECB today with a cut of 25 expected.
–Precious metals near ath. CLX anchored around 70. GCZ4 settled 2691.30. High settle has been 2694.90 on Sept 26.
In: Eurodollar Options
Round trips
October 16, 2024
*******************
–The Columbus round-trip: On Monday ESZ4 sailed, with a range of 5850.0 to 5918.50, settling 5908.25, +48.50. Tuesday’s range was almost exactly the same in reverse, testing the high early at 5915.50, with a low of 5850.0 and settle of 5962.75, -45.50. Weakness in semis was sparked by a 4-letter stock ASML, on a forecast of reduced sales. Today LVMH, another 4-letter acronym, is carrying the torch, as the luxury goods company, “…unexpectedly reported lower sales in the third quarter, primarily due to the pullback in Chinese luxury demand. It reported organic revenue of -3%, missing the BBG consensus of +0.39%” (ZH)
–Curve was flatter in the wake of Waller’s speech on Monday where he tamped down on the speed of rate reductions from the current “restrictive level”. Slight new recent low settle in SFRH5/SFRH6 at -60 (9607.5/9667.5). FFX4 is gravitating to a cut of 25. On Monday the contract settled 9533.0, but as stocks sold off, it popped up to 36.5 bid before settling at 9536. On a 25 bp cut at the Nov 7 FOMC (with a new EFFR of 4.58%) the contract should settle at 9536.2.
–Saw an interesting line from FFTT (Luke Gromen). “Incredibly, the Cayman Islands (pop 68k) is now the 5th biggest US foreign creditor in the world.”
[due to basis/ repo trades by hedge funds]
Misty echo of Bill Clinton’s famous quote in response to his economic team: “You mean to tell me that the success of my program and my re-election hinges on the Federal Reserve and a bunch of fucking bond traders?” [we might add today, “..and the robustness of the repo market”]
Here’s a link:
https://www.nbcnews.com/id/wbna8064271
The article adds: “The president-elect’s outburst captured an essential truth that he had not yet seized upon. The consuming task of his presidency would be to staunch a flow of budgetary red ink that had grown to some $290 billion a year.”
–I would note that Clinton was the only president to have ultimately run a budget surplus with an estimated surplus of $220b in FY2000. “…on track to pay off the entire debt by 2012.” Sort of fun to reminisce given today’s MONTHLY expected deficit of $61 to $70 billion.
In: Eurodollar Options
Waller’s gone soft
October 15, 2024
******************
–Waller’s speech yesterday pretty much describes no landing or a soft landing. Job market coming into better balance. Wage growth decent. but perhaps not inflationary with productivity growth as an offset. Summary:
With the labor market in rough balance, employment near its maximum level, and inflation generally running close to our target over the past several months, I want to do what I can as a policymaker to keep the economy on this path. For me, the central question is how much and how fast to reduce the target for the federal funds rate, which I believe is currently set at a restrictive level.
On the next employment report:
I will be looking for more evidence to support this outlook in the weeks and months to come. But, unfortunately, it won’t be easy to interpret the October jobs report to be released just before the next FOMC meeting. This report will most likely show a significant but temporary loss of jobs from the two recent hurricanes and the strike at Boeing. I expect these factors may reduce employment growth by more than 100,000 this month, and there may be a small effect on the unemployment rate, but I’m not sure it will be that visible. Since the jobs report will come during the usual blackout period for policymakers commenting on the economy, you won’t have any of us trying to put this low reading into perspective, though I hope others will.
Finally:
I view the totality of the data as saying monetary policy should proceed with more caution on the pace of rate cuts than was needed at the September meeting.
https://www.federalreserve.gov/newsevents/speech/waller20241014a.htm
–On Oct 10 CLX settled 75.85. This morning it’s nearing $70 bbl given headlines like this:
Netanyahu Vows He Won’t Strike Iranian Oil Or Nuclear Targets
–After trading as low yesterday morning at 119-14 (on light volume) USZ is up nearly a point this morning from yesterday’s settle of 119-25; currently 120-23.
–Here’s a snippet from the Cass Freight report. Perhaps a bit more downbeat than Waller:
Thanks to the rising spot market, truckload linehaul rates (a mix of contract and spot) saw a change in direction in September after four straight monthly declines. We saw a 0.3% m/m increase in this index. Compared to last year, linehaul rates are down more than 3%. Shipment volumes as measured by the Cass Freight Index fell 1.7% from August, after a 1.0% increase in August, and were down 5.2% y/y.
Yesterday I saw someone mention that Financial Conditions are easier now than they were before the Fed started hiking. Clearly stocks have exploded, but I have included other factors:
Dudley’s FINANCIAL CONDITIONS
For what it’s worth. Financial conditions are generally tighter now with respect to start of the hike cycle
However, long-end yields are well off their highs.
DXY marginally tighter. Again, well off highs
Stocks and BBB spread looser, but CCC marginally tighter
First hike March 16, 2022
1) Short rates.
Front SOFR contract
End 2021 9973 or 27 bps
End Mar’22 9866 or 1.34%
Now 9565 or 4.35%
tighter
1-yr t-bill
End 2021 38 bps
End Mar’22 1.61%
Oct’23 high 5.50%
Now 4.19%
tighter
2) Long rates
GT10 / 10y treasury
End 2021 1.51%
End Mar’22 2.35%
Oct’23 high 4.99%
Now 4.10%
tighter
GT30
End 2021 1.90%
End Mar’22 2.48%
Oct’23 high 5.11%
Now 4.41%
tighter
3) Value of USD
DXY
End 2021 95.67
End Mar’22 98.40
Sept’22 high 114.10
Now 103.19
tighter
4) Equities
SPX
End 2021 4779
End Mar’22 4631
Now HIGH 5815
looser
5) Corp spreads
BBB/Baa spread
End 2021 121 bps
End Mar’22 157 bps
Oct ’22 high 228 bps
Now 112 bps
looser
CCC & lower spread
End 2021 678 bps
End Mar’22 729 bps
Sept’22 high 1281 bps
Now 790 bps
tighter
In: Eurodollar Options
Just add that interest payment to principal. We good with that?
October 14, 2024
******************
–Yields eased Friday led by front end. 2y down 5 to 3.94. 10y down 2.3 to 4.07 and 30s down just 1.2 to 4.38 as sentiment shifts on the long-end. Similar with SOFR curve: reds +6.75, greens +4.5, blues +2.375 and golds only +1.5. I marked 10 year breakeven at 233.3 bps, a new recent high; inflation expectations are edging higher.
–FFX4 settled 9534.5. 25 bp cut at the Nov 7 meeting should be 9536.2 and 50 bp cut 9555.3. Meeting is Nov 7. Seven days of a 30 day month is 0.2333, so a 25 bp ease will only be worth 0.7666* 25 for the contract. 3-month SOFR compounds daily but FF contracts are a simple average of EFFR over the contract month.
–2007/8 GFC was about the household sector and mortgage/housing overextension. Now it’s the same dynamic with the US gov’t. However, FT runs this headline: Corporate Debts mount as credit funds let borrowers defer payments. “Use of payment-in-kind loan terms is growing as companies struggle with heavy leverage and high interest rates.”
PIK typically used by private creditors. Why does the futures market work? Because contracts are marked to market and cash flows transfer EVERY day. PIK is on the other end of the spectrum and can lead to cascading credit problems. As I personally know from Refco, calling an unpaid debt (which will never be paid) an “asset” can backfire. There’s been a lot of talk about borrowers having “termed out” debts. For homeowners with 30y mortgages it’s true. But for corporates, that window is now about 4 years ago. The five year roll is coming up. I’m guessing that’s part of the urgency for the Fed to lower rates. Risk a little inflation or watch already increasing bankruptcies surge? I’ll take door number 2, Bob.
In: Eurodollar Options
Really Awesome
October 13, 2024 -Weekly comment
**************************************
One of Bloomberg’s top headlines on its website Sunday is:
Retail Traders Embrace Market Turbulence With Bets on Volatility
Here’s a quote:
“We’re starting to get into unprecedented territory here,” says Akshay Aravindan, a 25-year-old software engineer at Microsoft who trades early in the morning before work starts. “This market is going to be really awesome to adjust your positions based on how intense vol gets.”
This article is about VIX and related ETFs. But I’m right with Akshay. Things are about to get “really awesome” though I might not exactly phrase it that way.
With all the new technology and AI out there, I still feel the way you really LEARN about something is by making your OWN mistakes. As Elle King sings in ‘The Let Go’, “…expensive lessons are always the best to know.”
Anyway, I worked on the CME floor ages ago for Chase. Our desk had an error, only discovered the next day. We had traded the wrong contract, something like Red Dec vs Green Dec Eurodollars. The strip at the time didn’t go past greens. In those days, it wasn’t all that uncommon to realize a problem the next day; after phone tapes had been checked, physical tickets pulled, see what cleared. No 24 hour trading; you got out next day. Of course, that morning the calendar spread was against us. It was my job to exit. So I figured I would leg out of it. Brilliant. Sold out the near contract in a weak market and hoped to buy the deferred contract cheaper. You all know what happened next. I chased the back contract up by more than a few basis points to close out. Then, I had to go upstairs and confess the larger than expected loss at the end of the day. The spread had moved such, even before I pulled the trigger on the first leg, that the near contract was printing down on the day and the deferred was positive. I explained that I hadn’t seen that before. Led to one of my rules: “Always leg from the illiquid side first.” (You were probably thinking: “Hit the bid in the SPREAD.” That’s a good one too).
I’m not mentioning this story in relation to VIX, but more as a cautionary tale with respect to interest rate and curve volatility, which I think will catch a lot of traders offsides in the upcoming several months. My themes are 1) trim position size because there are likely to be “really awesome” i.e. random moves. 2) even after the flattening post-employment and hints of a slow-play ease cycle, the curve is likely to steepen.
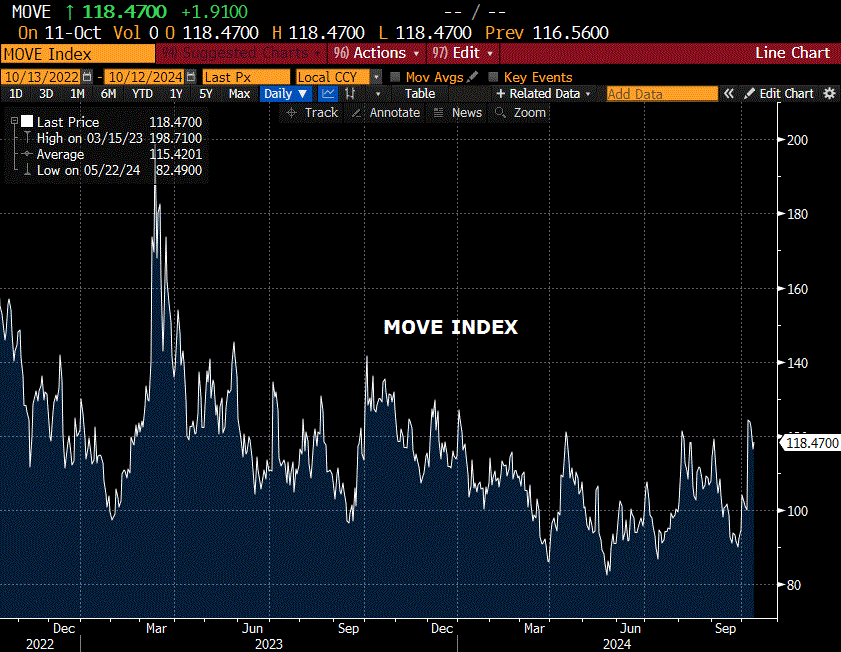
Below is the MOVE index. After Druckenmiller said he is modestly short bonds due to the fiscal situation, I thought I should post a vol chart on US, but then concluded that things could easily go haywire across the entire curve. The MOVE looks elevated, but I think there is more to come. If I recall correctly, Harley Bassman’s (MOVE inventor) loose rule is to buy at 80, sell at 120. This calendar year that’s pretty much been the range. I think risk is to the upside. [if I recall correctly, MOVE is weighted 40% 2yr and 20% each, 5, 10 and 30yr]
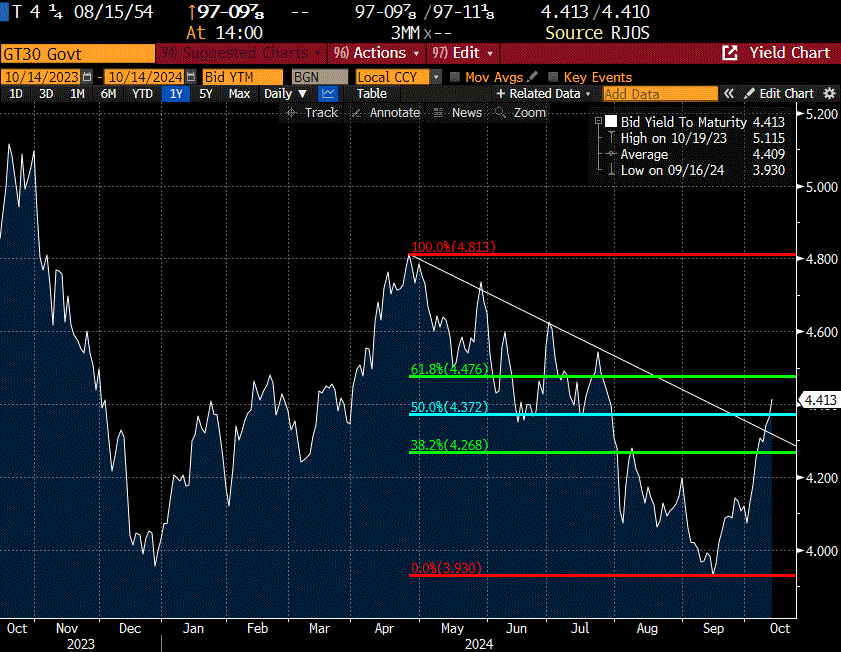
The next chart I featured last week and put out related posts on Linked-In and X. I thought the long-bond would probably chop around the midpoint of this calendar year’s range (4.37%). At futures settle on Friday I marked it at 4.38%, but the chart shows a higher yield of 4.41. (And YZ, you’ll notice that I DID include your suggested trendline that has now been broken!)
Though I favor higher long-bond yields, this isn’t so much about direction, but rather movement. Bill Fleckenstein was interviewed on the Thoughtful Money podcast and echoed Druckenmiller, saying that the relatively sharp yield increase of 50 bps in tens and bonds since the 50 bp cut at the FOMC meeting is a possible signal of a revolt. Again, he was tentative in terms of timing, but it feels to me as if sentiment has changed.
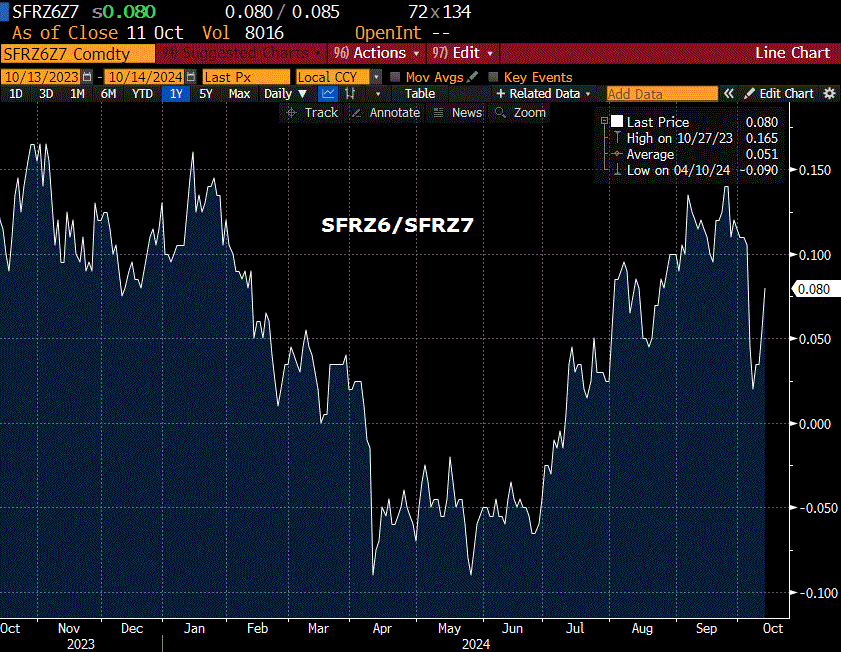
The final chart below is a SOFR calendar spread, SFRZ6/Z7. There’s nothing particularly compelling about this specific spread, but on my summary of weekly changes (shown at bottom) I always mark the first three one-year SOFR calendars. Note that Z4/Z5 was DOWN 6.5 bps from -90 to -96.5 (continued weakness in Z4 as easing projections are pared back). Z5/Z6 was DOWN 6 from +4.0 to -2.0. But Z6/Z7 was +3.5 from 4.5 to +8.0. Contracts from Z7 back are successively weaker. It’s another possible clue that market participants aren’t anxious to own longer dated paper, perhaps due to inflation concerns, but also due to fiscal irresponsibility.
Last week I highlighted the front-end puke, as stronger than expected payrolls caused reassessment of easing speed. That continued to some degree over the past week as Fed officials tamped down on easing hopes. However, despite tempered rate-cut prospects, 2/10 rallied last week (same dynamic as Z6/Z7) from 5.3 to 13.3 bps. We’ve entered an environment where specific parts of the curve respond to different macro concerns.
I’ve always liked the “Gotta hunch? Bet a bunch!” slogan. But going into the election, it’s probably best to keep risk close to home.
| 10/4/2024 | 10/11/2024 | chg | ||
| UST 2Y | 392.8 | 393.9 | 1.1 | |
| UST 5Y | 381.3 | 387.7 | 6.4 | |
| UST 10Y | 397.7 | 407.1 | 9.4 | |
| UST 30Y | 426.8 | 438.1 | 11.3 | |
| GERM 2Y | 220.3 | 223.5 | 3.2 | |
| GERM 10Y | 221.0 | 226.5 | 5.5 | |
| JPN 20Y | 165.6 | 173.4 | 7.8 | |
| CHINA 10Y | 221.0 | 214.7 | -6.3 | |
| SOFR Z4/Z5 | -90.0 | -96.5 | -6.5 | |
| SOFR Z5/Z6 | 4.0 | -2.0 | -6.0 | |
| SOFR Z6/Z7 | 4.5 | 8.0 | 3.5 | |
| EUR | 109.77 | 109.52 | -0.25 | |
| CRUDE (CLX4) | 74.38 | 75.56 | 1.18 | |
| SPX | 5751.07 | 5815.03 | 63.96 | 1.1% |
| VIX | 19.21 | 20.46 | 1.25 | |
In: Eurodollar Options
Closing out the week
October 11, 2024
*******************
–You’re not going to find this interesting, but I’m throwing it out there anyway. On Wednesday, SFRZ5 settled 9655. The October midcurve 9556.25^ settled 15.25 with two days to go (expires today). Pumped up, because of Milton and the CPI data, both of which came and went by yesterday afternoon. SFRZ5 settled up just 1.5 at 9656.5 yesterday, and the Oct midcurve straddle lost over half its value, settling at 7.25. The call settled 3.75 and the put at 3.5. Riveting tale right? But it’s not over! SFRZ5 rallied post-settle to 9661.0. So the call that settled 3.75 was in the money by 4.75. Not sure what sparked the post-settle rally; settles vs late prices are as follow: Z4 9565.5s, up to 68. Z5 9656.5s to 61, Z6 9660.5s to 64 and TYZ4 112-025s to 08.
–Vol was sucked out of the Nov treasury options as well of course. TYX4 112^ settled 1’07 Wednesday against 112-065, but just 0’61 yesterday vs 112-025. Nov expires one week from today. TYZ 112^ went from 2’17 to 2’13.
–Nothing particularly surprising about premium evaporation after large events, but underlying price movements still seem random. Of course, Atlanta Fed’s Bostic comment just before the 30yr auction sparked selling:
I’M OPEN TO NOT MOVING AT ONE OF THE LAST TWO MEETINGS IF THE DATA COMES IN AS I EXPECT -WSJ
But the auction was well received with USZ4 trading near the low of the day just above 120-00, and settled 120-06. This morning Goolsbee speaks as a counterweight to Bostic. PPI also being released, expected 0.1 m/m with Core 0.2, vs 0.2 and 0.3 last. Michigan expectations as well.
–Put buyers on SFRZ4 (both Nov and Dec) did well on this sell-off. For example, a few weeks ago there was a buyer of 80k or more SFRX4 9562.5/9550ps for 0.5. Settled yesterday at 3.5 (6.0/2.5). They’re going back to the well (though at less advantageous entry) buying over 30k SFRF5 9575/9562.5ps for 2.5 to 2.75, settled 7.25, 4.5 ref SFRH5 9604.5.
–It seems as if the idea of fiscal austerity is creeping in… I think (forced) austerity will be a 2025 theme in the US.
From MNI:
-Gilts Risk Buyer Strike If Borrowing Surges, Citi Economist Says…UK 10-Year Real Yields Headed for 11-Month High…gilts risk a “buyers’ strike” if fiscal rules are relaxed too far to borrow tens of billions for investment…IFS says Reeves has to raise taxes by £25b at the budget Spending has to increase by £30b to avoid austerity
(see also George Austin of PricingMonkey https://www.linkedin.com/posts/george-austin-a9725b72_uk-giltsthere-has-been-much-talk-in-the-activity-7249390365022052352-Y1z1?utm_source=share&utm_medium=member_desktop
For more on inflation see Michael Ashton’s summary (snippet below on college tuition, emphasis added).
But it wasn’t just transportation goods and services, either. This is the time of year when the jump in college tuitions happens. And it looks like the jump in tuitions this year is the largest since 2018. The seasonally-adjusted numbers will smooth this out, but that means tuition is going to be adding a little more over the next 12 months than it added over the last 12 months.
This is also somewhat surprising. Normally, when asset markets are going gangbusters we tend to see smaller increases in tuition because endowments are doing well and the financial model for colleges is basically (exogenous cost increases we don’t really try to control, minus endowment contributions or federal support, divided by number of students). If markets are doing well and college tuitions are still accelerating, it implies an increase in costs. My guess is that insurance is part of that, but so will be teachers’ salaries. Provision of education is ‘labor intensive,’ and wages continue to refuse to slip back down to the old levels.
https://inflationguy.blog/2024/10/10/inflation-guys-cpi-summary-september-2024/
In: Eurodollar Options

