SOFR pricing
March 23, 2025 – Weekly Comment
************************************
Peak contracts on the SOFR strip have been in the 6th and 7th slots, what I would refer to as the middle reds. Current peak is SFRU6, 2nd red, sixth slot, which settled 9654 or 3.46%. Despite increased measures of inflation expectations, both from surveys and from the Fed’s own SEP, Summary of Economic Projections, SFRU6 settled only 2.5 bps lower than its high on 10-March of 9656.5. (Fed’s Core PCE price estimate for end-of-2025 was raised from 2.5% in December to 2.8% in last week’s SEP). On February 18, just over one month ago, SFRU6 settled 9603, so the yield is down 50 bps in a month. The market doesn’t seem to be embracing the idea of a sustained increase in inflation. The current EFFR (Fed Effective Rate) is 4.33%, so SFRU6 yield is 87 bps lower.
Below is the red/gold pack spread. It’s nearing the high made in September just before the initial 50 bp Fed cut from 5.25-5.5% to 4.75-5%.
Let’s take a look at pricing going into the Fed’s initial ease in September. We can see that the red/gold pack spread rallied through Q3 2024 as easing expectations grew. The unraveling of the spread after the initial 50bp cut (late Sept thru November) was sparked by fears that inflation might be re-kindled by the oversized move. (It was). SFRH6, the second red at the time, sold off from 9720 to 9610 on Nov 12. SFRU6 followed the same script, 9720.5 high settle on 10-Sept, to 9614.5 on 12-Nov.
Let’s review the Survey of Economic Projections from the September 2024 meeting, focusing specifically on the 2025 predictions.
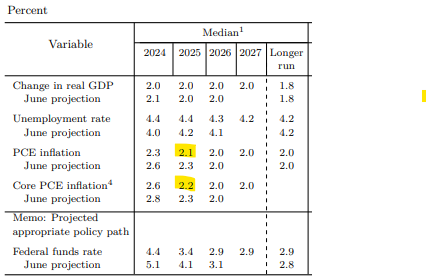
In September, the second red, which was SFRH6 at the time, had traded up to 9720 just before the FOMC. At the time, the Fed ratcheted DOWN inflation estimates from 2.3% for PCE prices and Core, to 2.1 and 2.2 (yellow highlight). So 2.8% in second red futures price vs 2.1 for inflation, a spread of around 60 to 70 bps. Low given estimates for the neutral rate.
But we’re in a similar place now. 2.7 to 2.8 for inflation estimate vs second red of 3.50%, a spread of 70 to 80 bps.
My view is that the Fed is likely overshooting the inflation estimates for end-of-2025, just as they undershot in September. We’ll probably end up somewhere in the middle, 2.3 to 2.5.
In early September, FF midpoint was 5.375%, and the second red had traded to 2.80%, over 250 bps lower. Currently, from a 4.375% midpoint, the second red yield is about 3.5%, or 90 bps lower.
My conclusion, to paraphrase Powell’s description of the economy and policy, is that we’re in a pretty good place in terms of the price/yield levels for red SOFR contracts. My thought is that inflation estimates are currently too high, so there’s probably room on the upside for reds, but overall pricing makes sense.
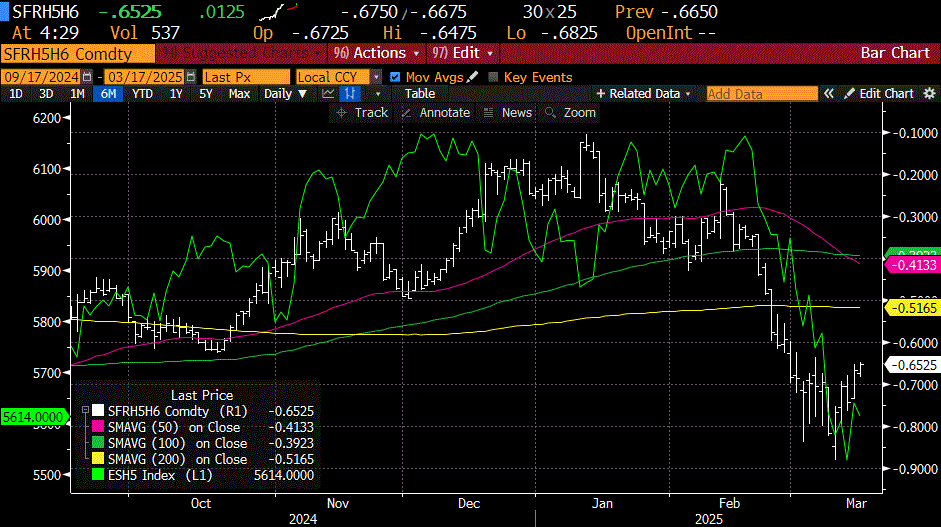
Expanding a bit further, the chart below is ESM5 in white, with an overly of SFRU5/SFRU6/SFRU7 butterfly in green. The fly is (SFRU5 – SFRU6) – (SFRU6 – SFRU7). As SFRU6 rallies more than the wing contracts, the fly declines in price. In the last couple of months, S&Ps and the fly have tracked closely. But in the past few sessions, stocks bounced while U5U6U7 made new lows.
So what? There are a lot of correlated markets that have nothing to say about causation. (Though it appears that the fly has been the leader). I would simply summarize, ‘stocks selling off in a financialized economy means that reds rally hardest.’ It’s not all that obvious in terms of constructing new trades given moves that have already been significant.
My interpretation of the fly is that the Fed’s ‘inertia’ concerning near-term rate cuts is due to tariff-related inflation fears. SOFR contracts one year forward (reds) are sniffing out economic weakness, accentuated by falling asset values. Beyond the reds, an increase in term premia could result from a weaker economy where budget deficits worsen due to lower tax receipts and higher gov’t benefits, for example, higher unemployment payments.
An interesting quote from Luke Gromen’s Forest for the Trees that someone passed along to me:
“The time for delicate talk is over, so we will be blunt: You cannot “detox” the US economy when debt/GDP is 120%, deficits/GDP are 7%, and “True Interest Expense” is 108% of all-time high receipts, all of which are dependent on ever-rising asset prices to prevent a decline in consumer spending and US Federal receipts.”
| 3/14/2025 | 3/21/2025 | chg | ||
| UST 2Y | 401.7 | 394.6 | -7.1 | wi 392.5 |
| UST 5Y | 408.4 | 400.8 | -7.6 | wi 401.4 |
| UST 10Y | 431.0 | 424.8 | -6.2 | |
| UST 30Y | 461.5 | 459.2 | -2.3 | |
| GERM 2Y | 218.7 | 213.2 | -5.5 | |
| GERM 10Y | 287.4 | 276.5 | -10.9 | |
| JPN 20Y | 226.4 | 226.2 | -0.2 | |
| CHINA 10Y | 185.1 | 185.2 | 0.1 | |
| SOFR M5/M6 | -47.5 | -59.5 | -12.0 | |
| SOFR M6/M7 | 4.0 | 5.0 | 1.0 | |
| SOFR M7/M8 | 12.5 | 14.0 | 1.5 | |
| EUR | 108.79 | 108.22 | -0.57 | |
| CRUDE (CLK5) | 66.91 | 68.28 | 1.37 | |
| SPX | 5638.94 | 5667.56 | 28.62 | 0.5% |
| VIX | 21.77 | 19.28 | -2.49 | |
| MOVE | 101.01 | 94.54 | -6.47 | |
Bonds tentatively embrace the QT reduction
March 21, 2025
****************
–Yields slightly lower yesterday with 2s, 5s and 10s down around 2.5 bps to 3.853%, 4.005% and 4.231%. Same on the SOFR strip with all contracts in the first 4 years up 2 to 3.5. Peak contract remains SFRU6 at 9652 (3.48%).
–Sev’l large treasury option trades. Pre-open exit seller of 50k FVJ 108.0c at 7 (April expires today, FVM5 settled 108-005). During the day replacement buys of 50k FVK 110c for 6.5 early, then up to 8 for another 50k. DV01 is approx $44 on the contract, 2 points out of the money, call it 45 bps away for the 110 strike. Somewhere around 3.55% on current 5y (DV01 is $44.4 per $100k). Other decent size buys in TY calls as well, for example TYK 112.5c 31 paid vs 111-14. Open interest up 19k, settled 25 ref 111-055. Total OI in FV futures +11k and in TY +53k.
–There has been a decent move in Accenture (ACN). On February 5, high of 398.25. Yesterday slammed and closed 300.91. So that’s right around an even 25% loss in a month-and-a-half. No big deal…it’s just a single company, but what I found interesting is that they blamed a slowdown in Gov’t work. …”federal services accounted for about 8% of its global revenue and about 16% of its Americas revenue in the 2024 fiscal year.”
According to Google: “In 2024, federal government spending was approximately 23.1%
of the Gross Domestic Product (GDP), while federal receipts (revenue) were around 16.8% of GDP.
–If one company, where the revenue derived from gov’t isn’t even near the Fed govt share of GDP, can be hammered, how about everyone else? Btw FedEx also crushed post-earnings, down 8% to a new low this morning. Big quarterly OpEx today in stocks.
https://blinks.bloomberg.com/news/stories/STFF5HT0G1KW
This link is for the Treasury General Account. Mentioned several times by Powell at press conference in terms of liquidity impact.
https://fred.stlouisfed.org/series/WTREGEN
Balance sheet change equals ease?
March 20, 2025
*****************
–I was wrong about my SEP predictions yesterday. And wrong about how stocks would react if inflation estimates were raised. Powell said “a good part” of the increase in inflation estimates were due to tariffs. Here are the last three quarters of SEP:
(End-of-2025 estimates)
SEPT DEC MARCH
PCE Inflation 2.1 2.5% 2.7%
Core PCE Infl 2.1 2.5% 2.8%
Fed Funds 3.4 3.9% 3.9%
GDP 2.0 2.1% 1.7%
Fed estimates of inflation keep rising, while GDP is penciled in lower. What we have here is both STAG and FLATION. Again, I thought this scenario would be stock market negative, but the reduction in QT won the day. Treasury holdings on the Fed’s balance sheet will decrease by only $5 billion/month from $25b previously, while MBS (currently about 1/3rd of holdings) will continue to roll off at $35b per month.
–Powell said the reduction in QT has absolutely no bearing on policy, but if that’s the case, why did Waller dissent? The market cheered the net increase in liquidity, with stocks firmer going into tomorrow’s OpEx. The dots weren’t the focus. The balance sheet was.
–I had thought the Fed would move to three cuts this year rather than two, but the estimate for FF’s remained at 3.9% (range of 3.75-4.0% vs 4.25-4.5% now). Current Fed Effective is 4.33% so a cut of 50 would mean 3.83% or a price of 9617. SFRZ5 settled 9629.5, up 6.5 on the day. January 2026 FF settled 9632 or 3.68%, up 6 on the day. Not all that far from the dots, with just a bit more premium priced in for a potential shock that might force more Fed easing than planned. Peak contract remains SFRU6 at a price of 9649.5, up 8 on the day, essentially 3.5%.
–Post-Fed, Stephanie Pomboy was on Finance Unfiltered (Jim Iuorio and Bob Iaccino podcast) and she mentioned that not only had the Federal Gov’t ramped up spending and hiring, but that state and local gov’ts also greatly benefited from the fed’l fiscal gravy train, However, these governmental entities are bound by balanced budgets. She predicts a harsh retrenchment that hasn’t hit yet.
–I’m on the same page as Pomboy, or probably more negative on near-term growth. Uncertainty is filtering into data. Dining out numbers are down, delinquencies are up, confidence regarding jobs is sliding. My guess is that the Fed will be caught off-guard and have to ease sooner than later. At this particular moment, the market is leaning the same way: 2y yield fell 6 bps yesterday to 3.979% and tens fell only 2.1 to 4.258%. Several near SOFR calendars made new lows, for example, SFRM5/M6 one-yr fell 7 bps to -59.5 (9588, +1.0 & 9647.5, +8.0).
–Today’s news includes Jobless Claims expected 224k and Philly Fed expected 9.0 from 18.1 last.
Fed Summary
https://www.federalreserve.gov/monetarypolicy/files/fomcprojtabl20250319.pdf
“I was wrong”
Dots are rarely right, but they make markets move
March 19, 2025
****************
–Front SOFR contracts continue to trade heavy in front of today’s FOMC, with SFRM5 and U5 both settling -1.5 at 9587 and 9608, even as every contract one year out and further closed positive on the day. The red SOFR pack (2nd year) +2.75. Greens (3rd) +3.875. Two-yr treasury yield -1.2 bps at 4.038% and tens down 2.3 bps at 4.279%. At 9587, SFRM5 is just 20 bps lower in yield than EFFR (4.33%). The market is paring back ease expectations, according to BBG.
–BBG’s Anna Wong writes this:
Fed staff views on the impact of tariffs have evolved since 2018. During the first Trump administration, staff believed tariffs on intermediate goods – the majority of US imports – would be deflationary. New research shows Fed staff now believe tariffs on intermediate goods will have a persistent inflationary impact on the PCE deflator.
The latest research implies Fed staff could boost their PCE inflation outlook by about 0.5 percentage point for this year, and 0.2 ppt for both 2026 and 2027, at this meeting or a later one.
–Today, we get a fresh round of Fed dots. The clip above tends to dovetail with surveys on inflation expectations which have recently jumped. However, market measures aren’t saying the same thing, with the ten-year breakeven at a recent low of 230 bps. Here’s how the Fed’s estimates changed from September to December (the last SEP). Inflation estimates for end-of-2025 were marked higher, and so was the FF target.
(End-of-2025)
PCE Inflation 2.1 to 2.5%
Core PCE Infl 2.1 to 2.5%
Fed Funds 3.4 to 3.9%
GDP 2.0 to 2.1%
The inflation dots will, in my opinion, either remain the same or come down by 1 tenth. I am not buying into Anna Wong’s piece.
The FF estimate will likely reflect one more ease, from 3.9% (a target of 3.75-4%) to 3.6% (a target of 3.5 to 3.75%).
GDP will likely be revised lower. Atlanta Fed’s GDP Now for Q1 is currently -1.8%. We’re nearly at the end of Q1, and Atlanta is pretty accurate.
–I haven’t read other analyses of the dot plot. It seems to me that if the Fed wants to reassure the market that inflation (and expectations) are not going up, then inflation estimates will definitely not go up (as Anna Wong’s piece suggests). It’s my belief that the Fed is now shifting emphasis to jobs rather than inflation. If we were to get inflation projections to 2.4% and FF 3.625% middle, it would imply neutral at 1.25%. Low in my opinion, but not completely out of the ballpark. If inflation estimates go UP by a few tenths, an already vulnerable stock market will NOT like it. There are a lot of anecdotal reports about economic deterioration, like this from @Barchart yesterday:
“42% of mortgage refinance applications are being rejected, the highest rate in AT LEAST the last 12 years”
–There was a flurry of TY vol buying midday, which suggests to me that vols will hold here:
TYM5 108.0/113.0 strangle vs 110-19 with 5 delta, 45 paid for 9k (settled 46, 30c and 16p vs 110-255)
TYM5 107.5/113.5 strangle vs 110-185 with 5d, 35 paid 15k (settled 36, 24c and 12p)
TYK5 112c 25 paid vs 110-18, 28d for 5k.
All appear new. Perhaps a hedge for unexpected geopol events.
Front end pressure
March 18, 2025
*****************
–Retail sales a bit soft yesterday and Empire State Mfg sank to -20.0 vs -1.9 expected, but front end yields pushed higher. Two-yr up 3.3 bps to 4.05%, while tens were nearly unch’d, with the yield down less than 1 bp to 4.302%. TYM5 settled down 1/32 at 110-19+, while USM5 was +7/32 to 116-31. On the SOFR strip, SFRU5 weakest, -5.0 to 9609.5, U6 -2.5 to 9639.0 (peak contract), U7 -1.5 to 9632.5 and U8 -0.5 to 9620.5.
–Geopolitical issues dominate. Israel/Hamas truce crumbled, with Israel striking, fearing an imminent ground invasion. German spending vote at 2:30 Berlin time (9:30 NY). EUR continues to press higher, from sub-104 at the start of March to 1.0947 currently. Trump/Putin call later today.
–There was a blurb on FT about the Indonesian market getting crushed. Symbol on BBG is JCI (Jakarta Composite). This market has been in a downtrend since Q4, and spiked to a new low today. Cautionary note is that there have been a series of countertrend rallies, each followed by a sharp break to new lows. Today’s was especially vicious, more than 7% drop to today’s low from yesterday’s close.
–NVDA’s GTC (AI) conference today will feature a presentation by Jensen Huang.
–FFK5 settled 9572. A 25 bp cut at the May 7 FOMC, which I expect, would lead to a settle near 9586.5, while no change would be 9567 (at the current EFFR of 4.33%).
–From the NY Fed’s Survey of Conditions:
The share of discouraged borrowers, defined as respondents reporting that they did not apply for any credit because they did not think they would get approved (despite reporting a need for credit), reached 8.5 percent, the highest level since the start of the survey in October 2013.
If you’re long gold, you’re in a deflating world
March 17, 2025
*****************
–Front end hit Friday as U of Mich inflation expectations showed an unexpected jump. At the end of 2024, year-ahead expectations were just 2.6%, low of the cycle. Just four months later 4.9% (vs 4.3 estimate), nearing the high of 2022 which was 5.4%. Market measures like breakevens (treasury vs inflation-indexed yields) are still near recent lows, for example, on Friday I marked the 10y at 2.31%. Which will ultimately be more accurate? I would favor market measures, but clearly the cost of living is up. In any case, the two-year yield on Friday rose 6.8 bps to 4.017%. Weakest SOFR contracts were H26 and M26, both -8.5 at 9636.6 and 96405. 10y yield up just 3.4 bps to 4.31%. Curve flattened.
–March SOFR options rolled off on Friday, so I am using June’25 as front month (first slot). While SFRH5/H6 was -66 on Friday, SFRM5/M6 one-yr calendar is -47.5 (9593/9641.5). Red SOFR contracts are all around 3.6%. So while EFFR at 4.33% and 10y yield at 4.31% are nearly equal, forward contracts indicate positive carry. Gundlach often says the Fed follows the 2y yield. The FOMC announcement and press conference is Wednesday, and no change in rates is expected, but clearly the market is pricing forward eases. Current EFFR is 4.33% and SFRM5 at 9593.0 of 4.07% is almost exactly one-quarter percent lower.
–Over the weekend, the US bombed Houthi targets in Yemen, sending a message that shipping disruptions won’t be tolerated. Additionally, Bessent was interviewed and said he’s unconcerned about the stock market pullback and that he can’t guarantee the US won’t go into recession. He cited emergency type gov’t stimulus from which the economy must be weaned. As of this writing stocks have retreated from Friday’s rally, and oil is higher. I’ve attached a chart of oil priced in gold, and there’s outright DE-flation when measured that way….
–The sharp drop in SPX is mirrored by the plunge in SFRH5/H6 calendar, as shown on the chart below. Gov’t largesse has supported stocks, higher stocks support the economy. When those two reverse, forward SOFR contracts rally as the market prices in compensating Fed cuts. (ESH5 in green, SFRH5-SFRH6 in white).
Canary
March 16, 2025 -Weekly Comment
*************************************

The inset is a painting ‘The Goldfinch’ by Carel Fabritius in 1654. It features in the 2013 Donna Tartt Pulitzer Prize winning novel of the same name. In the book, the young protagonist Theo Decker is at New York’s Metropolitan Museum of Art with his mother when a bomb explodes. His mother is killed. In the rubble he takes the painting. Throughout his youth to early adulthood, he conceals the artwork, but it is stolen from him by a friend involved with nefarious associates. From a summary, “…the painting has since been used as collateral by criminals and drug dealers.”
It’s not a canary. But for the purposes of this note, it might as well be.
An article in the Financial Times last week reports that lenders are issuing margin calls to borrowers who have used fine art as collateral for loans, as the value of art has declined. The article estimates the total amount of the market at around $40 billion, secured by art worth perhaps double that. Collectors sometimes borrow to create liquidity. Obviously, this is a tiny sliver of global markets. However, the same dynamics run through the world’s financial system. It gives some degree of pause when Bessent talks about monetizing the Federal Gov’t balance sheet…
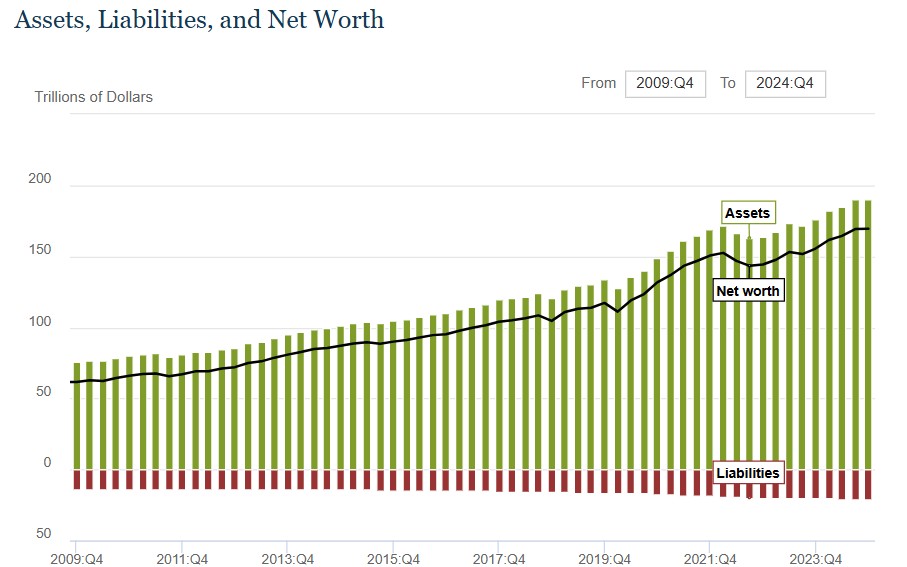
When one looks at total Household Sector net worth (published by the Fed last week, quarterly report, chart below) it reveals current NW of $169T: Assets 190t and liabilities 20.8t. Staggering growth since Q1 2020, when Assets were 128t, Liabilities $16.6t and NW $111t. Net worth has exploded by about 45% in nearly 5 years, in the amount of $58t. I listened to a recent Thoughtful Money podcast with Cem Karsan, and he refers to this increase as an increase in ‘collateral’. But the numbers don’t really bear that out. Household liabilities aren’t increasing anywhere near the same rate. Except for one borrower of course. Uncle Sam.
The same Z.1 Fed report shows Federal Gov’t Debt at $19.5t in Q1 2020 vs $31.6t in Q4 2024, an increase of 62%. Maybe that’s a fabulous multiplier. Increase Fed’l debt by $12.1t to get over 4x that in HH net worth. (Total Business debt from $18.69t to $21.55, up 15%).
Of course, it comes at a price when one steals from or borrows against the future. Five years from the depth of covid is a good time to reflect. For example, the Fed’s five-year policy review will be released in August. Last time it resulted in the ill-fated FAIT (Flexible Avg Inflation Targeting).
In March of 2020 the five-year note yield was at the then historic low of around 40 bps. By August it had reached the all-time low of 19 bps, right at the time of FAIT. The all-time low in tens, also in August, was 51 bps. We’re right around the five-year anniversary. So, if a corporate had ‘termed-out’ all debt at the 40 bp low in March 2020, it’s now running about 3.75% higher. Obviously, corporate finance is a dynamic process, and everyone knows rates soared. The point is that it can take a fairly long period for pressures to build. Of course, changes can also be rapid, as evidenced by last week’s plunge in Consumer Sentiment which printed 57.9, lowest since late 2022 and down from 74 at year’s end. (Conference Board’s Consumer Confidence data reflects a similar drop). One brief note, in late 2022 when confidence measures were floundering as the Fed hiked, stocks were selling off. SPX ultimately bottomed at 3491, which was a 50% retracement of the covid low of 2192 to the start of 2022 high at 4819. If SPX had a similar 50% pullback from the 2022 low to this year’s high, it would be 4813 (current 5639).
Retail Sales are released Monday. Many anecdotal reports (WSJ article, ‘Consumers and Businesses Send Distress Signal as Econ Fear Sets In’) support the idea of lessened confidence. Retail shares have been hammered. XRT (the retailer ETF) is off 17.3% since the end of January. We’ll see if Retail Sales data can hold.
The big event of the week is the FOMC press conference on Wednesday. No change in rates is expected, but I think Powell will set the stage for a May 7 cut. As I mentioned last week, the Fed has subtly indicated that the labor mandate is now more important than inflation. While the U of Mich Inflation expectations data soared in last week’s release (1y was 4.3 last and expected, actual 4.9%) the 5 and 10 year breakevens are at the lows for this calendar year. 5y is 2.53% and 10y is 2.31%. The next PCE price data is 28-March. Also likely is some discussion (announcement?) regarding the end of QT.
I enjoyed reading The Goldfinch, though some critics panned it. Everything turned out in the end. It will this time too. Eventually.
OTHER THOUGHTS, TRADES
Implied vol was pressured in treasuries, especially near the end of the week. MOVE index went from 104.41 to 101.01. On Friday, March 7, TYM5 settled 110-185 and TYM 110.5^ settled 2’39. On Friday, TYM5 settled 110-205 and TYM 110.5^ settled 2’29.
On Wednesday, BBG reported that ‘Brevan Howard Slashes Trader’s Risk-Taking as Losses Exceed 5%’. I have to believe that some large positions have been recently jettisoned across markets. For example, the pop in TY following lower than expected CPI was immediately rejected. On the week, treasury yields showed little net change (table below), even as gold posted a new all-time high, ending the week at 2985 (GCJ5 3301.10s).
The lowest quarterly SOFR contract is SFRM5, now the first quarterly slot, which settled 9593.0 from 9596.5 the previous Friday. The peak contract is SFRU6 at 9641.5, down just 1 bp on the week. Near contracts were sold on higher than expected inflation expectations, but again, net changes were small.
I believe Powell will signal a May cut (dependent on inflation data). The meeting is May 7. By early June I think another cut will be priced with near certainty for the June 18 FOMC.
| 3/7/2025 | 3/14/2025 | chg | ||
| UST 2Y | 400.0 | 401.7 | 1.7 | |
| UST 5Y | 409.4 | 408.4 | -1.0 | |
| UST 10Y | 432.2 | 431.0 | -1.2 | |
| UST 30Y | 461.7 | 461.5 | -0.2 | |
| GERM 2Y | 224.7 | 218.7 | -6.0 | |
| GERM 10Y | 283.6 | 287.4 | 3.8 | |
| JPN 20Y | 223.1 | 226.4 | 3.3 | |
| CHINA 10Y | 184.5 | 185.1 | 0.6 | |
| SOFR M5/M6 | -46.5 | -47.5 | -1.0 | |
| SOFR M6/M7 | 9.5 | 4.0 | -5.5 | |
| SOFR M7/M8 | 12.5 | 12.5 | 0.0 | |
| EUR | 108.34 | 108.79 | 0.45 | |
| CRUDE (CLK5) | 66.75 | 66.91 | 0.16 | |
| SPX | 5770.20 | 5638.94 | -131.26 | -2.3% |
| VIX | 23.37 | 21.77 | -1.60 | |
| MOVE | 104.41 | 101.01 | -3.40 | |
https://x.com/ftfinancenews/status/1900600512602398825
Collectors reluctant to sell at low prices used art-backed loans as “a way to create liquidity out of something that’s just sitting there”, said Nishi Somaiya, global head of private banking, lending and deposits at Goldman Sachs.
When credit turns
March 14, 2025
****************
–New all-time high in gold yesterday and this morning GCJ5 is up over $17/oz just above 3008. GCJ5 settled 2991.30, +44.50. This, despite Schumer’s reversal, which for now, averts the chances of a government shutdown.
–Yields fell yesterday as equities continued to decline (SPX -1.4%). Tens down 3.4 bps to 4.276%. Ten-yr has been holding right around the Fed Effective rate of 4.33%. The 2y fell 4.6 bps to 3.95%. Ten year breakeven notched a slight new low at 231 bps. Today, U of Mich releases inflation expectations with 1-yr at 4.3%, same as last, and 5-10yr expected 3.4% from 3.5% last.
–Not much to report with respect to SOFR contracts. SFRZ4 to SFRZ8 rose 4 to 5.5 bps. All contracts in the two years from Z5 to Z7 are between 9636 (Z5) and 9649.5 (U6), consistent with a forward FF range of 3.5 to 3.75%. Current is 4.25 to 4.5%. March SOFR options expire today.
–Fed’s Z.1 report showed Household net worth rose $164 billion in Q4. In Q3 it was up $4.8 trillion! Q1 not looking good…
–A couple of weeks ago I noted some decent size open interest in puts on HYG, a high-yield etf. From the chart below, probably would have been better on JNK as that has broken down more decisively. One of the ‘financial conditions’ parameters reviewed by the Fed is credit spreads. While still low, these spreads have perked up a bit. It seems to me that the growth in private credit came after the regional bank meltdown in 2023. Silicon Valley Bank failed almost exactly two years ago. I don’t know a lot about the regional banking crisis, but I wouldn’t characterize the problem as bad loans, but perhaps loans provided too cheaply, as if the low rate regime would last forever. Depositors pulled funding like a rug, and it was game-over. Private credit and equity investing is supposedly a way to juice returns, but in this case I don’t think the funding can easily be pulled, nor do I think it’s appropriately marked-to-market. It can, however, completely dry up. Slower deterioration.
Weaker than expected CPI provides no comfort for bonds
March 13, 2025
****************
–CPI was a little better than expected with monthly readings of 0.2 both headline and Core. Headline yoy was 2.8 vs expected 3.0 and 3.1 on Core vs 3.2. PPI today.
–However, bonds traded weaker on the day, partially due to continued supply. Ten year auction went well with a yield of 4.31%. Overall yields ended higher with tens up 2.4 bps and 30s up 2.6 at 4.626%. 30 year auction size today is $22b.
–Front end was weakest part of the market with 2y +5.8 to 3.995%. On the SOFR strip SFRZ5, H6 and M6 were all -7 at 9632, 9640.5 and 9644.0. With just a week to go until FOMC, March is priced for steady policy. while the May 7 meeting is priced at odds of about 36% for a 25 bp cut (FFK5 settled 9573). They’re going to cut at the May meeting in my opinion.
–Stocks a bit lower as of this writing as Schumer closed the door on a continuing resolution to keep the gov’t open. Budget deficit released yesterday was $307 billion for month of February and record $1.15 trillion for the first 5 months of the fiscal year. A $300 billion/month deficit at 4% adds $1 billion per month to the interest rate bill. April Gold is 2956 this morning, up 9.2 and threatening last month’s highs. Retailers continue to trade poorly, after making new highs in Feb, WMT is down 19%, COST is down 14% and TGT, which has been in a prolonged slide is 24% off the high made in Feb.
–Implied vol hammered in rate futures as CPI provided little drama. As an example, TYJ 111^ settled 1’12 Tuesday, with TYM 111^ at 2’44. Yesterday: TYJ 110.75^ 0’59 and TYM 110.5^ 2’33.
SFRH5 opts rolling off Friday. Where will SFRM5 be on 13-June opt expiration
March 12, 2025
****************
–Despite equity market volatility yields rose yesterday with tens up 7.5 bps to 4.286%. Today brings CPI and 10-yr auction of $39b. CPI expected 0.3 headline and Core with yoy 2.9 (from 3.0) and Core 3.2 (3.3). In February, the ten-yr breakeven (10y yld minus inflation-indexed 10y) hit a high of 247 bps. Now it’s 232. The low in 2024 came close to the Fed’s target at 203. My guess is that it will settle in around 220-225. The US market does not fear inflation. Even if crude oil bounces back near 70, it will be below year-ago levels.
–Ten-yr German bund yield is 2.90 this morning, closing in on the high-water mark of 2.97 in 2023. Since November the bund yield has surged nearly 90 bps.
–(Fortune) Goldman’s GDP projection for 2025 now sits at 1.7%, down from 2.4% at the start of the year. [below consensus]
“Instead, the reason for the downgrade is that our trade policy assumptions have become considerably more adverse, and the administration is managing expectations towards tariff-induced near-term economic weakness,” [Jan Hatzius] wrote Tuesday in a note to clients.
–March quarterly SOFR and midcurves expire Friday. SFRH5 settled 9571 yesterday or 4.29% against EFFR of 4.33%. SFRH6 settled 9647.5 for a spread of -76.5. With March rolling off, it’s worth looking at where M5 will ultimately settle.
–My base case is that the Fed cuts 25 at both the May and June meetings. SFRM5 options settle 13-June, FOMC is 18-June. The advance GDP report for Q1 comes out April 30, and it’s likely to be negative. Data probably isn’t capturing the extent of government cuts. Current EFFR is 4.33 and SOFRRATE is 4.33 to 4.37. A cut of 50 by June is 3.83 in EFFR. Next meeting is July 30, and will likely price some odds of another ease. SFRM5 settled 9599 yesterday. My peg for final settle is 9620 to 9623 (3.80 to 3.77). This is NOT a recommendation, but SFRM5 9600/9625/9643.75 broken call fly settled 3.5. Even if the contract were to settle above the top strike, fly would settle 6.25. so there would be a little profit.

