
Hit by a Ukulele
June 7, 2026 – Weekly comment
**************************
FREMONT, CA — Police say they’re investigating a bizarre road rage incident in Fremont that ended with one person hitting the other over the head with an otherwise peaceful musical instrument on Monday. (Fark.com)
In the comments section:
Your chances of being hit with a ukulele are always small, but never zero
VIX jumped from 15.32 to 21.51 this week as stocks tumbled Friday. NQM6 fell 5.6% from Thursday’s settle to Friday’s late day low (30488 to 28781), essentially wiping out the past month’s worth of gains. (Friday, May 8 settle was 29332.5 and Friday June 5 was 29026.50).
Consider this, consider this
The hint of the century
Consider this, the slip
That brought me to my knees, failed
What if all these fantasies come flailing around?
Now I’ve said too much
–REM- Losing My Religion
I had thought the instrument in Losing My Religion was a ukulele, but of course it’s not, it’s a mandolin (equally useful in road rage incidents) peacefully played by Peter Buck.
Below is a cover of Losing My Religion, with ukuleles!
The question before us is whether the flailing religion of AI and datacenters will bring the equity market, and by extension the economy, to its knees. [the dip that brought me to my knees, failed] SOX semi index was down 12.2% from Wednesday to Friday. Micron MU was down 20% over the same two sessions. Of course, these declines are barely a blip given the scorching rally in April-May. But META’s announcement that it’s looking to raise tens of billions in a new equity raise (FT) isn’t likely to help. META -5.5% Friday. Perhaps the odds of this being the start of a big bear market are small, but not zero.
As a scenario, consider this: In Jan 2008 WTI popped to 80. Now it’s around 95. By next April, there’s a strong possibility that oil will be flat to negative yoy. I.e., no inflation. The professionals are saying that dangerously low inventories will cause a spike in oil to $150 or higher. My thought is that Americans won’t accept $7/gallon gasoline. The political pressure will be severe, and may cause a more rapid opening of Hormuz, one way or another. At the same time, what if the AI capex bubble pops? Catalysts could be short term energy prices or a myriad of other factors. For example, Warsh tamping down on the Fed’s balance sheet to assuage the hawks? The wealth effect has supported the US economy and consumption. Will there be demand destruction due to lower asset prices as oil inflation goes into reverse next year? Is that part of the reason the admin is looking at taking positions in AI companies?
The catalyst for Friday’s market action was a much stronger than expected employment report, which showed a gain of 172k jobs, with April also revised higher, from 115k to 179k.
Of course, there ARE some problems. From @TheTinMenBlog on X:
This is staggering – Of the 369,000 jobs the U.S. Labor Dept. says were created since last year, nearly all – 348,000 of them – went to women, and only 21,000 went to men. Basically, that means 94% of the net employment growth in the U.S. went to women. Ninety four percent!
[Is THAT why Victoria’s Secret VSXY earnings exploded, sending the stock +35% on the week?!]
From Alyosha/Market Vibes. In the past three months:
Total jobs created: +565,000 nonfarm payroll jobs over the three months
(+214k in March +179k in April +172k in May)… Combined revisions for March + April: +93,000
80% of the new jobs are hourly non-supervisory roles.
50–60% are menial jobs like grocery bagging and cleaning hotel rooms paying less than $25/hour.
30–35% of new jobs pay $35/hour … mainly health care and other services.
15–20% higher-wage ($40+/hour) select skilled and government jobs.
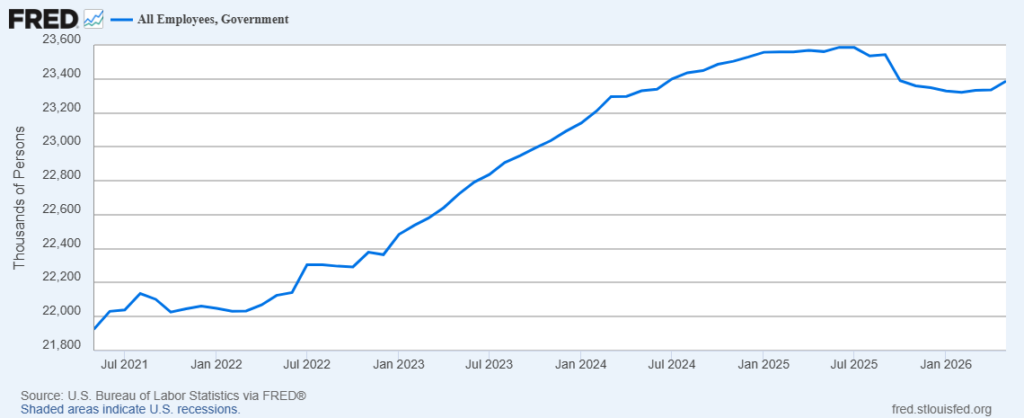
According to St Louis FRED, May added 52k Gov’t jobs (does not include US military). Somewhat interesting that the decline in gov’t payrolls from the high in mid-2025 to the beginning of this year is starting to reverse.
Consumer Credit was +$20.7 billion in April to total $5.15T. Revolving, (at 21% financing rate) is $1.35T, so that’s an annual interest rate bill of $283b or around $23b per month, a flow from stretched consumers to financiers. Of course, some of that defaults. According to the latest release, “revolving credit increased at an annual rate of 10.4%.” Confidence due to improving employment? Or desperation? (Total Cons Credit +4.8% annual rate).
There is a LOT of news coming over the next two weeks: CPI on Wednesday expected 0.5% m/m and 4.2% y/y. Core yoy expected +2.9 from +2.8. PPI is Thursday, yoy expected 6.4% from 6.0. WTI averaged 63 in May 2025, and was around 100 last month. [In Jan 2025 WTI spiked to 80)
Federal Budget Deficit for May on Wed, expected -275 billion from April’s tax month +215b. SpaceX IPO scheduled for Friday. FOMC the following Wednesday.
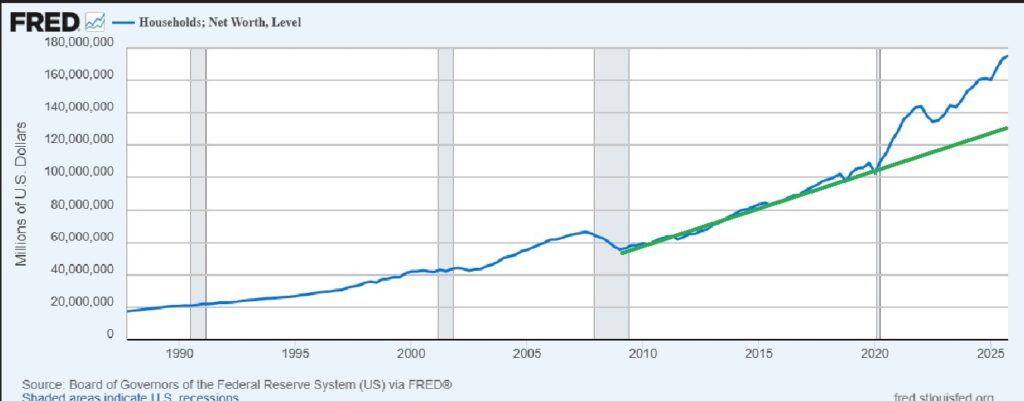
Fed’s Z.1 report which features HouseHold Change in Net Worth is Thursday, Real estate is starting to crack in some regional markets. SPX was 6845 on Dec 31 but 6344 on March 30, a decline of 7.4% for Q1. Since the end of March, stocks exploded, but Thursday’s headlines (in what is likely to feel like a vulnerable stock market) are going to blare: Decline in HH Net Worth for Q1!!! Stocks are ~33% of HH assets so I am going to assume a drop of 2.5-3% in Q1 HH Net Worth.
Just a couple more words about HH Net Worth: According to FRED the total level in Q4 is $175.3T! From Q4 2009 to Q4 2019 the trend was steady at about +$5T per year, from 58.3 to 109T. But in the past six years from Q4 2009 to Q4 25, the ascent accelerated to $11T per year, (with more volatility). $109T to $175.3T. It’s almost as if the market has ALREADY priced a productivity boom from AI.
Looking at nominal GDP as a comparison: from 2009 to 2019, $14.48T to $21.54T, about 0.7T year, total increase of ~50%. In the shorter six year time frame, GDP from 21.54 to 32.38 or $1.8T per year, again, a total increase of 50%, but only over 6 years rather than 10. I would contend the acceleration in GDP was due to fiscal profligacy.
So from 2009 to now, net worth has surged from $58.3 to $175.3 or $117 trillion. Nominal GDP has increased $17.9T. Does that gain in the ratio of assets/income make sustainable sense?
OTHER THOUGHTS / TRADES
Since early 2023, the midpoint of the FF target has been above CPI. The last CPI print of 3.8% reversed this situation (FF midpoint is 3.625%). This week CPI is expected 4.2% making it increasingly difficult to frame monetary policy as ‘modestly restrictive’.
Dallas Fed President Logan is leaning toward hikes. A BBG piece said data center construction in Texas …the drive to erect three data centers in the area – by Meta Platforms Inc., OpenAI and Oracle is creating worker shortages and driving up wages… “a warning sign for a Fed official already concerned that inflation may be stuck at levels that are too high.”
On the week, the 2y note jumped 14.5 bps to 4.155%, the bulk of that coming with Friday’s rise of 10.8 bps. Tens rose 8.3 on the week (4.9 on Friday) to 4.532%, while 30s were up only 1 bp to 4.998%. Curve measures are the flattest since the beginning of Q2 2025: 2/10 now just under 38 and 5/30 is 72.4. On the SOFR strip, SFRU7 was weakest, closing -20 on the week at 9591.5 (13 of that on Friday). SFRM7 is still the lowest contract of the first five years at 9589.5, down 19 on the week. These contracts are around 4.1% with current EFFR 3.62%, so nearly 50 bps of potential hikes. ECB expected to hike Thursday. Treasury auctions of 3s, 10s, 30s Tuesday, Wed, Thur.
In 2024 the low of the 4th SOFR contract was 9510.5 (4.895%) with FF midpoint 5.375%. Actually, the 4th contract has had a yield BELOW the FF midpoint ever since the regional bank blow-up in March 2023….until this year. Since April, the 4th slot yield (currently H’27) has been above FFmid, now 3.625%. This is either a signal of much higher rates to come, or of an oversold condition. I lean toward the latter, but HAVE A SELL STOP IN.
https://twitter.com/AlexManzara/status/2063687791960375731/photo/1
| 5/29/2026 | 6/5/2026 | chg | ||
| UST 2Y | 401.0 | 415.5 | 14.5 | |
| UST 5Y | 414.6 | 427.4 | 12.8 | |
| UST 10Y | 444.9 | 453.2 | 8.3 | w/i 453.9 |
| UST 30Y | 499.0 | 499.8 | 0.8 | w/i 500.0 |
| GERM 2Y | 252.6 | 268.8 | 16.2 | |
| GERM 10Y | 293.7 | 303.8 | 10.1 | |
| JPN 20Y | 357.2 | 356.7 | -0.5 | |
| CHINA 10Y | 171.0 | 171.6 | 0.6 | |
| SOFR M6/M7 | 25.0 | 44.0 | 19.0 | |
| SOFR M7/M8 | -12.0 | -14.5 | -2.5 | |
| SOFR M8/M9 | 3.0 | -2.5 | -5.5 | |
| EUR | 116.59 | 115.22 | -1.37 | |
| CRUDE (CLN6) | 87.36 | 90.54 | 3.18 | |
| SPX | 7580.06 | 7383.74 | -196.32 | -2.6% |
| VIX | 15.32 | 21.51 | 6.19 | |
| MOVE | 70.22 | 75.20 | 4.98 | |
Brief note with NFP expected 85-90k
June 5. 2026
**********
–Payrolls today expected 85-90k with an unemployment rate of 4.3%.
–Rates eased a few bps yesterday, led by the front end. 2y yield -3.7 to 4.047% while tens fell 1.8 to 4.473%. Lowest near term SOFR contract is still SFRM7 now at 9602.5, +5 on the day. Blue SOFR pack, 4th year forward, was only +1 at avg price 9610.875.
–Bitcoin is below 63k this morning, a drop of over 22% just from the May 13 price of 82240. June Nasdaq is now 30200 (Friday morn). High settle on June 2 just over 30700. A drop of 20% would be 24500-ish, which would likely result in “an orchestra of scorched cats” as Mr Jorkin from a Christmas Carol once described a financial panic. Hard to imagine, with more asset managers gating withdrawals: Especially hard to imagine given the scorching rally off the Thursday morning Broadcom inspitred lows, which saw NQM surge from 30151 to 30603.
(CNBC) Blackstone is restricting withdrawals from its flagship Blackstone Private Credit, or BCRED, fund following a spike in investor redemption requests, as fears over liquidity pressures rattled private markets.
The asset management giant capped investor withdrawals from the $79 billion nontraded business development company at 5% of shares, after redemption requests hit 10% during the second quarter.
Selling to willing buyers…
June 4, 2026
**********
“We are selling to willing buyers at the current fair market price.” -John Tuld in Margin Call
–SpaceX ready to go at $1.78T valuation according to FT. End-of-the-day news was Broadcom’s call, which is pressuring Nasdaq; AVGO currently down 12.7% in post-trade slide. The difference in ‘Margin Call’ is that willing (and passive) buyers are currently active at sky high valuations. However, several former high fliers were hit yesterday before Broadcom results (even as chips made new highs):
MSFT -3.1%
AMZN -2.5%
PLTR -6.5%
NVDA -3.6%
CRM -5.1%
–Note that bitcoin has been leading the way lower, now just above 63k with market cap down to $1.26T.
–Rates ended higher on the day with tens +3.8 bps at 4.491%. Curve remains biased to flatter levels, with 5/30 at a new low 77.6 (4.214, +3.8 and 4.99, +2.5 bps). Late in the day Dallas Fed President Lorie Logan said the Fed may need to hike.
–On the SOFR strip, red/green pack spread made a new low -9.5 with red pack -4.375 at 9603.625 and greens -3.625 at 9613.125. 10/30 spread around 50, with 10s at 4.5 and 30s 5.0. Early new buyer of 42k TYQ 108p for 23 (22s vs TYU6 109-145, 25d). Active call trade in SFRZ6: 9700/9762.5c 1×2 -1 (took credit) paid 30k, settled 4.0 and 2.5. Also about 50k SFRZ6 9800c 2.0 paid (1.75s). SFRZ6 9611settle.
Not uncommon to see large TY put buyers in front of NFP, though usually shorter date hedges.
–Today’s news includes Jobless Claims, expected, as always, 215k. Non-farm Productivity expected +0.4%
This summary from the start of the Beige Book says it all (yes, the Fed is well aware of income/spending disparities):
Consumer spending remained mixed across Districts and increasingly bifurcated across income groups amid affordability pressures. Higher-income households remained resilient and less sensitive to price increase, while middle-income households were described as “squeezing more life out of every dollar before deciding to spend it,” and low-income consumers showed greater financial strain. Overall, there were reports of increased credit card usage, fewer retail visits, and stronger demand for necessities. Auto dealers reported softer new vehicle demand tied to affordability and fuel costs, alongside substitution toward used and hybrid vehicles. By contrast, manufacturing activity increased at a modest to strong pace for nine of the Districts and only one noted a slight decline from the previous period. Banking conditions were stable across most Districts; however, residential mortgages, consumer, and agricultural loan delinquencies were noted as rising in several of the Districts.
And this from Dollar Tree’s Q1 report at the end of May:
Comparable store net sales increased 3.5%, driven by a 4.5% increase in average ticket, partially offset by a 1.0% decline in traffic.
Sounds stagflationary to me: +4.5 due to inflation, but traffic is down!
And then this from Realtor.com
Home Listing Prices Post Sharpest Drop in 9 Years as Sellers Face Reality Check
realtor.com
–The high end is supported by equity valuations, and equity valuations are supported by the chip stocks. If that changes it’ll turn very quickly into negative GDP prints. Atlanta Fed GDP Now currently +3.0 for Q2.
Treasury curve flattens
June 3, 2026
***********
–Fairly quiet yesterday with main theme being curve flattening. 2/10, down 1.8 at 40.6 (4.047/4.453) is lowest since April 2025 and 5/30 at 79.1 (4.176/4.965) is lowest since May 2025. High in 2/10 in Feb was 72.5. On the SOFR strip, back month calendars are also edging to new lows, for example red/green pack spread settled -8.75 (9608, +0.125 and 9616.75, +1.25). Net changes aren’t large but the trend reflecting somewhat tighter monetary policy remains in force. Peak contracts on SOFR strip now SFRU8 and Z8 (moved back a slot) at 9617. All SOFR contracts in first 4 years are between 3.83% and 4.02%.
–This morning US and Iran are trading attacks, oil is marching higher (current 96.30 +2.54) with modest weakness resulting in ES. Bitcoin continues to flounder. On May 6 it was 80.8k and this morning close to 67k, a decline of 17% in a month. $/yen is back near 160 even as Ueda “says BOJ needs to keep raising rates to contain inflation” (BBG).
–News today includes ADP expected 120k from 109k last. ISM Services expected 53.8 from 53.6. Factory Orders expected 4.6% from +1.5 last. Fed’s Beige Book in the afternoon. Friday’s NFP expected +85k. Two weeks from FOMC. Does Warsh accommodate the tech surge?
–This morning MRVL is 320, having been below 100 at the end of March. Some astonishing moves. On a more prosaic level, Victoria’s Secret was a bit above 40 at the end of March, but jumped 48% yesterday to just over 80. Maybe it’s all part of the Ozempic economy, with CAG (Conagra) making a new low with p/e 7.2 and dividend yield 10.9, and Chipotle (CMG) breaking out to a new low as well, cut in half from the high last July.
Remove the limits!
June 2, 2026
**********
–An early Monday morning report that Iran was halting the exchange of communications with US negotiators sent oil higher, stocks and bonds lower. Treasury curve flattened to new recent lows. Two year yield up 3.9 bps to 4.049% while tens rose 2.4 to 4.473%. New low in 2/10 at 42.4 and in 5/30 at 80.6. On the SOFR strip SFRU7 was weakest, down 6.5 to 9605. SFRM7 is the lowest near contract, at 9602.5. (Near 4% one-year forward, vs 3.62% current EFFR).
–CLN6 settled 92.16, up 4.80. TYU6 settled 109-195, down 7, but USU6 was unch’d at 112-07. ESM fought back from lows and settled modestly higher. Strong Mfg ISM of 54.0 (expected 53) was also a bearish factor for rate futures. JOLTS today expected 6866k, unch’d from last.
–In a recent interview Paul Tudor Jones mentioned that the past ten years or so have seen a steady decline in equity outstanding of about 2% a year due to stock buybacks. He said the IPOs of SpaceX, Anthropic and OpenAI represented a possible reversal of this trend. Yesterday, Google jumped the line, announcing an $80 billion equity raise to fund AI (I don’t perceive Buffet as a guy who would buy at peak valuations, but Berkshire has apparently spoken for $10b). News reports that Anthropic is racing to squeeze its IPO in before OpenAI suggests a narrow window to take advantage of frothy conditions.
–Bitcoin is seeing no support from the AI bid, this morning trading below 70k… anecdotal evidence that AI is sucking the oxygen out of the room. With this backdrop, RobinHood is eliminating its PDT (Pattern Day Trading) rule. “What it means for you: We will be wiping all past PDT flags clean. Soon, customers will be able to trade on Robinhood without worrying about day trading limits again.”
https://x.com/RobinhoodApp/status/2061518610376294768
In 2022, they cured high prices with HIKES
June 1, 2026
************
–Friday featured slightly lower yields, with tens down nearly 1 bp at 4.449%. Peak SOFR contract SFRM8 rose 1.5 to 9620.5 (still nearly 1/4% above current EFFR). Lowest near term contract is SFRM7 at 9608.5, +0.5. This one-yr calendar (M7/M8) is obviously the most inverted at -12.
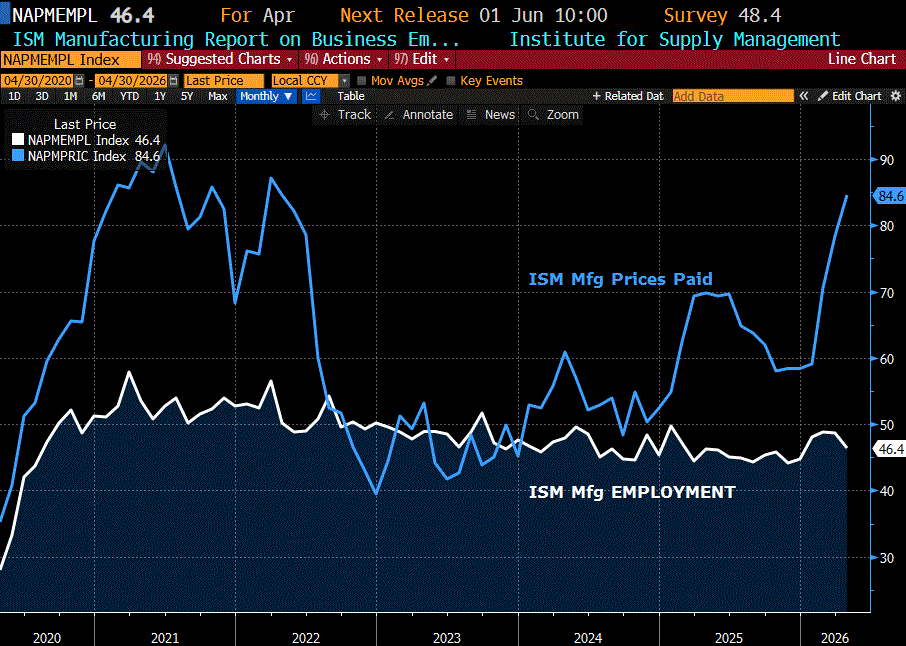
–Payrolls cap the week with NFP expected +89k. Today ISM Mfg expected 53.0 from 52.7. While the employment component is still expected below the 50 mark at 48.4, Prices paid is expected 85.0. I guess the gaping chasm between these two measures is as good as any if one wants to latch onto the ‘stagflation’ thesis.
–New Kuppy piece (Praetorian Capital) highlights the trades as an employment bright spot.
https://pracap.com/
Many corporates are so desperate for workers, that they’ll subsidize education, they’ll sign agreements where students can work off their debt in the first few years of employment, they’ll literally guarantee student debts. Corporates have become desperate for trained workers [in the trades], and they don’t want the cost of education to be a hindrance. Go to the homepages of LINC and UTI, and look at all the large corporate partnerships. More importantly, the pay scales are quite attractive for first year workers. This is a macro trend that’s already inflecting as the shortage of workers accelerates—AI disruption will only accelerate it further as we need to re-skill millions of future employees.
Forward Guidance
May 31, 2026 -Weekly Comment
***************************
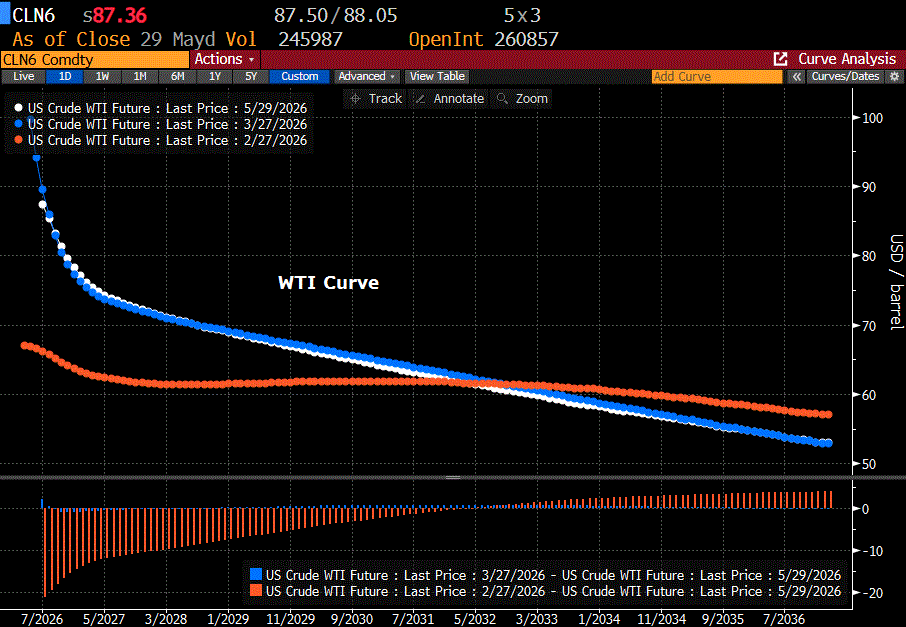
The CEO of Chevron, Mike Wirth, was on a Bloomberg interview a couple of days ago, and was asked about the forward futures curve in crude. I was surprised when he said “we don’t really look at that very frequently”. He said they run their own analysis and simulations for planning purposes. “We don’t look at the futures curve as a prediction of future price.” Both Chevron and Exxon CEOs have warned that inventories are low and price risks are to the upside. That particular signal is clearly reflected in options: CLZ6 settled 78.29. CLZ6 100c, almost 22 otm are 3.10 while the 67p, only 11 otm are nearly the same price at 3.17.
https://x.com/lisaabramowicz1/status/2060351071923417414
Below is a curve snapshot of three different days, Feb 27, Mar 27 and May 29. Feb 27, pre-hostilities, is in orange. As Wirth mentioned, shortages are often followed by gluts, and the most recent curve pricing seems to suggest just that, with much lower prices in forward contracts.
Below I add the SOFR futures curve for the same three days. What stands out of course, is the sell off in contracts one-year forward (and beyond) as current oil prices and soaring equities spark inflation fears. SFRM7 has fallen 100 bps in three months, and though rate futures rallied this week, the market appears to have accepted the idea of higher forward rates.
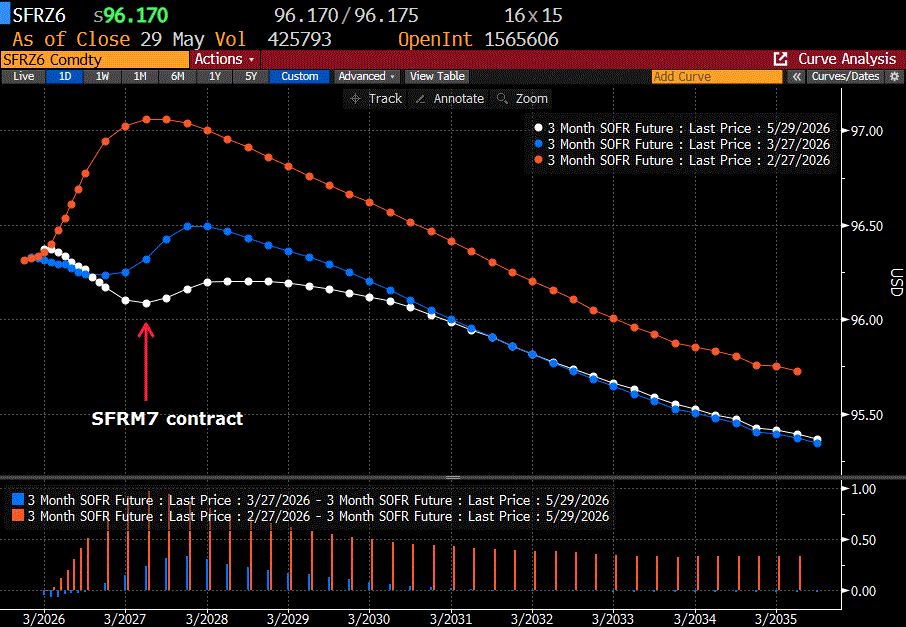
This, despite all kinds of negative news regarding consumer delinquencies and slower growth. Worth noting is that both WMT and COST were hammered this week, with the former tumbling 13.7% from the high on May 19, and the latter down 12.6% from the same date. Of course, major indexes closed at new all-time highs.
By the way, option pricing in SOFR also indicates fear of higher rates. SFRZ6 settled 9617. SFRZ6 9550p settled 6.0 (67 otm) while the equidistant 9681.25c settled 5.0, but that’s with SFRZ6 reflecting nearly one hike already.
When looking at the oil and SOFR curves, one might say they’re giving contradictory signals. Oil prices are down in the future but rates are higher. The other conclusion of course, is that there is more of an underlying inflation fear than just what’s related to energy prices.
The first Warsh FOMC is two and a half weeks away on 17-June. Prior to that we’ll get NFP this Friday and CPI the following Wednesday, 10-June. On Monday ISM Mfg is released, which featured a huge jump in prices paid last time to 84.6; expected 85.0 this time. Headline ISM Mfg expected 53.0 from 52.7. NFP expected 89k; I would think this week’s economic data will lean to the stronger side and reverse the modest rally in bonds from last week. The June FOMC will likely see little change in terms of immediate policy.
OTHER THOUGHTS / TRADES
Last week I mentioned the idea of picking up cheap call spreads on red SOFRs, e.g. 0QZ6 9675/9725cs which had settled 4.75 vs Z7 9604.5. On Friday SFRZ7 settled 9616 and the 9575/9625cs at 5.5. While I expect a pullback in prices this week, I can still see holding call spreads.
What we have seen is paper rolling long structures further out the curve, for example on Friday SFRZ6 9700/9800cs sold vs bot SFRM7 9700/9800cs, paying 5 for June 20k. Again, as the Iran war started, red SOFR contracts traded above 9700. (M7 cs settled 6.75 on Friday).
| 5/22/2026 | 5/29/2026 | chg | ||
| UST 2Y | 413.0 | 401.0 | -12.0 | |
| UST 5Y | 427.4 | 414.6 | -12.8 | |
| UST 10Y | 457.0 | 444.9 | -12.1 | |
| UST 30Y | 508.1 | 499.0 | -9.1 | |
| GERM 2Y | 264.1 | 252.6 | -11.5 | |
| GERM 10Y | 303.7 | 293.7 | -10.0 | |
| JPN 20Y | 368.5 | 357.2 | -11.3 | |
| CHINA 10Y | 174.8 | 171.0 | -3.8 | |
| SOFR M6/M7 | 37.8 | 25.0 | -12.8 | |
| SOFR M7/M8 | -15.5 | -12.0 | 3.5 | |
| SOFR M8/M9 | 4.5 | 3.0 | -1.5 | |
| EUR | 116.03 | 116.59 | 0.56 | |
| CRUDE (CLN6) | 96.60 | 87.36 | -9.24 | |
| SPX | 7473.47 | 7580.06 | 106.59 | 1.4% |
| VIX | 16.70 | 15.32 | -1.38 | |
| MOVE | 78.43 | 70.22 | -8.21 | |
Gliding into Friday
May 29, 2026
***********
–Uneventful day with slightly flatter curve, easier vol in rates. Ten year yield -2.2 bps at 4.457,with 2/10 eking out a new recent low at 43.2. On and off peace agreement has oil moving lower. This morning 87.45, down 1.45, despite repeated warning (latest from Exxon CEO) of dangerously low inventories.
–News today includes: trade and chgo pmi.
–After yesterday’s Personal Income and Spending reports, Personal Savings rate down to 2.6% for April, a new recent low. In June of 2022 it got down to 2.2%. In Nov 2007, just before the Housing burst, it was 1.9%, but the low was July 2005 at 1.4%. From 2013 to 2018 it was and avg of about 5.3 to 5.4%. We have portfolio gains…why save??
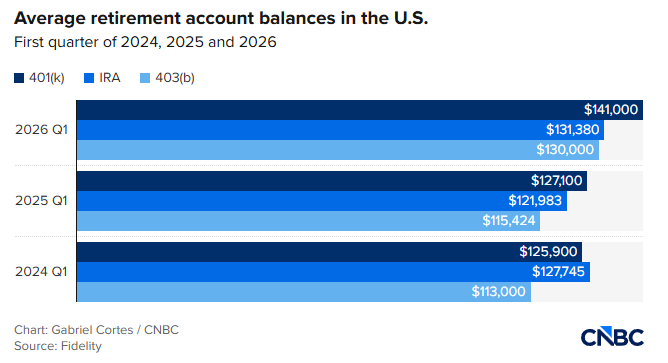
–Another snippet indicated that more people are borrowing or otherwise raiding 401k’s. Likely not large enough to make a macro difference; these average retirement account balances don’t seem particularly large.
Cease-fire strained
May 28, 2026
************
–Yields edged slightly lower yesterday with 10s down 1.4 bps to 4.479%. Front end sofr contracts were slightly bid, with SFRH7 leading, +2.5 to 9608.0 (3.92 vs current EFFR of 3.62, so a hike is priced). With CLN6 settling -5.21 at 88.68, and SPX at new all-time high, 10y breakeven has fallen back from recent highs at 252, to 242 yesterday.
–Cease-fire in Iran appears to have ended or at least be under heavy strain with new attacks on targets near Hormuz. CLN6 seeing a modest bounce back above 90/bbl.
–Today’s news includes Pers Spending and Consumption, and PCE prices. PCE price mom expected 0.5 from 0.7, yoy 3.8 from 3.5%. Core 0.3 from 0.3 with yoy 3.3 from 3.2. Job Claims at 211k (as always). Cap Goods nondef ExAir has been strong, expected 0.4 from 3.4. Not much change expected in 2nd estimate of Q1 GDP. New Home Sales expected 660k from 682k…pretty much been between 610k and 720k for past 3 years.
–Interesting story on BBG: ‘Ellisons’ $49b Ask is Acid Test for Markets’
AI summary: Bankers preparing jumbo debt package to support $110b acquisition of Warner Bros….merged business will start life extremely high leverage, with net debt being 6.5x this year’s forecast.
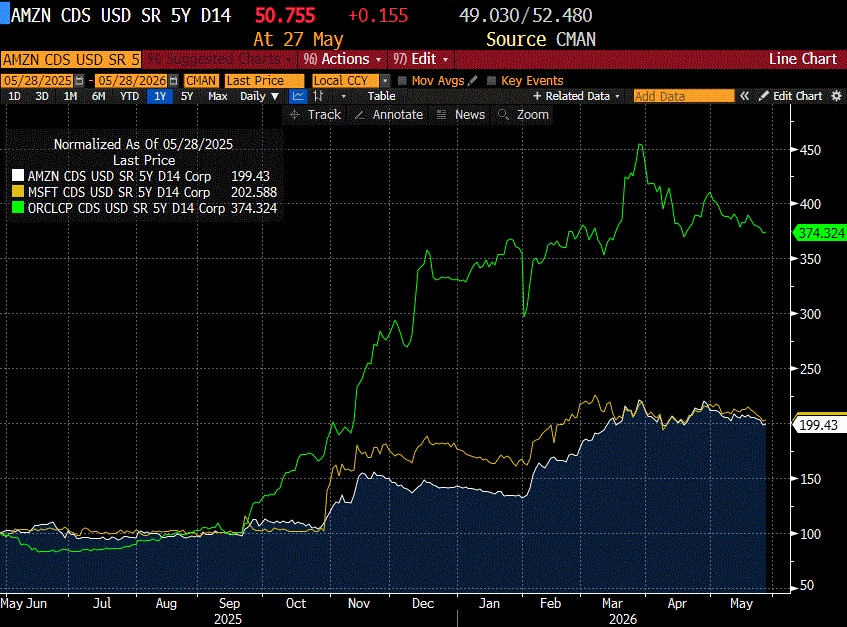
I am a bit [a lot] out of my depth on this, but I looked at Debt to Common Equity ratios for MSFT, 32.7%, AMZN 41.3% and ORCL 532%. I am not so interested in Warner, but after the OpenAI/ORCL announcement in Sept that took the stock (ORCL) to 325, it’s now 191, having bounced from an April low 138. Attached chart shows relative (not absolute) changes in 5y CDS since the start of the year. [I own some ORCL puts]
https://blinks.bloomberg.com/news/stories/TFQB45RKV2TH
Oil lower. Rate futures respond with higher prices and crushed vol
May 27, 2026
***********
That’s NOT a Ferrari. Former Ferrari chairman Montezemolo: “We risk the destruction of a legend. So sorry. Take the Prancing Horse off.” Now that THAT’S out of the way…

–Yields fell hard on Monday and futures maintained gains yesterday as oil fell. From Friday to Tuesday settle, SFRH7 and M7 led the pack, settling +10.5 at 9605.5 and 9604.5, the latter contract being the low on the strip out to blues. A bit higher yet this morning, SFRM7 9607. SFRZ6/Z7 calendar settled exactly zero, with both contracts 9613.5. One of those prices is wrong! On the rally implied vol was hammered with many SOFR straddles settling as much as 4 bps lower. SFRM7 9600^ settle 81.25 Friday and 79 yesterday. 0QU6 9600^ settled 50.5 Friday (9598.5) and 0QU6 9612.5^ settled 46.5 (9608). 0QU7 9600^ 48.5s.
–CLN6 printing 90 as of this note, -3.89 and near yesterday’s low.
–Same story in treasuries with TYU6 109.5^ 2’11s (109-185) vs Friday 109^ 2’21s (108-315). Buyer of 30k TY wk5 (this Fri) 109.5/109.25ps, 6 paid 30k. 10y treasury yield -7.7 bps to 4.493%
–Notable large SOFR opt trade: +75k SFRZ6 96.3125/96.375/96.4375 c fly pd .75. Tight window for end of year, looking for nothing out of the Fed. Also exit sales of 0QM6 9600 puts.
–BOJ’s Ueda “indicated the need for vigilance over the impact of oil price spikes on the underlying inflation trend” (BBG). BOJ meeting June 16 with hike expected. $/yen won’t stay down: now 159.38 chewing up near April 30 intervention high (160.72)
–From TOL @t11mmo yesterday on X: ERM6 vol continues to get crushed The 97.625/97.75 Strangle is now 2.5/3…12000 were sold at 4.5-4 this am Expiry is Monday June 15 (14 fixes) ECB is Thursday June 11 – 23bps priced The vol move lower today is basically saying the ECB raising rates in June is a “done deal”
–Astonishing run in MU and other chips. MU closed at 322 on March 30. Two months later it has nearly tripled, 940 new high in pre-trade this a.m. Up nearly 3x with market cap over $1T. If there’s trepidation about upcoming SPCX, OpenAI and Anthropic IPOs, it’s not evident here. MU and INTC alone have added about $1T mkt cap since end of March (SPCX expected valuation 1.75 to 2T). Bitcoin not confirming…after trading 82k early in May it’s now just below 76k.

