High Prices
August 15, 2025
*****************
–Shocking PPI data caused a back-up in yields. PPI up 0.9% m/m and 3.3% yoy. Ex-food and Energy +3.7% yoy. Tens rose 5.5 bps to 4.291%. On the SOFR strip, SFRH6 was weakest, falling 7 to 9646.5. FFV5 fell back below a 25 bps ease, settling -3.5 at 9591. (9592 represents certainty of a 25 bp cut, so the idea that PPI data might derail a rate cut is NOT currently being priced).
–Even with the change in tone, another 25k SFRU5 9612.5/9625cs were bought, paying 1.375. SFRU5 settled 9593.0. This position is >200k with open interest 650k and 550k respectively. Something bad about the next payroll report? Another interesting trade: buyer of 30k SFRM6 9850c (3.0s vs 9668.5) with SFRU6 9862.5c (3.5s vs 9683.5) for 6.5. It’s not that the Fed needs to cut to 1.5%, but a negative economic or geopol outlier can easily juice up wing vol.
–Trump/Putin summit, though the possibility of a breakthrough seems slim and has been downplayed.
–Bessent said the US was not looking to acquire more digital assets, (or wants to acquire in ‘budget neutral’ ways). In any case, bitcoin had a huge range, early new high at 124,514. Low as of futures settle 117.233. Big outside reversal day, but as we’ve seen recently, the machines don’t necessarily view that as a directional signal. MSTR near 373 after having been up to 450 last month, but this looks like a support area. BTC currently 118900.
–News today includes Retail Sales expected 0.6%, ex-auto and gas 0.3% expected vs 0.6% last. Industrial Production expected 0.0 vs 0.3 last. UNH up 12% post-close as Warren Buffet was disclosed as a buyer. INTC up over 10% between yesterday and this morning as Trump expressed an interest in taking a stake. I wish that was a joke, but it’s not.
–Weak China data (from CNBC). Retail Sales +3.7% sharply missing analysts’ estimates for 4.5%. Ind Output +5.7%, weakest since Nov of last year. Fixed asset investment 1.6% this year as of July, slowing from 2.8% in the first six months.
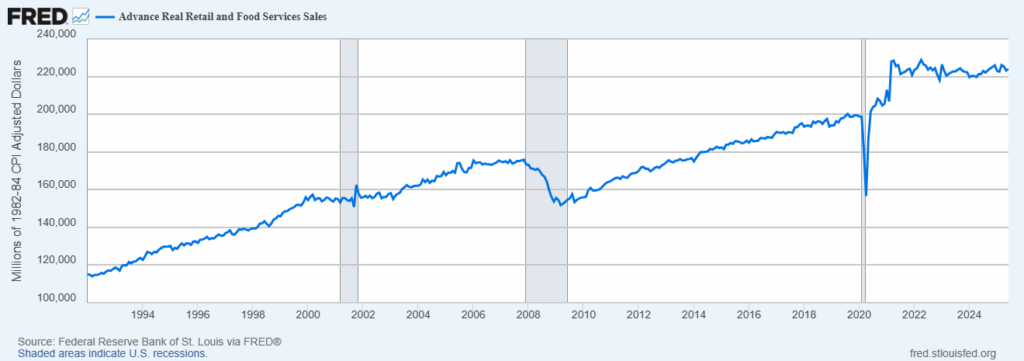
–Below is a chart of US Retail Sales, CPI adjusted. Previous horizontal periods appear consistent with recession, though it can be argued we’re just getting back to trend following covid.