
Hit by a Ukulele
June 7, 2026 – Weekly comment
**************************
FREMONT, CA — Police say they’re investigating a bizarre road rage incident in Fremont that ended with one person hitting the other over the head with an otherwise peaceful musical instrument on Monday. (Fark.com)
In the comments section:
Your chances of being hit with a ukulele are always small, but never zero
VIX jumped from 15.32 to 21.51 this week as stocks tumbled Friday. NQM6 fell 5.6% from Thursday’s settle to Friday’s late day low (30488 to 28781), essentially wiping out the past month’s worth of gains. (Friday, May 8 settle was 29332.5 and Friday June 5 was 29026.50).
Consider this, consider this
The hint of the century
Consider this, the slip
That brought me to my knees, failed
What if all these fantasies come flailing around?
Now I’ve said too much
–REM- Losing My Religion
I had thought the instrument in Losing My Religion was a ukulele, but of course it’s not, it’s a mandolin (equally useful in road rage incidents) peacefully played by Peter Buck.
Below is a cover of Losing My Religion, with ukuleles!
The question before us is whether the flailing religion of AI and datacenters will bring the equity market, and by extension the economy, to its knees. [the dip that brought me to my knees, failed] SOX semi index was down 12.2% from Wednesday to Friday. Micron MU was down 20% over the same two sessions. Of course, these declines are barely a blip given the scorching rally in April-May. But META’s announcement that it’s looking to raise tens of billions in a new equity raise (FT) isn’t likely to help. META -5.5% Friday. Perhaps the odds of this being the start of a big bear market are small, but not zero.
As a scenario, consider this: In Jan 2008 WTI popped to 80. Now it’s around 95. By next April, there’s a strong possibility that oil will be flat to negative yoy. I.e., no inflation. The professionals are saying that dangerously low inventories will cause a spike in oil to $150 or higher. My thought is that Americans won’t accept $7/gallon gasoline. The political pressure will be severe, and may cause a more rapid opening of Hormuz, one way or another. At the same time, what if the AI capex bubble pops? Catalysts could be short term energy prices or a myriad of other factors. For example, Warsh tamping down on the Fed’s balance sheet to assuage the hawks? The wealth effect has supported the US economy and consumption. Will there be demand destruction due to lower asset prices as oil inflation goes into reverse next year? Is that part of the reason the admin is looking at taking positions in AI companies?
The catalyst for Friday’s market action was a much stronger than expected employment report, which showed a gain of 172k jobs, with April also revised higher, from 115k to 179k.
Of course, there ARE some problems. From @TheTinMenBlog on X:
This is staggering – Of the 369,000 jobs the U.S. Labor Dept. says were created since last year, nearly all – 348,000 of them – went to women, and only 21,000 went to men. Basically, that means 94% of the net employment growth in the U.S. went to women. Ninety four percent!
[Is THAT why Victoria’s Secret VSXY earnings exploded, sending the stock +35% on the week?!]
From Alyosha/Market Vibes. In the past three months:
Total jobs created: +565,000 nonfarm payroll jobs over the three months
(+214k in March +179k in April +172k in May)… Combined revisions for March + April: +93,000
80% of the new jobs are hourly non-supervisory roles.
50–60% are menial jobs like grocery bagging and cleaning hotel rooms paying less than $25/hour.
30–35% of new jobs pay $35/hour … mainly health care and other services.
15–20% higher-wage ($40+/hour) select skilled and government jobs.
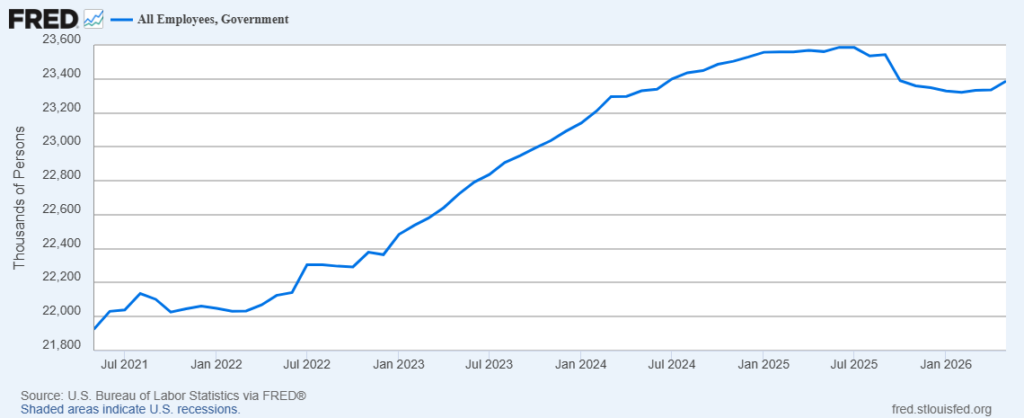
According to St Louis FRED, May added 52k Gov’t jobs (does not include US military). Somewhat interesting that the decline in gov’t payrolls from the high in mid-2025 to the beginning of this year is starting to reverse.
Consumer Credit was +$20.7 billion in April to total $5.15T. Revolving, (at 21% financing rate) is $1.35T, so that’s an annual interest rate bill of $283b or around $23b per month, a flow from stretched consumers to financiers. Of course, some of that defaults. According to the latest release, “revolving credit increased at an annual rate of 10.4%.” Confidence due to improving employment? Or desperation? (Total Cons Credit +4.8% annual rate).
There is a LOT of news coming over the next two weeks: CPI on Wednesday expected 0.5% m/m and 4.2% y/y. Core yoy expected +2.9 from +2.8. PPI is Thursday, yoy expected 6.4% from 6.0. WTI averaged 63 in May 2025, and was around 100 last month. [In Jan 2025 WTI spiked to 80)
Federal Budget Deficit for May on Wed, expected -275 billion from April’s tax month +215b. SpaceX IPO scheduled for Friday. FOMC the following Wednesday.
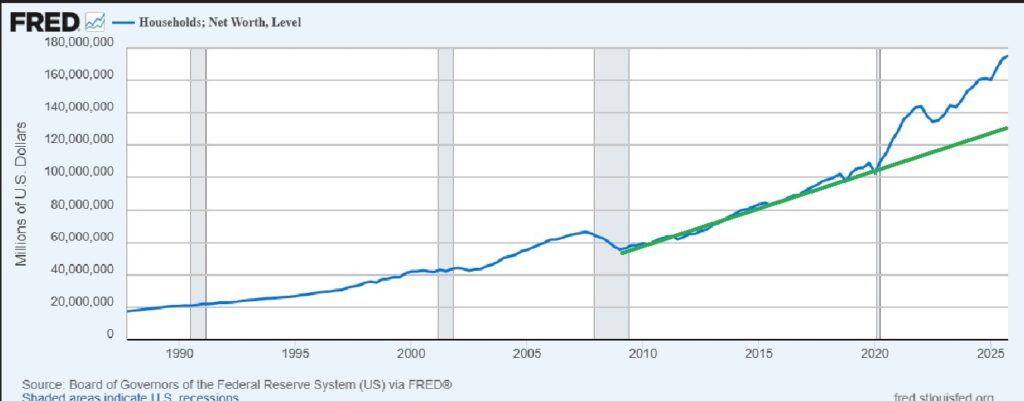
Fed’s Z.1 report which features HouseHold Change in Net Worth is Thursday, Real estate is starting to crack in some regional markets. SPX was 6845 on Dec 31 but 6344 on March 30, a decline of 7.4% for Q1. Since the end of March, stocks exploded, but Thursday’s headlines (in what is likely to feel like a vulnerable stock market) are going to blare: Decline in HH Net Worth for Q1!!! Stocks are ~33% of HH assets so I am going to assume a drop of 2.5-3% in Q1 HH Net Worth.
Just a couple more words about HH Net Worth: According to FRED the total level in Q4 is $175.3T! From Q4 2009 to Q4 2019 the trend was steady at about +$5T per year, from 58.3 to 109T. But in the past six years from Q4 2009 to Q4 25, the ascent accelerated to $11T per year, (with more volatility). $109T to $175.3T. It’s almost as if the market has ALREADY priced a productivity boom from AI.
Looking at nominal GDP as a comparison: from 2009 to 2019, $14.48T to $21.54T, about 0.7T year, total increase of ~50%. In the shorter six year time frame, GDP from 21.54 to 32.38 or $1.8T per year, again, a total increase of 50%, but only over 6 years rather than 10. I would contend the acceleration in GDP was due to fiscal profligacy.
So from 2009 to now, net worth has surged from $58.3 to $175.3 or $117 trillion. Nominal GDP has increased $17.9T. Does that gain in the ratio of assets/income make sustainable sense?
OTHER THOUGHTS / TRADES
Since early 2023, the midpoint of the FF target has been above CPI. The last CPI print of 3.8% reversed this situation (FF midpoint is 3.625%). This week CPI is expected 4.2% making it increasingly difficult to frame monetary policy as ‘modestly restrictive’.
Dallas Fed President Logan is leaning toward hikes. A BBG piece said data center construction in Texas …the drive to erect three data centers in the area – by Meta Platforms Inc., OpenAI and Oracle is creating worker shortages and driving up wages… “a warning sign for a Fed official already concerned that inflation may be stuck at levels that are too high.”
On the week, the 2y note jumped 14.5 bps to 4.155%, the bulk of that coming with Friday’s rise of 10.8 bps. Tens rose 8.3 on the week (4.9 on Friday) to 4.532%, while 30s were up only 1 bp to 4.998%. Curve measures are the flattest since the beginning of Q2 2025: 2/10 now just under 38 and 5/30 is 72.4. On the SOFR strip, SFRU7 was weakest, closing -20 on the week at 9591.5 (13 of that on Friday). SFRM7 is still the lowest contract of the first five years at 9589.5, down 19 on the week. These contracts are around 4.1% with current EFFR 3.62%, so nearly 50 bps of potential hikes. ECB expected to hike Thursday. Treasury auctions of 3s, 10s, 30s Tuesday, Wed, Thur.
In 2024 the low of the 4th SOFR contract was 9510.5 (4.895%) with FF midpoint 5.375%. Actually, the 4th contract has had a yield BELOW the FF midpoint ever since the regional bank blow-up in March 2023….until this year. Since April, the 4th slot yield (currently H’27) has been above FFmid, now 3.625%. This is either a signal of much higher rates to come, or of an oversold condition. I lean toward the latter, but HAVE A SELL STOP IN.
https://twitter.com/AlexManzara/status/2063687791960375731/photo/1
| 5/29/2026 | 6/5/2026 | chg | ||
| UST 2Y | 401.0 | 415.5 | 14.5 | |
| UST 5Y | 414.6 | 427.4 | 12.8 | |
| UST 10Y | 444.9 | 453.2 | 8.3 | w/i 453.9 |
| UST 30Y | 499.0 | 499.8 | 0.8 | w/i 500.0 |
| GERM 2Y | 252.6 | 268.8 | 16.2 | |
| GERM 10Y | 293.7 | 303.8 | 10.1 | |
| JPN 20Y | 357.2 | 356.7 | -0.5 | |
| CHINA 10Y | 171.0 | 171.6 | 0.6 | |
| SOFR M6/M7 | 25.0 | 44.0 | 19.0 | |
| SOFR M7/M8 | -12.0 | -14.5 | -2.5 | |
| SOFR M8/M9 | 3.0 | -2.5 | -5.5 | |
| EUR | 116.59 | 115.22 | -1.37 | |
| CRUDE (CLN6) | 87.36 | 90.54 | 3.18 | |
| SPX | 7580.06 | 7383.74 | -196.32 | -2.6% |
| VIX | 15.32 | 21.51 | 6.19 | |
| MOVE | 70.22 | 75.20 | 4.98 | |

