
CHARTS
April 27, 2025 – Weekly comment
*************************************
(this one appears long, but is mostly pictures)
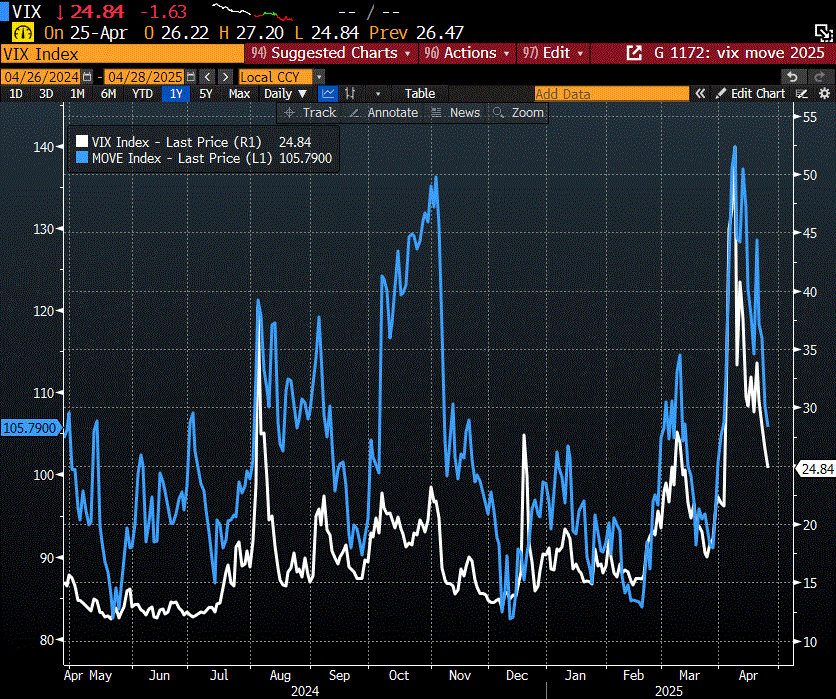
A few charts to see how things have been progressing in 2025: First, VIX and MOVE. Both had serious spikes associated with initial tariff announcements. Both have reverted to more normal levels, at least what I would consider ‘normal’ in the Trump era of disruption.
(The spike in treasury vol in October was associated with the election).
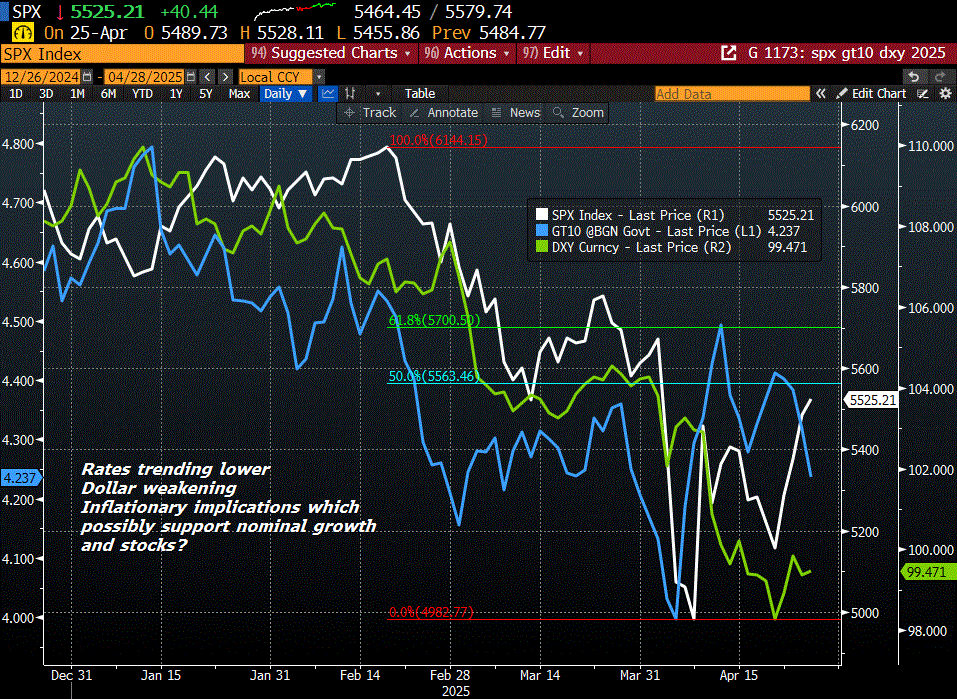
Next, SPX in white, 10y treasury yield in blue, and Dollar Index in green. This week stocks rebounded, nearing the Liberation Day announcement. SPX is right around the 50% retrace from this year’s all-time-high in February, to the early April low. The 10y yield is at February levels, and appears to be trending lower. Dollar index remains pressured. (This chart is ytd, a shorter time frame than others).
Note that on the week, SPX jumped 4.6%, but yields globally were little changed. The US 10y fell 6.1 bps to 4.266% (now a bit under both SOFR and EFFR at 4.30% and 4.33%) while the German Bund ended at 2.47%, same as last week, though well off the March high of 2.897%. 10y JGB is 1.338% even though Tokyo CPI was released last week at +3.5% yoy. BOJ meeting next week, expected to leave target rate at 0.5% and to downgrade growth forecasts.
Now let’s look at commodities. BCOM (purple) looks ‘normal’. A lot of volatility this year but around mid-range. Oil (amber) which is a large component of BCOM is at new lows, and has barely recovered since early April. Gold has powered higher, though it had a pullback this week.

A friend asked me on Friday (paraphrasing), “What if the Trump plan ends up working out? What if, by year’s end, expectations for domestic investment and growth are rebounding? Low energy prices now create forward price increases (inflation) forcing the Fed into tightening?” The thought was that deferred SOFR calendar spreads might rapidly start to move more aggressively positive.
Steepening of forward spreads typically occurs when the central bank is in an easing posture. (because lower rates increase inflation and growth prospects). As an example, the ECB has cut rates in seven steps since last June, from 4% to 2.25%. On June 3, 2024, ERH6/ERH7 was -16.5 (9727.5/9744.0). On April 9 the spread reached +28.5 and is now +24.0 (9834.5/9810.5). From 6/3/24 to 4/25/25 ERH6 rallied 107 and H7 lagged, up 66.5. That’s how it usually works.
Now consider SFRH6/H7. On June 3 it was -19.5, right around the Euribor spread. Right after September’s initial 50 bp cut it reached +14.0. Pretty much according to script. However, since the high on Sept 24, the spread has traded a wide, back and forth range, down to -12.5 in December, up to +12.5 just before inauguration day, and now -8.0. SFRH6 from 6/3/24 to 4/25/25 rallied 72.5, 9600.5 to 9673.0. SFRH7 +61 from 9620 to 9681.

The broad idea here is that Trump’s plan relies on low energy prices (check) low bond yields (check) stabilized equity values (maybe) and perhaps a weaker dollar (check). The outcome COULD be that the Fed only grudgingly eases short term rates, but forward rates start to really jump, and it happens sooner rather than later, taking something like SFRH6/H7 to significant new highs. (Bear steepener). Anyway, that’s the scenario we contemplated in a search for a low cost, high possible reward trade. In my opinion low odds, but most definitely NOT zero.
One last thought and chart related to news this week. There’s a lot coming out: JOLTS on Tuesday, Q1 first estimate GDP on Wed, along with Employment Cost Index and PCE price data, ISM Mfg on Thursday and Payrolls on Friday.
I just want to focus on Wednesday: GDP and inflation. BBG estimate for Advance GDP is 0.4%. However, the Atlanta Fed GDP Now is -2.5% (gold adjusted -0.4%). PCE prices are expected yoy 2.2% from 2.5% last, with Core 2.6% from 2.8%. Pretty close to target.
Consider the following graph.
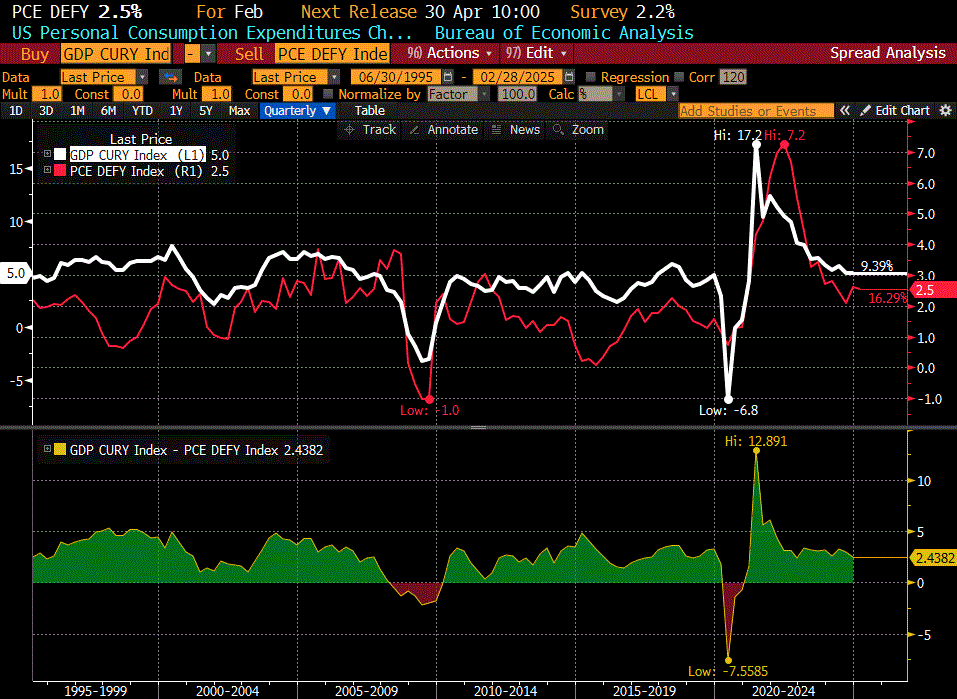
In white in NOMINAL GDP. The only time this fell below zero is GFC and Covid. In red is yoy PCE prices. The bottom panel is the spread, a proxy for real GDP. When it really feels economically crappy is when nominal GDP goes negative. Doesn’t happen very often, and that’s why the Fed has an inflation target. Keep the nominal dollars circulating, and even if there’s significant inflation, debts are being serviced. Now, just imagine that Atlanta GDP is correct, and REAL GDP is -2.5. If PCE prices are right at +2.5%, that means nominal GDP is zero.
The above scenario would most likely lead to a bull steepener as opposed to a bear steepener as discussed above.
We’re an economy of nominal flows, not stock (wealth). That’s why it’s seductive to run real rates negative, hopefully to encourage a nominal rate of growth above funding rates even if the outcome ends up being inflationary. It’s becoming easier to describe current short end rates as being restrictive, and perhaps it’s not a stretch to argue that negative real rates are imperative for the Federal Gov’t to inflate away onerous debt.
| 4/17/2025 | 4/25/2025 | chg | ||
| UST 2Y | 377.7 | 376.2 | -1.5 | |
| UST 5Y | 393.8 | 388.5 | -5.3 | |
| UST 10Y | 432.7 | 426.6 | -6.1 | |
| UST 30Y | 480.6 | 473.6 | -7.0 | |
| GERM 2Y | 168.6 | 171.9 | 3.3 | |
| GERM 10Y | 247.2 | 247.0 | -0.2 | |
| JPN 20Y | 223.6 | 222.4 | -1.2 | |
| CHINA 10Y | 165.4 | 166.1 | 0.7 | |
| SOFR M5/M6 | -90.5 | -95.5 | -5.0 | |
| SOFR M6/M7 | 10.5 | 9.0 | -1.5 | |
| SOFR M7/M8 | 25.0 | 23.5 | -1.5 | |
| EUR | 113.85 | 113.62 | -0.23 | |
| CRUDE (CLM5) | 64.01 | 63.02 | -0.99 | |
| SPX | 5282.70 | 5525.21 | 242.51 | 4.6% |
| VIX | 29.65 | 24.84 | -4.81 | |
| MOVE | 114.64 | 105.79 | -8.85 | |

