Complications
January 15, 2023
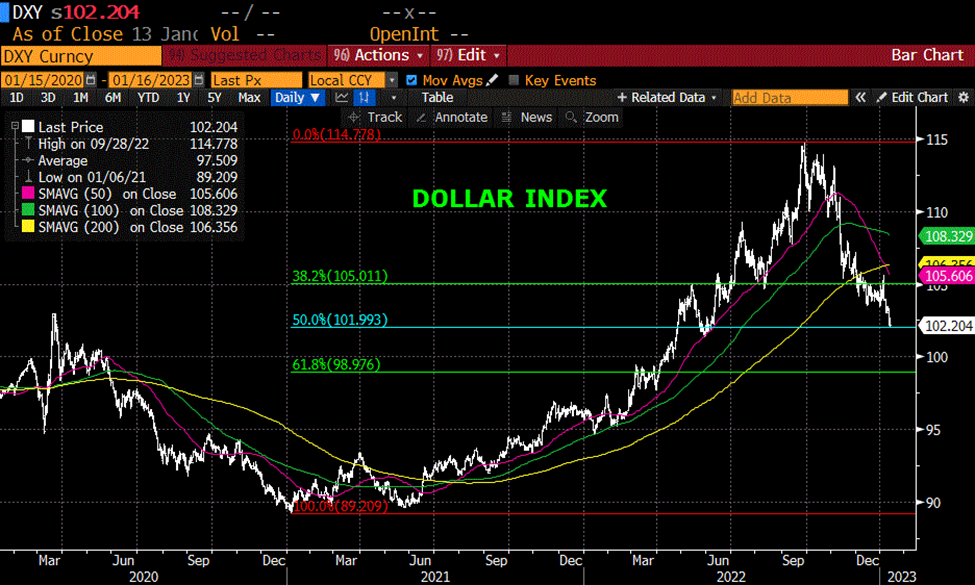
Ironically, last week’s lower CPI data, (-0.1 m/m, 6.5% yoy) and decline in UofM’s 1-yr inflation expectation to 4.0% complicates the Fed’s job going forward. That’s because a general ‘risk-on’ sentiment seems to be taking hold, bolstered in part by the weakening dollar. Below is a chart of DXY, which on Friday printed exactly at the 50% retracement level from the 2020 low of 89.21 to last September’s high of 114.78. That level is 102. The weakening dollar is a large factor with respect to easing financial conditions.
Though there have been a lot of lay-off announcements, the last unemployment rate was still at the historically low level of 3.5%. The problem for the Fed is that solid employment and levitating markets could give rise to a new bout of inflationary impulses. This week SPX gained 2.7% and closed above the 200 DMA. CLH3 (March WTI Crude) was up 8% to 80.11. Copper closed at the highest level since last June. The 10y note yield ended 3.51% Friday, about 75 bps below the high of 4.24 made in October. Short term rate futures have consistently telegraphed easing later this year into 2024, and that pricing was accentuated last week. For example, the most inverted 1-yr SOFR calendar is Sept’23/Sept’24 and it settled as low as -168.5 (-165 settle on Friday, -7.5 on the week), lower than any 1-yr spread going back to 1990. At the end of October SFRU3/U4 was -79. Bitcoin traded above $21k on Saturday!!! (vs $17k one week ago).
The market has now placed near certainty on odds of a 25 bp hike at the Feb 1 FOMC (more on that below). Powell needs to be more emphatic than ever about the need to maintain restrictive rates in order to stifle speculative excess.
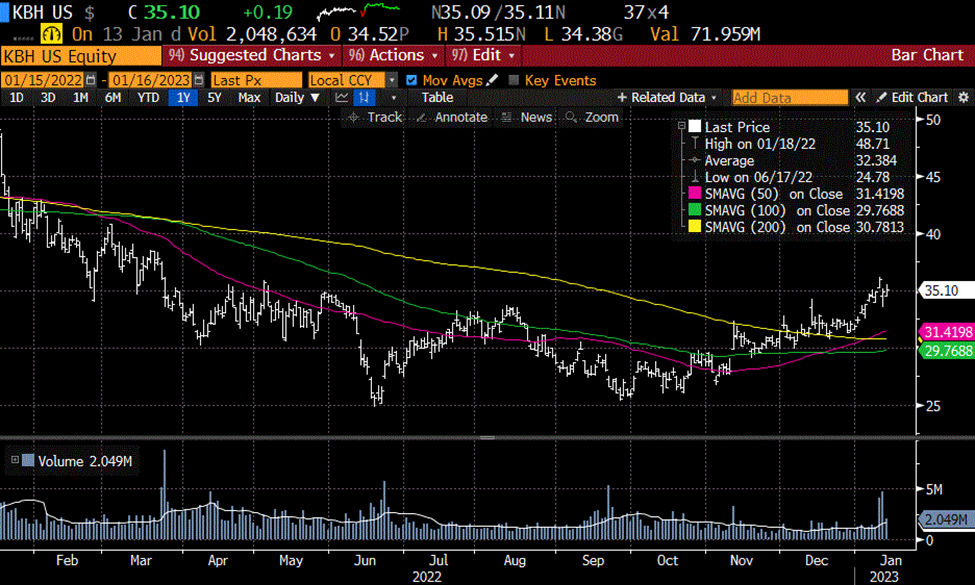
Last week my BBG feed had this headline: ‘KB Home sends warning for Builders’ stocks with miss on orders.’ From the article:
KB Home sank by as much as 6.7%, the most intraday in about four months, after reporting less than 700 new orders in the quarter. That marks an 80% drop from the year before, falling far below consensus analyst expectations for about 2,000 orders…
That’s bad news. 700 orders vs 2000 expected! Yet, look at the stock chart. At 35.10 it’s above the 200 DMA. The stock is 37% above the late September low of 25.51. P/E is 3.7.
I don’t know that one would call the bounce in this specific stock a red flag for general speculative excess, but longer dated treasuries have rallied in the past three months to relatively low yields, and that likely makes the Fed uncomfortable in terms of easier conditions.
Interesting note: Interview featured on BBG with BofA’s Savita Subramanian where she says: “To me, the most encouraging number is if you compare today’s average maturity of debt on S&P balance sheets to that in 2008. Today, debt terms out at about, on average, 11 years. Back in ‘08, it was more like seven years.”
News this week includes Retail Sales on Wednesday, expected -0.8 from -0.6.
PPI also on Wed, expected -0.1 from +0.3. YOY 6.8 from 7.4. Core yoy 4.6 from 4.9.
Beige Book. Philly Fed and Housing Starts Thursday; Existing Home Sales Friday.
20-yr auction ($12b, reopening) on Wednesday. 10-yr tips ($17b) on Thursday.
Davos is this week. From the WEF meeting website: “Gov’ts must act as ‘investors of first resort’ to invite wider private-sector interest and investment in technologies and sectors with the highest potential to build the markets of tomorrow.”
Uh-oh.
https://www.weforum.org/agenda/2023/01/davos-2023-insights-to-read/
OTHER MARKET THOUGHTS
A lot to talk about. If you think there is some possibility of a 50 bp hike at the Feb 1 meeting, then the easiest trade is to SELL FFG3 at 9541 (settled 40.5). Many officials have blessed 25, including Bostic (non-voter/Atl, if CPI cools would lean 25), Harker (voter/Philly “25 appropriate going forward”), Barkin (non-voter/Richmond), Collins (non-voter/Boston leans for 25). What happens if the market expects 25, but the Fed hikes 50. Stocks should break, 30-yrs rally?? Short term debt instruments will get hit. A sale of FFG3 here is an easy hedge for those long notes 5 years and in, or long stocks. Risk 2 bps to make 22.
There is plenty of press coverage regarding inverted spreads, but the one I flagged Friday is interesting in its simplicity. It covers the first half of 2024, so one year forward (and as you may have noticed, a lot can change with respect to market pricing in one year) and it’s a nice round figure. Namely FFF4/FFFN (9552.5/9653.5) settled -101. There are 4 FOMC meetings within this six-month period. The schedule for 2024 isn’t out yet, but I suspect the first 2024 meeting will be Jan 31. The Fed targets Fed Funds, it’s a six-month spread over 4 meetings, and it’s inverted almost exactly 100 bps.
Just to expand on this thought, let’s look at 6-month increments. FFF3/FFN3 spread is +59.25 (9566.75/9507.5). Of course, the front Jan contract is now pegged to EFFR at 433. So in the next 4 FOMCs the market estimates about 60 bps of tightening. Then FFN3/FFF4 is -45.0 (9507.5/9552.5). There is almost as much easing priced for the last four meetings of the year as there is tightening for the next four. It’s worth noting that July’23 contract is now the lowest on the FF strip at 9507.5, or 4.925%
I wanted to review a trade from the end of last year: Someone paid -2 (took 2 bp credit, buying lower strike) for SFRZ3 9550/9600/9650 c tree around 9552. I was chatting with a guy in the pit at the time who said this particular trader has a very high percentage of wins. In pit vernacular “He’s never wrong”. Anyway, I checked the trade on Friday, it was +6, but my friend told me the guy had exited at +4. Settlement price Friday was 6.25 vs 9560 (41.75/23.0/12.5). Net change was exactly as much in the call tree as in the futures!
SFRZ3 settled 9560, up just 0.5 on the week. The 9562.5 straddle continues to be shit upon, that is to say, compress, closing at 74.5 after having been sold heavily at 82 to 80.5 during the week. At the end of last year, just two weeks ago, SFRZ3 atm straddle was 100 with futures right around strike of 9550. Breakeven 3.5% to 5.5%. Now with the 9562.5^ at 74.5, breakevens have tightened considerably, 9488 or 5.12% to 9637 or 3.63%. The downside breakeven is exactly where the Fed’s end-of-year 2023 FF projection is. This decline in vol was, of course, instrumental in the profitability of the call tree cited above.
| 1/6/2023 | 1/13/2023 | chg | ||
| UST 2Y | 425.8 | 423.4 | -2.4 | |
| UST 5Y | 371.2 | 361.1 | -10.1 | |
| UST 10Y | 356.9 | 350.9 | -6.0 | |
| UST 30Y | 369.2 | 361.9 | -7.3 | |
| GERM 2Y | 258.1 | 259.2 | 1.1 | |
| GERM 10Y | 221.0 | 216.8 | -4.2 | |
| JPN 30Y | 159.7 | 161.0 | 1.3 | |
| CHINA 10Y | 283.5 | 289.8 | 6.3 | |
| SOFR H3/H4 | -96.5 | -97.5 | -1.0 | |
| SOFR H4/H5 | -101.0 | -101.5 | -0.5 | |
| SOFR H5/H6 | -6.5 | -8.5 | -2.0 | |
| EUR | 106.44 | 108.33 | 1.89 | |
| CRUDE (CLH3) | 74.04 | 80.11 | 6.07 | |
| SPX | 3895.08 | 3999.09 | 104.01 | 2.7% |
| VIX | 21.13 | 18.35 | -2.78 | |

