
Current Inflation High, Forward Measures Low
June 14, 2025 – weekly comment
Last CPI 4.2. Last PPI 6.5. U Mich 1yr inflation expectations 4.6 and 5-10 yrs 3.4. Ten year treasury yield 4.485, suggesting tiny, if any, real yield. PCE prices yoy 3.8 last with Core 3.3. Core has been above the Fed’s 2% target for five years.
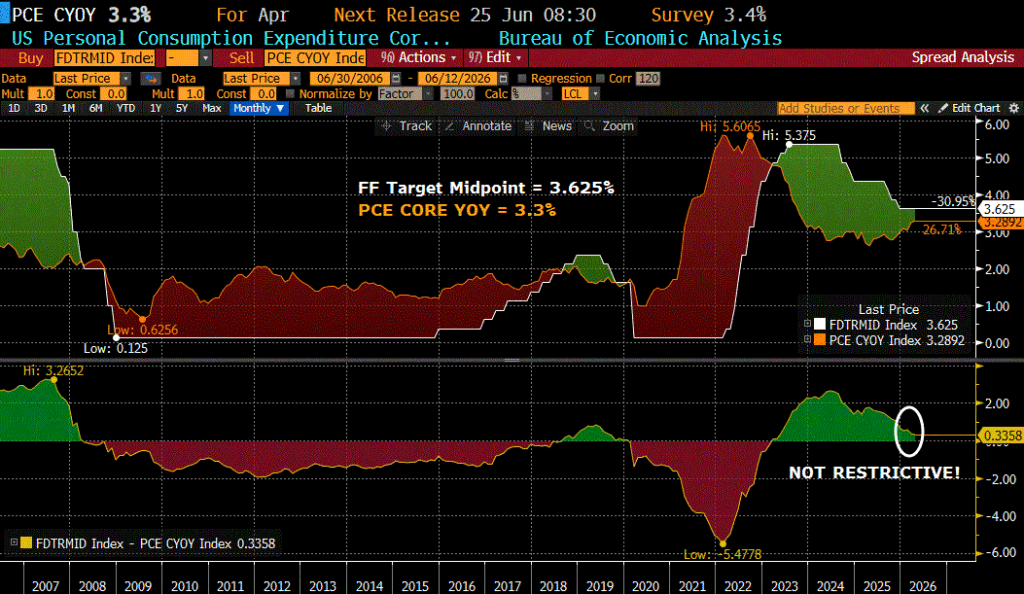
The spread between FFs and Core PCE is now just 33 bps as inflation measures have risen since the middle of last year. No longer restrictive. The 5y treasury yield and the last CPI are identical at 4.2%.
However, in the past month, the 5y breakeven has plunged from 271 bps to 241. Ten year from 252 to 232. The 5y/5y forward inflation swap from 249 to 239. The rolling front month WTI contract has fallen from 113 in April to 85 last. The WTI futures curve suggests 74 by next year. These moves imply the Fed can look through the most recent inflation data.
Jan Fed Funds are 9617 or 3.83, 21 bps above current EFFR of 3.62 (one hike by end of year). But SFRU6/SFRU7 settled at just 22. Again, maybe a hike over that year.
The unemployment rate has been 3.9 to 4.5% for the past two years, last 4.3%. The inflation mandate is clearly more dominant. However, recent market action suggests that inflation will recede even as Q2 GDP Now from the Atlanta Fed has the last estimate at +3.3%.
Warsh’s first FOMC as Chair is Wednesday. Several Fed members have recently said the Fed may need to be more restrictive given persistent inflation (Logan, Hammack, Kashkari…). What should Warsh do? My guess is that he will shift the balance of risks toward inflation without changing rates. Talk tough. Forward guidance in all but name, which would likely pressure the curve further and may cause long rates to decline.
The curve has already been flattening since February, with 2/10 peaking at 72 and now 39. Red to gold SOFR pack spread (2nd year forward vs 5th year forward) was over 60 in February and settled Friday at just 4.25. These moves have already telegraphed a Fed on hold. Despite the highest CPI and PPI readings since 2023 last week, US treasury yields actually eased slightly, with 2s down 7.2 bps to 4.083%, tens down 5.4 bps to 4.485%. The 10/30 treasury spread (rough proxy for term premium) is 49 bps, down 20 bps from the January high. MOVE index fell this week from 75.2 to 69.4, suggesting little stress in treasuries. VIX Friday to Friday, 21.51 to 17.68.
SPCX debuted with a market cap over $2T. However, from Friday to Friday, these 7 stocks lost nearly $700B in value: AAPL, MSFT, GOOGL, ORCL, AMZN, META and PLTR. Certainly indicates swapping out into the new IPO…and perhaps not as much access to leverage.
In sum, the week wasn’t particularly dramatic in terms of price action. FOMC and Retail Sales on Wednesday, expected +0.5%.
Below are a couple of interesting excerpts:
Pimco’s Richard Clarida, Andrew Balls and Daniel Ivascyn said in the firm’s latest annual secular outlook report that ‘the default cycle is reasserting itself, and we expect significantly higher losses in lower-quality credit such as leveraged and private direct lending’… Pimco said that backdrop clashes with ‘elevated secular uncertainty,’ and ‘we interpret this as complacency rather than strength.’ While the US economy has been resilient, ‘AI will disrupt old economy companies, especially highly levered ones.’” –From the Credit Bubble Bulletin
“S&P 500 index investors, or just people who own most of the mega-cap, Mag-7, big tech names, there is pretty much exposure to a lot of this IPO mania whether you like it or not, and whether the indexes you own include them or not. Not only do names like Nvidia, Meta, Microsoft, Google, and Amazon all have massive cap table positions in a bunch of these mega AI names, but it turns out an unfathomable amount of the “earnings growth” of the index last quarter was just these companies marking up the value of these private AI names that they own. $69.2 billion of “profits” were “other income” from just THREE companies (Google, Nvidia, Amazon). This accounts for a staggering 12% earnings growth year-over-year, making the “operating earnings” growth far, far more understandable (though still quite robust, it should be said).” — David Bahnsen as edited in John Mauldin’s missive.
OTHER THOUGHTS / TRADES
Big trade in bonds Friday was USN 111/110ps buyer; settled 10/64 ref USU6 112-12 (30y cash yield 4.972%).
Early buy: USN 111/110p 1×2 for 0 (25k) then buying of 111/110ps. Volume 133k 111p and 179k 110p. Settled 19/9 or 10/64, USN 111p delta -0.24. USN 110p delta -0.12. Two weeks until expiration 26-June. Open interest in both strikes is now 109.5k, up 93k on Friday in 111p and up 43.6k in 110p.
DV01 on USU contract is $134.30. 30y treasury 5.0% of 5/56 has DV01 $155.50. The bond future is closer to the 20y, with DV01 $125.70 (auction this week). In any case, the 111 strike is currently about 11 bps away. Given 30y yield 4.97, that would indicate 5.08 in the long bond, but on Thursday as USU printed 111-01 the yield was more like 5.04. High yield print May 20 was 5.20; futures printed a low of 108-31.
| 6/5/2026 | 6/12/2026 | chg | ||
| UST 2Y | 415.5 | 408.3 | -7.2 | |
| UST 5Y | 427.4 | 421.1 | -6.3 | |
| UST 10Y | 453.9 | 448.5 | -5.4 | |
| UST 30Y | 500.0 | 497.2 | -2.8 | |
| GERM 2Y | 268.8 | 261.5 | -7.3 | |
| GERM 10Y | 303.8 | 299.4 | -4.4 | |
| JPN 20Y | 356.7 | 352.6 | -4.1 | |
| CHINA 10Y | 171.6 | 174.1 | 2.5 | |
| SOFR U6/U7 | 28.5 | 22.0 | -6.5 | |
| SOFR U7/U8 | -14.0 | -11.0 | 3.0 | |
| SOFR U8/U9 | 0.0 | 2.0 | 2.0 | |
| EUR | 115.22 | 115.68 | 0.46 | |
| CRUDE (CLQ6) | 87.99 | 83.35 | -4.64 | |
| SPX | 7383.74 | 7431.46 | 47.72 | 0.6% |
| VIX | 21.51 | 17.68 | -3.83 | |
| MOVE | 75.20 | 69.36 | -5.84 | |

