
Disinflationary Bounce
June 28, 2026 – Weekly Comment
****************************
The week featured lower yields in the context of a slight bounce in the curve, as inflation proxies fell. CLQ6 (WTI) settled at a new recent low 69.23, down 30% from May’s high. One-year CL calendar U6/U7 settled 2.93, from a high mark over 19.00 in May. Ten year breakeven, treasury minus tip yield, ended at a new low of 221 bps, nearing the April 2025 tariff low. In May the breakeven hit 252 bps. Truflation reading for June is only 1.93%. Zillow yoy rent index as of May was just 2.03% though CPI rent for May was 3.23%. On Thursday, PCE Price index yoy was as expected at +4.1%, but the market is tentatively looking past current inflation, and is focusing on forward measures.
https://en.macromicro.me/collections/5/us-price-relative/49740/us-cpi-rent-zillow-rent-yoy
I believe there is a lurking suspicion that capital for AI is becoming more circumspect about potential rewards. The lower end consumer, with paltry wage gains, is not driving price increases. The high end consumer, with strong capital gains so far, has driven consumption and inflation. If the confidence level in AI falters and capital runs dry, the impact will not only be on capex, but also high-end consumption.
I’m not sure how accurate this site is, but https://www.numerator.com/prime-day/ tracks Amazon’s Prime Days.
The average Prime Day 2026 order size was $47.66, down from $53.34 in last year’s Prime Day early read. Nearly two-thirds (63%) of households shopping the event placed two or more separate orders, bringing average household spend to approximately $143.45, down from $156.37 last year.
Lower prices, lower total spend in a supposedly inflationary economy.
Oracle 5y CDS last is 172 bps, nearing the March high of 198, up from 37 bps one year ago. By contrast, MSFT 5y CDS is 43, but that’s up from 20 bps a year ago. ORCL stock ticked over 250 on June 1, now just below 150.
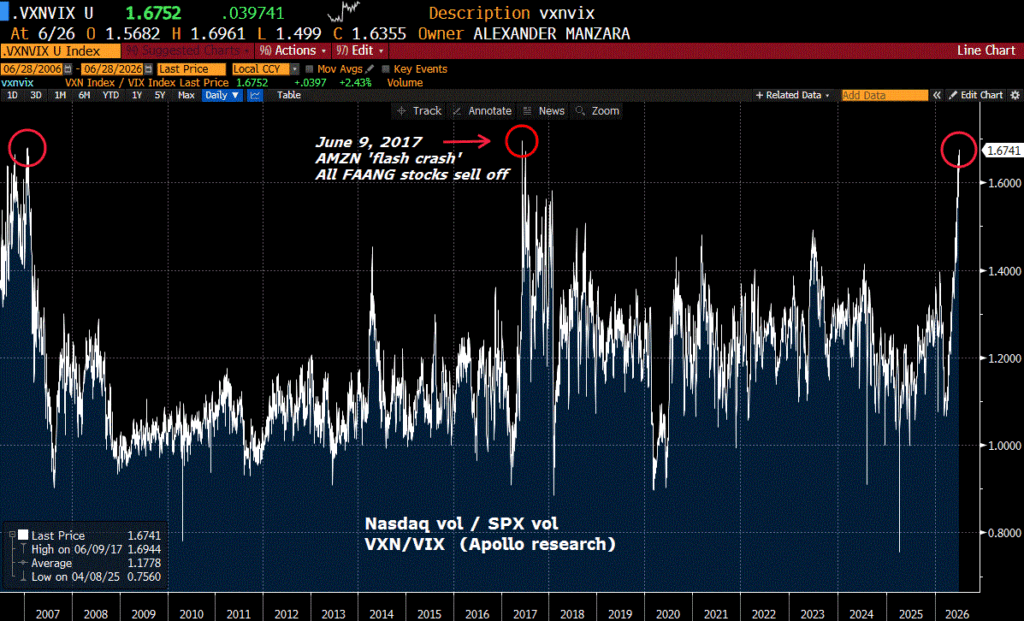
Last week on a daily note I posted the following chart, attributed to Apollo, VXN/VIX. Nasdaq vol / SPX vol…a measure of possible stress in the hi-tech arena. Current measure is 1.67, high since late 2002 (not pictured on chart). The absolute high in February 2001 was 2.73, so we’re not yet close, but gaining.
The US 5y note was the leader of the week, falling 10 bps to 4.128%. That’s exactly 50 bps above the current Fed Effective rate of 3.63%. Tens eased 7.7 bbps to 4.372% and thirties fell 3.6 to 4.864%. On the SOFR strip, the lowest near contract remains SFRH7 at 9599 or 4.01%, up 13.5 on the week from 9585.5. Every SOFR contract in the two year stretch from March ’28 to March’30 is between 9622.5 and 9629 or around 3.75%, the upper end of the current FF range (3.5 to 3.75%). As of the end of the week, futures prices simply aren’t pricing for a series of inflation-fighting hikes. Rather, they are taking a wait-and-see attitude. That could, of course change, as the tenuous cease-fire with Iran seems to be at risk of collapsing over the weekend.
Going into quarter/half end, a piece of Fed research is salient. ‘Decomposing Hedge Funds’ U.S. Treasury Exposures’ by PJ Monin. Of course, portfolio rebalancing has likely also driven some of the moves in the past week.
https://www.federalreserve.gov/econres/notes/feds-notes/decomposing-hedge-funds-u-s-treasury-exposures-20260622.html
“We find that highly leveraged arbitrage strategies dominate hedge funds’ Treasury positioning. The Treasury cash-futures basis trade has grown to approximately $830 billion as of September 2025, about double its previous peak in early 2020 and representing 35% of hedge funds’ total long Treasury exposures. The swap spread arbitrage trade reached approximately $305 billion (13%) by September 2025, though it experienced notable stress following the April 2025 tariff announcements when about $60 billion unwound rapidly before recovering within months. Beyond these directly estimated arbitrage trades, we identify substantial positioning in broader trade categories: maturity-matched trades (including on-the-run/off-the-run arbitrage and other strategies with approximately equal durations) totaling $395 billion (17%), and steepener-like trades totaling $375 billion (16%).”
Charts in this paper show an explosion in basis trades since late 2022, early 2023. Could lead to funding tightness this week.
News this week includes Conf Board Consumer Confidence and JOLTS on Tuesday. Former expected 94.6 from last of 93.1. (Confidence remains weak). JOLTS had a big bounce last week to 7618, but is expected to revert lower to 7288. For the past two years JOLTS has been at a relatively low level, ranging from 6550 to 7618.
Wednesday includes ADP (exp 119k) and ISM Mfg at 53.9. Payrolls on Thursday expected 115k with an Unemployment rate of 4.3%.
Warsh speaks at the ECB Forum on Central Banking in Sintra, Portugal on Wednesday (with Lagarde, Bailey and Macklem).
Future: Next FOMC July 29
Jackson Hole Symposium is 27-29 August
| 6/18/2026 | 6/26/2026 | chg | ||
| UST 2Y | 418.1 | 408.8 | -9.3 | |
| UST 5Y | 422.8 | 412.8 | -10.0 | |
| UST 10Y | 444.9 | 437.2 | -7.7 | |
| UST 30Y | 490.0 | 486.4 | -3.6 | |
| GERM 2Y | 260.4 | 251.5 | -8.9 | |
| GERM 10Y | 292.8 | 285.0 | -7.8 | |
| JPN 20Y | 350.5 | 351.8 | 1.3 | |
| CHINA 10Y | 172.5 | 172.4 | -0.1 | |
| SOFR U6/U7 | 10.0 | 5.5 | -4.5 | |
| SOFR U7/U8 | -20.5 | -19.5 | 1.0 | |
| SOFR U8/U9 | -0.5 | -0.5 | 0.0 | |
| EUR | 114.58 | 113.84 | -0.74 | |
| CRUDE (CLQ6) | 75.88 | 69.23 | -6.65 | |
| SPX | 7500.58 | 7354.02 | -146.56 | -2.0% |
| VIX | 16.40 | 18.41 | 2.01 | |
| MOVE | 65.39 | 66.79 | 1.40 | |

