
Erreurs ont été commises (Errors were made)
June 16, 2024 – Weekly Comment
************************************
“When I make a mistake, I don’t make it twice. I make it 20 times.” – Jimmy Place (Warrior podcast)
SOFR calendars made new recent lows as the Fed pushed easing further out on the calendar with the dot plot indicating just one ease for 2024 (and 4 more in 2025). CPI data was lower than expected – another tailwind for rate futures. Accentuating the move was Macron’s decision to call snap elections in France, which sparked turmoil in European spreads.
All treasury contracts completely erased lingering bearishness from the previous Friday’s NFP (and then some). With June SOFR options having expired, I moved the front spreads to September contracts. The chart below is a constant maturity 3rd to 7th SOFR future spread (bottom panel is spread). For the past three months this chart represents SFRU4/SFRU5, at a level of -112 (9487.5/9599.5). Next week on BBG, U4U5 will be 2nd to 6th.
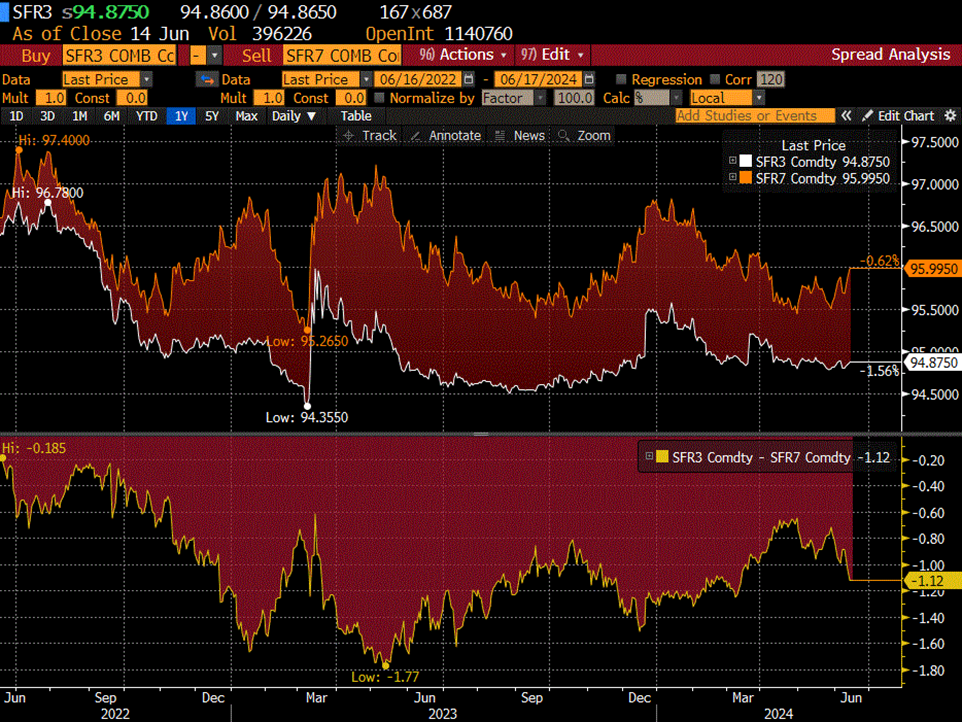
The exact syntax isn’t important, it’s that calendar spreads are making new recent lows. I used a two-year snapshot in order to capture absolute lows associated with the SVB failure and fallout. At that time, in May 2023, the 3rd to 7th spread posted a low of -177 and 2nd to 6th (what I would consider the front spread) was -192. Those levels reflected potential easing of the magnitudes seen in 2001 and 2007-08, when the Fed slashed a couple of hundred basis points over a few quarters. Obviously, SVB was a false alarm, and relatively contained. Therefore, calendar spreads rallied as deferred contracts sold off in summer and fall of 2023, i.e. easing assumptions compressed. As can be seen on the chart, the current decline is a function of deferred contracts rallying. On the top panel the SFRU4 contract is in white; the move has been sideways. SFRU5 is in amber. Last week SFRU4 rallied 6.5 bps, while SFRU5 and Z5 had the biggest jumps on the curve, +30 to 9599.5 and +30.5 to 9615.0. The ten-year yield declined 22 bps on the week to 4.209%.
In terms of European angst, I would just note that SX7E, the EuroStoxx Bank Index is down 10% from the high posted in mid-May. At 133.73 it’s back where it was in mid-March. The CAC 40 is down 8.9% from mid-May (down 5% last week). By comparison, DAX is only down 4.6% from May’s high.
In the US, the ratio of RTY/NDX (Russell 2k to Nasdaq 100) made a new historic low this week of 0.102. That’s even lower than the dotcom bubble of March 2000, when the ratio low was 0.12.
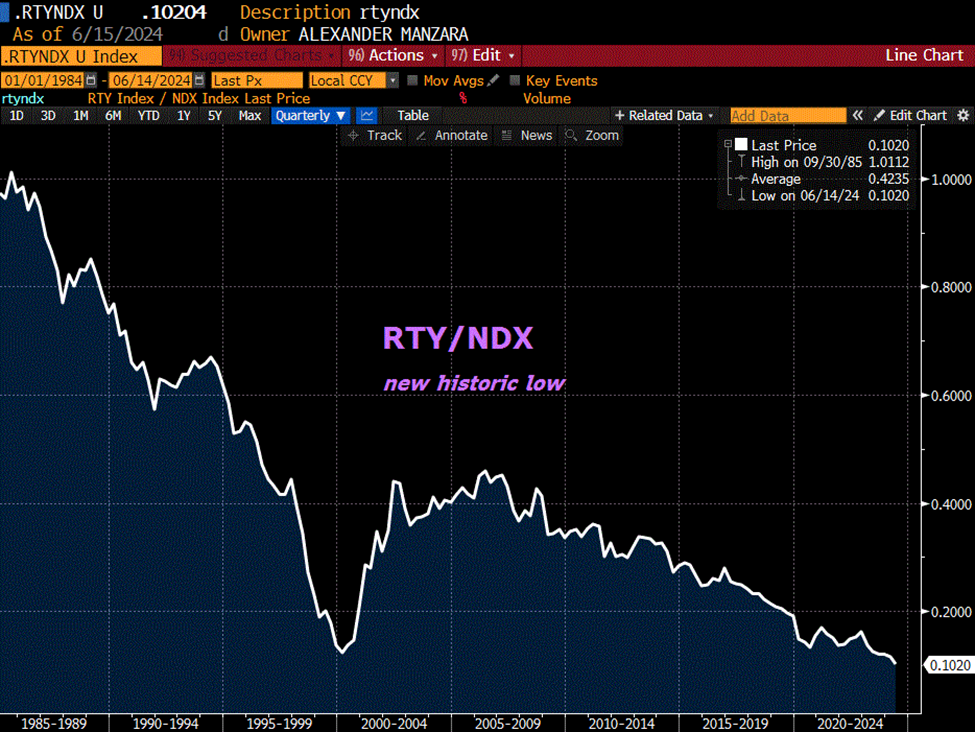
MSFT, AAPL and NDVA combined are at a record 21% weighting of the S&P500, and each sports a market cap over $3T (each one larger than the total cap of Russell 2k). It’s worth noting that RTY is actually DOWN 1% on the year. However, RTY is handily outperforming KRE (the US regional bank index) which is down 12% ytd.

There’s a clip in The Big Short where Brownfield Capital (Charlie Geller) suggests shorting AA tranches of CDOs, because when the bad stuff implodes, the AAs will also be pulled down. I was taught, and I try to adhere to this rule: short the weakest stuff, not the strongest. Markets typically crash, not from highs, but when they have already been cut in price. So, I am NOT suggesting that anyone follow my lead and buy AAPL puts like I did last week. (Hence the Jimmy Place* quote at top). There’s just no way I buy into the AI hype for AAPL. To cite another line from The Big Short: “It’s possible we’re in a completely fraudulent system.” -Dr Michael Burry.
My sense is that the US consumer is well underway in a process of retrenchment. On Tuesday, Retail Sales may (or may not) buttress that assumption, expected +0.3% m/m and +0.4% ex-auto and gas. Credit card delinquency rates, all commercial banks, are at a new cycle high of 3.16% in Q1 (though lower than they were from the 1990’s going into the GFC). However, credit card delinquency rates in banks not among the largest 100 are at a RECORD high 7.79%. (Short the weakest).
Housing data later in the week. XHB, the homebuilder ETF has been sideways from 100 to 110 since late Feb.
OTHER THOUGHTS / TRADES
FFQ4 settled 9470.5, up just 1.5 on the week. This contract captures the July 31 FOMC, and indicates about a 15% chance of a 25 bp cut. FFV4 captures the Sept 18 FOMC, and it settled 9487 or 5.13%, 20 bps lower in yield than the current Fed Effective of 5.33%. The market is betting on a Sept ease…
August options on SFRU4 expire 16-August. As of now, it’s unlikely that the Fed would ease in July. But IF that were to happen, then the Sept 18 FOMC would be in play as well. The August CPI number is 8/14 and Jackson Hole is August 22-24 (Just after the August 19-22 Democratic Convention in Chicago). SFRQ4 9500/9512.5cs settled 1.25. Reasonable wildcard buy.
Note that Friday July 5 is a normal trading day. The Employment Report is scheduled for release on that Friday, though July 4 will only have an abbreviated futures session (for trade date 7/5).
This Wednesday is also an abbreviated screen session. Might not be at desk, pending Tues conditions.
| 6/7/2024 | 6/14/2024 | chg | ||
| UST 2Y | 487.0 | 468.3 | -18.7 | |
| UST 5Y | 445.2 | 422.4 | -22.8 | |
| UST 10Y | 442.8 | 420.9 | -21.9 | |
| UST 30Y | 454.7 | 434.9 | -19.8 | |
| GERM 2Y | 308.3 | 276.3 | -32.0 | |
| GERM 10Y | 262.0 | 236.0 | -26.0 | |
| JPN 20Y | 176.5 | 173.9 | -2.6 | |
| CHINA 10Y | 231.0 | 229.7 | -1.3 | |
| SOFR U4/U5 | -88.5 | -112.0 | -23.5 | |
| SOFR U5/U6 | -41.0 | -38.5 | 2.5 | |
| SOFR U6/U7 | -10.0 | -7.5 | 2.5 | |
| EUR | 108.18 | 107.05 | -1.13 | |
| CRUDE (CLQ4) | 75.22 | 78.05 | 2.83 | |
| SPX | 5346.99 | 5431.60 | 84.61 | 1.6% |
| VIX | 12.22 | 12.66 | 0.44 | |
*Jimmy Place (ACE if I recall correctly) was a filling broker in Eurodollar futures in the heyday of the contract.

