
For What It’s Worth
December 14, 2025
*********************
There’s something happening here
What it is ain’t exactly clear
There’s a man with a gun over there
A-telling me I got to beware
-Buffalo Springfield – For What It’s Worth
This song keeps running through my mind, originally released in 1966, a protest ballad of the day which rings true right now.
There’s battle lines being drawn/Nobody’s right if everybody’s wrong
Luke Gromen was on Jack Farley’s podcast last week, Monetary Matters. Gromen’s thesis: the US needs to build out massive infrastructure (refineries, electrical grid, industrial capacity) to compete with China in both AI and military spheres. It takes time and resources. China has already done the groundwork and continues to secure critical supplies. Gromen sees the choices for the US as either: sacrifice the bond market and the USD (reshore manufacturing and supply chains) or move back to the model of letting China dominate manufacture of industrial goods, rare earths, and AI. Yield curve control and inflation are likely outcomes.
I’m not sure I agree or even completely appreciate his logic. But here’s what I do know. Bond yields are pointing up on the chart. I try to trade with the trend.
In mid-2004, the Fed starting raising rates in 25 bp increments at every FOMC. Just before rate hikes actually began, the 10y yield was 4.85% and the 30y was 5.50%. On February 16, 2005, after the Fed had already raised FFs from 1.0% to 2.5%, Greenspan made his famous “conundrum” comment, “For the moment, the broadly unanticipated behavior of world bond markets remains a conundrum.” Bond yields/forward rates had actually FALLEN, and by early Feb the 10y was 4.15% or about 70 bps lower than pre-hike and the 30y was 4.55%, nearly 100 lower. In fact, by the end of the hike cycle in mid-2006, FFs, 10s and 30s were ALL 5.25%.
Before I get to today’s bond market dynamics, here’s another interesting clip from Greenspan’s speech:
More broadly, rising home prices along with higher equity prices have outpaced the rise in household, largely mortgage, debt and have pushed up household net worth to about 5-1/2 times disposable income by the end of last year. Although the ratio of net worth to income is well below the peak attained in 1999, it remains above the long-term historical average.
Here’s a link to St Louis Fed’s chart on Net Worth/Disposable Personal Income. It shows 1990 NW/DPI around 520%, early 2005 at 650% and now at a near-record 782%.
https://fred.stlouisfed.org/series/HNONWPDPI
In any case, today’s conundrum is quite the opposite. The Fed has been CUTTING rates and long-end yields have gone UP, as the chart below shows. In late 2023 after the rate hike cycle ended with FFs 5.375% mid, the 10y peaked at 4.99 and the 30y 5.11. Just prior to the first cut in September 2024, the 10y yield was 3.62 and the 30y 3.93. Now, after 175 bps of FF easing, the 10y is 57 bps higher at 4.19 and the 30y is 93 higher at 4.86.
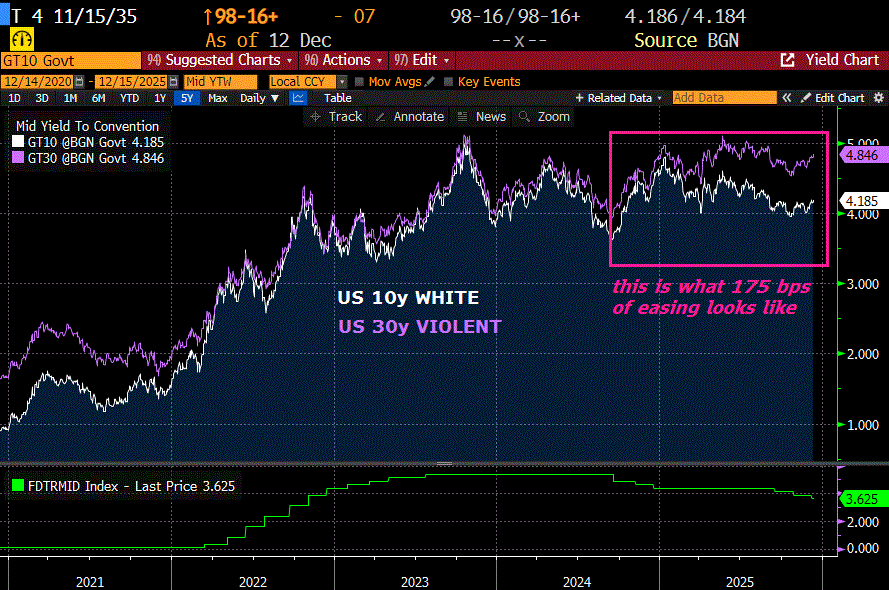
Something’s happening here. What it is ain’t exactly clear. But it sure looks like a combination of inflation fears and a jump in term premium. A Trumpian Fed Chair that cuts rates further is only likely to exacerbate the issue.
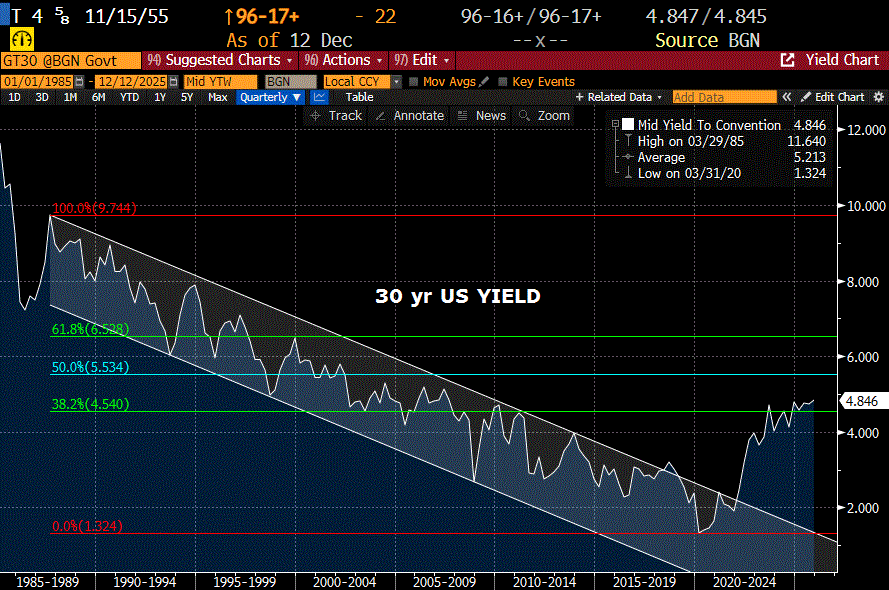
I would define the modern downward bond yield channel as starting in 1987 at 9.75% and ending in 2020 at 1.32%. The halfway mark is 5.53, around levels from 25 years ago in 2001. It sounds far away but looks completely reasonable on the chart.
While inflation could edge lower as shelter costs ease, supply chain pressures will likely keep a floor under disinflationary impulses. The risk to a forecast of higher bond yields may be deflating equities. However, given wealth effects and potentially lower capital gains revenue, the market may perceive that weaker equities lead to US budget strains with more supply/deficits.
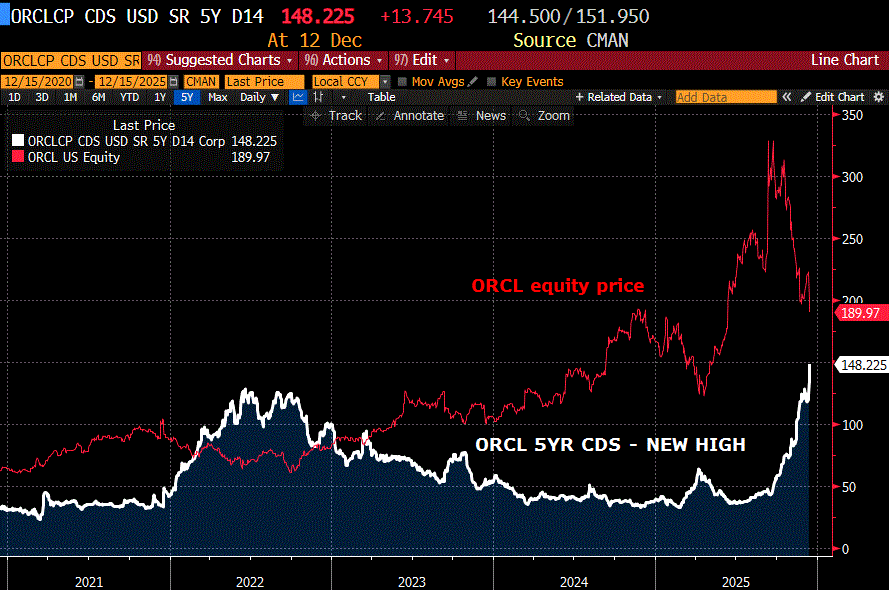
This note is a bit long so I will save other topics for later, but I am adding a chart of Oracle stock and CDS price. My thesis is that the US public was generally united in the goal of winning the Space Race. After that, the goal of winning the Cold War and even the War on Terror had broad support at the time. I’m not so sure the public sees winning AI as a laudable national objective.
OTHER THOUGHTS/ TRADES
ADP and Nov payrolls are released on Tuesday. NFP expected 50k and Unemp Rate 4.5%. Recall that during the FOMC press conference Powell said payrolls might be overstated by as much as 60k per month [due to birth/death model]. The market is probably already leaning for weak data. What if it’s stronger than expected? Side note, StoneX’s Vincent Deluard says that US income tax collections are running at an 8 to 10% growth rate (nominal) over the past year.
BOJ meeting at end of week, with 10y JGB pinned near the high at 194.6% and the 20y at 2.905%. US issues $13b 20-yr on Wednesday. Current yield 4.81.
This week US 2/10 spread ended at a new high 66 bps. Last time it was here was Jan 2022, prior to the start of the rate hike cycle. High in 2021 was 157, but that was with FF at 0-0.25. US 5/30 ended 111 bps vs a high this year of 124 in Sept.
Chart below is US 30y yield in green and US bond vol in white. MOVE looks similar but the real focus should be on the possible breakout of the long-end yield and US puts. MOVE weighting is 20% for 2y, 5y and 30y and 40% 10y.
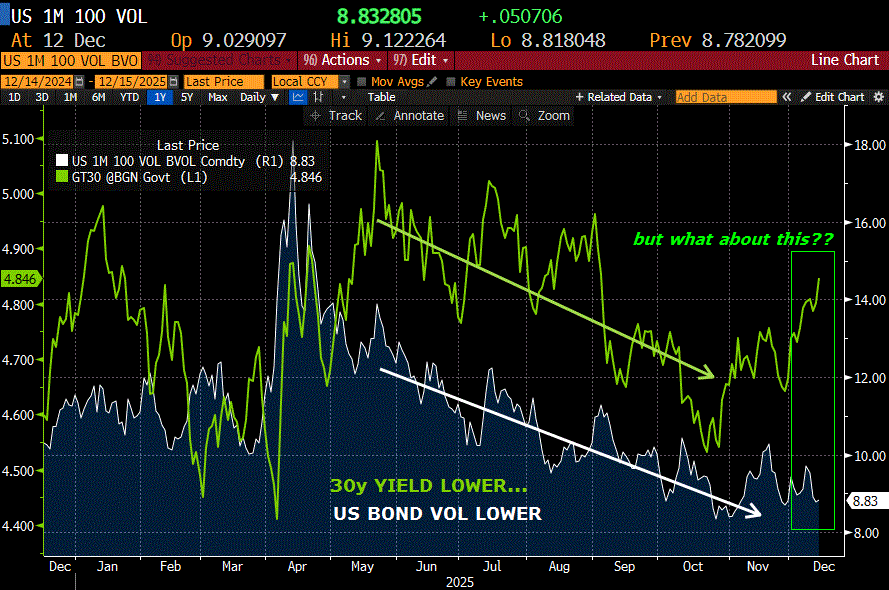
This chart is begging for bond vol to be bought.
According to BBG CMS screen, it’s still the case that a rise in USH contract of 50 bps (estimated at 108-17) will result in a longer duration Cheapest-to-deliver. Current CTD is 4.75 of 11/43, with a DV01 of $119.5. With a conversion factor of 0.8657 that makes DV01 on the contract $138. But a shift of 50 bps higher would make 3.625 of 2/44 cheapest, DV01 108.90, factor 0.7427, contract DV01 $146. It appears the market is underpricing otm bond puts.
| 12/5/2025 | 12/12/2025 | chg | ||
| UST 2Y | 356.2 | 352.6 | -3.6 | |
| UST 5Y | 371.5 | 374.7 | 3.2 | |
| UST 10Y | 413.7 | 419.2 | 5.5 | |
| UST 30Y | 479.1 | 485.7 | 6.6 | |
| GERM 2Y | 209.3 | 215.2 | 5.9 | |
| GERM 10Y | 279.7 | 285.6 | 5.9 | |
| JPN 20Y | 291.1 | 290.6 | -0.5 | |
| CHINA 10Y | 183.1 | 183.7 | 0.6 | |
| SOFR H6/H7 | -43.0 | -37.0 | 6.0 | |
| SOFR H7/H8 | 13.5 | 17.5 | 4.0 | |
| SOFR H8/H9 | 18.5 | 20.0 | 1.5 | |
| EUR | 116.42 | 117.42 | 1.00 | |
| CRUDE (CLG6) | 59.78 | 57.24 | -2.54 | |
| SPX | 6870.40 | 6827.41 | -42.99 | -0.6% |
| VIX | 15.41 | 15.74 | 0.33 | |
| MOVE | 67.28 | 69.25 | 1.97 | |

