
Household Real Estate Stress
November 30, 2025 – Weekly comment
******************************************
According to the St Louis Fed website (FRED) :
Household Owners’ Equity in Real Estate as a Percentage of HH RE (Household Real Estate) has soared since the GFC, and is now 72.5%, the highest level since before 1960. The low in 2012 was 46%. Most people are surprised by this number. It is clearly skewed by age and affluence.
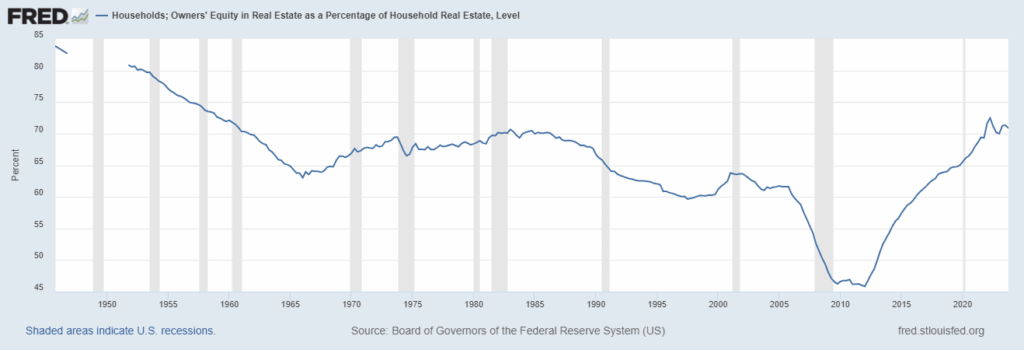
Household Equity as a Percent of HH Real Estate
According to the Fed’s Quarterly Z.1 report, HH & nonprofits Real Estate at Mkt Value is $53.22T. The HH part of that is $49.3T. The St Louis FRED site shows HH Owner Occupied RE Mkt Value as $47.3T. According to the NY Fed’s HH Debt and Credit Report, the amount of Mortgage Balances at end of Q3 2025 was $13T (13/47.3 = 27.5%, so that squares with the 72.5% of equity).
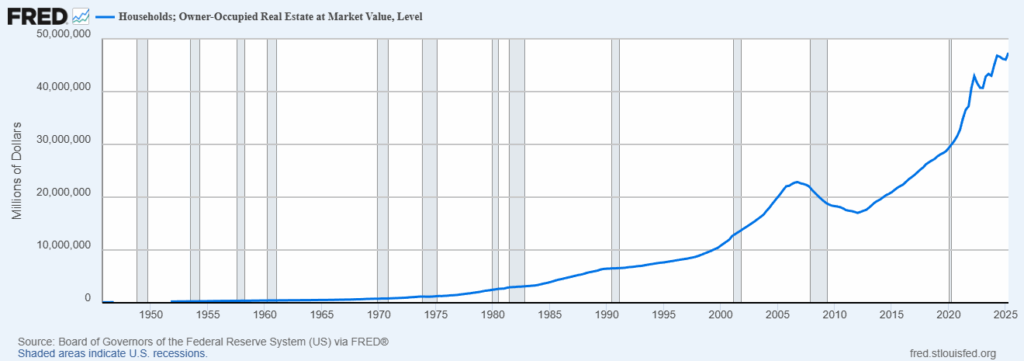
HH Owner Occupied Real Estate Market Value
The above chart shows that HH RE market value has risen from about $23T pre-GFC to $47T now, a bit over double. By contrast, total US equity market cap has more than tripled in the same period, from about $19.5T in 2006/07 to $62.8T at Q2 2025.
The two charts above would indicate, in aggregate, that risks to the economy from household real estate are small. However, the economic stress runs deeper. The median home price to median HH income ratio has grown steadily since the trough in 2011/12 and is now above the 2006 bubble high.
I listened to a podcast with Lyn Alden and she mentioned that a big refi boom is unlikely, as rates are no longer likely to move to significantly lower levels. I hadn’t really thought about that, but several things come to mind:
Cash-out refis occur when rates fall and/or house values increase. I believe that rates are likely to edge lower, but in the context of a weakening economy where home prices are stagnant or declining. Case-Shiller National House Price index was +1.3% ending in Sept. According to Redfin the median sales price in Oct 2025 is just under $440k, a yoy gain of 1.3%, same as Case-Shiller. Let’s assume a mortgage of $400k at current 6.35%. Monthly payment $2489. Drop the rate to 5.35% and the payment becomes $2234, a gain of $255/mo. Great! But what if your electric bill has increased by $100/mo? Add jumps in property taxes and insurance. Poof! It’s gone.
According to the NY Fed’s HH Debt and Credit Report, the amount of Mortgage Balances at end of Q3 2025 was $13T. If mortgage rates immediately dropped by 1% and this entire amount were to be instantly refinanced, the per month change would be about $8.3B/mo. It’s probably not enough to move the needle in terms of a ‘refi consumption boom’ (though it might go a long way in unfreezing the market). In 2005, with much lower general price levels, total mortgage equity withdrawals (which included home equity loans) were over $700b or over $50b per month.
The point is that a refi ‘wealth effect’ boom isn’t likely. Nor will a 50-yr mortgage help. According to the NY Fed, the refi rejection rate (which has ranged between 14.5% and 42% since 2024) printed at the high of the series at 42% in October 2025. Household credit access in general is becoming more constrained, especially now that student loan and buy-now-pay-later delinquencies are being reported to credit agencies.
As an example of the skew towards affluence and age, I was in a conversation with a neighbor in the wealth management business catering to high net-worth clients. I asked him how some of the younger people could afford $2 – $4 million houses in the Chicago area and wealthy suburbs. He said it’s easy, the parents borrow against their (now large) portfolios and pay cash for the homes. Quoting, “We do it all day”.
From Google:
The loan is a securities-backed loan or a securities-based line of credit (SBLOC), which is a type of secured loan where your stock portfolio serves as collateral. This allows you to borrow cash for a down payment without selling your investments, which helps you avoid capital gains taxes and keeps your portfolio intact.
As of Q1 2024 SBLOC estimated at $138b (according to a Fed paper). This data is NOT in the Fed’s consumer credit release. “The Federal Reserve Statistical Release G.19, “Consumer Credit,” captures securities-based lending as part of the depository institutions sector, which prevents us from constructing a measure of securities-based loans from the G.19 data sources directly. “
I’m sure SBLOC is a MUCH larger number now, but I doubt it’s over $1T. Since end of Q1 2024 SPX is up about 30%. Is this lending a risk? Probably not, but if home prices and stocks decline simultaneously, we’ll find out. Quickly.
Another factor regarding Household real estate is what Melody Wright called the “silver tsunami” (in a recent Thoughtful Money podcast). Boomers are about 20% of the population with a homeownership rate of around 80%. As this older cohort dies off, sales will accelerate, most likely at lower prices. Wright says this is already beginning. In order for median house sales prices to revert to reasonable levels with respect to median HH income, she estimates price declines of 38%!
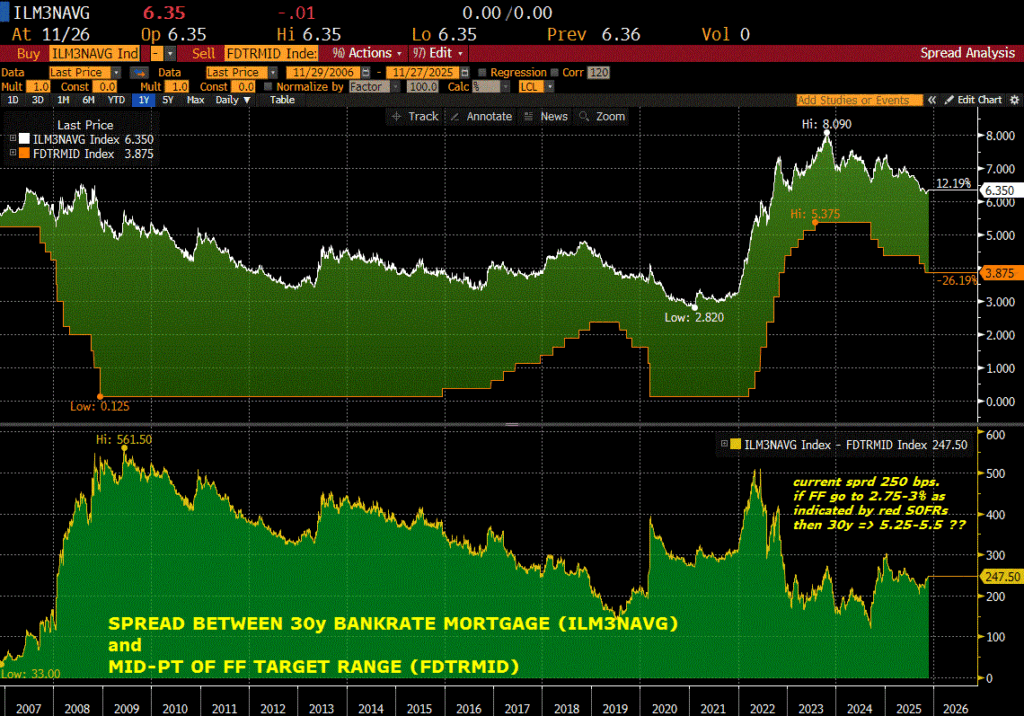
Below is a final chart showing the Bankrate 30-yr mortgage rate with the FF target range midpoint. Lower panel is the spread between the two. While the 30y mortgage was between 3.25% and 4.75% from 2011 to 2018, that period featured much lower FF levels. SOFR contracts one-year forward are projecting short-term rates around 3%. If the spread tightens to 200 bps (from current 250) then the mortgage rate could decline to about 5-5.25%.
| 11/21/2025 | 11/28/2025 | chg | ||
| UST 2Y | 349.4 | 348.9 | -0.5 | |
| UST 5Y | 362.0 | 359.6 | -2.4 | |
| UST 10Y | 406.3 | 401.3 | -5.0 | |
| UST 30Y | 471.3 | 466.3 | -5.0 | |
| GERM 2Y | 201.2 | 202.6 | 1.4 | |
| GERM 10Y | 270.2 | 268.8 | -1.4 | |
| JPN 20Y | 278.8 | 282.8 | 4.0 | |
| CHINA 10Y | 181.3 | 183.0 | 1.7 | |
| SOFR Z5/Z6 | -75.5 | -68.8 | 6.8 | |
| SOFR Z6/Z7 | 6.0 | 4.0 | -2.0 | |
| SOFR Z7/Z8 | 21.0 | 19.5 | -1.5 | |
| EUR | 115.17 | 115.98 | 0.81 | |
| CRUDE (CLF6) | 58.06 | 58.55 | 0.49 | |
| SPX | 6602.99 | 6849.09 | 246.10 | 3.7% |
| VIX | 23.43 | 16.35 | -7.08 | |
| MOVE | 78.81 | 68.95 | -9.86 | |

