
Hunker Down
November 23, 2025 – Weekly comment
*****************************************
I don’t care much for folksy tunes, but I was driving around listening to a college radio station and caught this one. Hunker Down by Christo Graham. Fits the market mood.
It’s time to get to work
Get your feet in the dirt
Look at you, look at me
Look around
It’s time to hunker down
–Christo Graham
I looked back at some interest rate charts and am including clips of the past five months for SFRH6, SFRH7 and GT10 (ten year yield).
Anyway, on September 8, my commentary about the previous Friday’s employment report started out like this:
–Weak employment report (22k NFP and 4.3% rate) removed any doubts of an ease next week, and caused some to speculate on 50 bps. SOFR curve steepened. SFRH6 was the strongest contract, +11.5 to 9663.0. H7 (peak contract on strip) +6.0 to 9713, H8 +5.0 to 9697.5 and H9 +6 to 9677. By the way, SFRH6 price of 9663 equates to 3.37%, almost 100 bps lower than the current EFFR of 4.33%. Pricing is NOT telegraphing a series of powerful rate cuts. The fact that spreads like 2/10 didn’t press to new highs (ended at 57.5, down 0.7) is another signal that easing bets are more circumspect in terms of magnitude and timing. Ten year yield ended the week at 4.084%, down 9 on the day.
Here’s a price comparison from selected settles (yields), on September 5, 2025 to now:
SFRZ5
9637.0 9622.5 +14.5 (in yield, from 3.63 to 3.775)
SFRH6
9663.0 9645.0 +18.0 (in yield, from 3.37 to 3.55)
SFRH7
9713.0 9700.5 +12.5 (in yield, from 2.87 to 2.995)
GT10 (ten-yr yield)
4.084 4.063 – 2.1
Forward pricing on September 5, turned out to be just a bit more optimistic than what actually occurred. Front end was fixated on the outcome of the Sept FOMC, which was sealed with NFP.
On September 5, SFRH7 was the peak contract on the SOFR strip. As of Friday Nov 21, SFRH7 is still the peak contract. There have been two Fed eases since Sept 5, on Sept 17 and Oct 29. So, the Fed’s target range has dropped 50 bps from 4.25-4.5 to 3.75-4.0. The Fed effective rate has fallen from 4.33 to 3.88, or 45 bps. On Sept 5, 2/10 was 57.5, currently 55.1.
The takeaway for me is exactly the same as what I concluded in early Sept. Despite all the noise regarding the December meeting and the neutral rate, the market has consistently pegged the ‘terminal’ rate at 2.75 to 3.0% (as shown by SFRH7). The ten-yr will likely tend to slide down the yield curve, but 2/10 has been in a comfortable range from 45 to 62 since May. What changes this picture? In my opinion the largest risk is a hard break in asset prices.
Images below are from the start of July to present. Green dots are eases on Sept 17 and Oct 29. Red dot is August 1 Employment report. SFRH6 9645.0 on Friday, SFRH7 9700.5, US 10y yield 4.065.
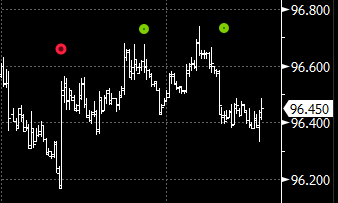
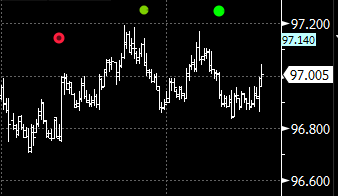
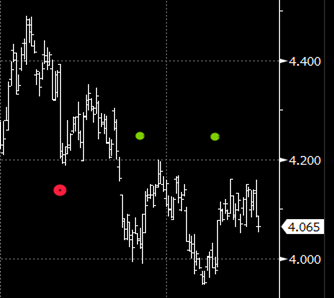
The major recent event seems to have been the weak payroll report from August 1. Since then, in my opinion, the Fed has become more focused on the jobs mandate.
The week was interesting in that there was volatility associated with December rate cut odds. The week’s range in FFF6 (Jan Fed Funds) was 9618 to 9632. On Wednesday, the BLS announced that the jobs report would come out Dec 16, after the FOMC on Dec 10. Dec SOFR options expire Dec 12. The market tilted toward the idea of the Fed staying on hold, an easy push given a divided Fed. Then on Friday, Williams said,
“I view monetary policy as being modestly restrictive, although somewhat less so than before our recent actions. Therefore, I still see room for a further adjustment in the near term to the target range for the federal funds rate to move the stance of policy closer to the range of neutral, thereby maintaining the balance between the achievement of our two goals.”
That was enough, along with weakness in equities, to spark a rush to the other side of the boat. However, in the grand scheme of things, the forward rate market still isn’t telegraphing big changes or cuts, regardless of what happens Dec 10 FOMC. At the end of August, SFRU5/SFRU6 one-year calendar was -104 bps. Nearly three months have passed (with 2 quarter pt cuts) and on Friday SFRZ5/SFRZ6 settled at a new recent low -75.5 (9622.5/9698.0). The reds remain pegged to the idea of a terminal rate 2.75 to 3.0%.
The average US family is struggling with affordability, be it groceries, taxes, insurance. Perhaps getting a bit worse, as reflected by weekend WSJ articles:
Saturday: The Middle Class is Buckling Under Almost Five Years of Persistent Inflation.
Sunday: Everyone is Talking About the ‘Affordability Crisis’. It Can’t Be Solved.
Growing unemployment adds extra stress, but a reversal in asset prices will blow up the economy. However, this administration will definitely engage in un-orthodox schemes to arrest large declines.
Kobeissi Letter notes the following drawdowns [percentages are somewhat smaller from high closes to Friday closes]:
Percentage Decline From Record High:
1. Oracle, $ORCL: -44%
2. Palantir, $PLTR: -30%
3. Meta, $META: -27%
4. AMD, $AMD: -27%
5. Tesla, $TSLA: -22%
6. Netflix, $NFLX: -22%
7. Nvidia, $NVDA: -19%
8. Amazon, $AMZN: -17%
9. Microsoft, $MSFT: -16%
10. Broadcom, $AVGO: -15%
I am just adding for fun:
CoreWeave CRWV -60%
Strategy MSTR -62%
Bitcoin -32%
Larger cracks are going to stall or reverse wealth-effect purchases.
News in this holiday shortened week includes September (old data) Retail Sales and PPI on Tuesday.
Wednesday features Conference Board Consumer Confidence, which, outside of a brief covid spike, is the lowest it has been since 2016 (Trump 1) through Biden. Last at 94.6, expected 93.4.
Happy Thanksgiving!
Here’s a more upbeat bluesy HunkerDown tune by the Legendary Shack Shakers
https://www.youtube.com/watch?v=kZ0EQ-idtJU
OTHER THOUGHTS/ TRADES
This week should conclude treasury rolls. All are 50 to 55% complete.
Since at least late August there’s been a large buyer of TY covered calls that (on their own) haven’t worked. MOVE peaked 84.3 last week but ended 78.8. Since early November the buys have been concentrated in TYF 113.5 and 114 calls, covered. There have likely been gamma scalps associated with these trades. Open interest in TYF 113.5c 358k and 114c 273k. My estimates are that one buyer has 200k 113.5c and 170k 114c. High prices paid synthetically in straddles 1’58 in 113.5 and 1’62 in 114 (1’59 to 1’82). On Friday, Jan 113.5^ settled 1’29 and 114^ 1’39.
| 11/14/2025 | 11/21/2025 | chg | ||
| UST 2Y | 361.0 | 351.2 | -9.8 | wi 349.4 |
| UST 5Y | 373.1 | 361.8 | -11.3 | wi 362.0 |
| UST 10Y | 414.6 | 406.3 | -8.3 | |
| UST 30Y | 474.5 | 471.3 | -3.2 | |
| GERM 2Y | 203.4 | 201.2 | -2.2 | |
| GERM 10Y | 271.9 | 270.2 | -1.7 | |
| JPN 20Y | 271.6 | 278.8 | 7.2 | |
| CHINA 10Y | 180.6 | 181.3 | 0.7 | |
| SOFR Z5/Z6 | -67.5 | -75.5 | -8.0 | |
| SOFR Z6/Z7 | 7.0 | 6.0 | -1.0 | |
| SOFR Z7/Z8 | 19.0 | 21.0 | 2.0 | |
| EUR | 116.21 | 115.17 | -1.04 | |
| CRUDE (CLF6) | 59.95 | 58.06 | -1.89 | |
| SPX | 6734.11 | 6602.99 | -131.12 | -1.9% |
| VIX | 19.83 | 23.43 | 3.60 | |
| MOVE | 79.71 | 78.81 | -0.90 | |

