
In to the Fall
October 17, 2021- Weekly Comment
***************************************
In my world, here’s what tells the story of the week: EDZ’21/EDZ’22 calendar spread rose 13.5 bps on the week from 38 to 51.5. EDZ’22/EDZ’23 was nearly unchanged, rising just 0.5 from 68.5 to 69.0. EDZ’23/EDZ’24 fell 12.5 bps from 43.5 to 31.0.
In layman’s terms, the market moved the odds of a near term hike aggressively closer. Flattening of the curve from the end of 2023 forward suggests that the market is forecasting slower growth in the future. It’s not at all clear whether that’s a correct projection; obviously there are huge positions on the ED curve that get forced out without the luxury of thinking through all of the forward economic scenarios. What is absolutely certain though, is that sentiment for the idea that the Fed will have to move up hikes to deal with inflation and shortages has taken hold.
In the month before the June FOMC, EDZ’21/EDZ’22 spread was 18 to 21 bps, timidly pricing the chance of one hike by the end of next year. Now it is 51.5 and Jan’22/Jan’23 FF spread is 45.0, both new highs for the year. So now it’s more like 2 hikes. That doesn’t sound particularly earth-shattering. However, it’s worth noting that EDM’22, which was sold in size over 100k at 99.78 on Friday October 8, ended this past week at 99.68, without the libor setting having changed at all.
Some might be tempted to call this the return of the ‘taper tantrum’, justifying former NY Fed President Dudley’s warnings from the start of the year that the Fed would not be able to avoid such an outcome. In January he said, “Unfortunately, there’s little the Fed can do to prevent another taper tantrum. The best it can do is be prepared and communicate clearly and consistently.” By August he said a tantrum was less of a risk, because of the Fed setting the table appropriately. We’ve had a front-end sell-off for sure, but it is not in the category of a tantrum.
The chart below covers the period from April to October of 2013, when the actual taper tantrum occurred. The FF target was 0-0.25 as it is now. Keep in mind that the actual first hike did not occur until December of 2015. In other words, long liquidation of front contracts at that time was ultimately unwarranted. On the chart, I use ED6 which is the rolling sixth quarterly. The actual contract that printed a low of 9908.5 was EDZ’14. On Friday, the sixth quarterly, which is the second red, traded to 9912.5. Using this sort of analysis, one might judge that the short end is perhaps out over the skis. That is to say, that the first few reds have more or less tracked the tantrum and that long positions from these levels (or a little bit lower) have good risk/reward prospects.

However, there are important differences between than and now. In 2013, CPI was bouncing around 1 to 2% on a yoy basis. Last week’s CPI print was 5.4%, the highest since 2008 when oil hit $140/bbl. There are widespread reports of bottlenecks and shortages globally. When one problem gets better, another crops up. In 2013, unemployment was 7.7% average in Q1, 7.55% in Q2 and down to 6.7% by year-end. It’s now 4.8%. Macroeconomic variables much more easily justify rate hikes now as compared to the earlier period.
This is from Cass Transportation Report
Bottlenecks in the ports and elsewhere caused the number of freight shipments to decline from August to September by nearly 5%.
This supply & demand dynamic we’re witnessing- along with the cost of fuel and other factors- has caused the average cost of a shipment (not the same as rates) to spike to a +31.4% y/y change.
There’s much to read this month, including the new inflationary risks that may drive costs even higher.
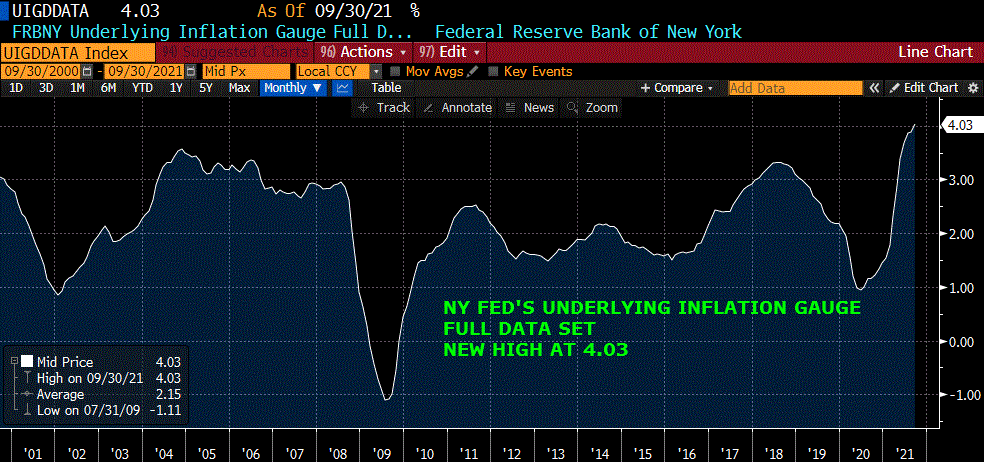
We know there’s inflation. The NY Fed’s Underlying Inflation Gauge hit 4.03, a new high (chart below). We know bottlenecks are actually holding down growth. The question is the Fed’s response. It’s clear that extraordinary stimulus from the Fed and the Fed’l government was in part responsible for the inflation we are seeing now. It’s almost amazing that the Fed takes credit for saving the economy but then can’t quite grasp that they’ve overdone it and need to reverse. Even the Fed’s primary emphasis on jobs can make the case for rate hikes, with a hint coming from reference to the Kansas City Fed’s Labor Market Conditions index in the FOMC minutes. (chart below). That index has matched pre-covid levels. The market is pushing for hikes, sooner rather than later.
Below is KC Fed’s Labor Mkt Conditions

The first three one-year Eurodollar calendar spreads are EDZ’21/Z’22 at 51.5, EDH’22/H’23 at 67.0 and EDM’22/M’23 at 73.5. All new highs for the year. From the ED6 taper comparison, one might ponder whether these spreads should be sold. Said another way, is a contract like EDM’23 too low at 9894.5? That’s a yield of 1.055%, with CPI 5.4%. Let’s leave that question for a minute, and look a bit further back. At the start of this note, I also mentioned EDZ’23/EDZ’24 which FELL 12.5 to just 31 bps. While it may or may not be the case that front spreads overshot the upside, it seems to me that back spreads are getting quite cheap. EDH’24/EDH’25 settled at 26, the lowest settle of the year in that spread. The green pack (3rd year, EDZ3, H4, M4, U4) to the blue pack (4th year, EDZ4, H5, M5, U5) settled just above 24 bps. In 2013’s taper tantrum, the green/blue pack spread doubled in two months, from 55 in the beginning of May to 109 by July 5. The five-year note, which ended Friday at 1.122%, in 2013 went from 70 bps in May to 1.61% at the start of June and eventually topped at 1.85% in the beginning of Sept.
In my opinion, a tantrum now is actually justified. I take the Fed at its word that rate hikes will be relatively restrained, but I think a hiking schedule of 50 to 75 bps per year is too modest, given the starting point. Steepening in front while flattening in back projects the idea that near term rate hikes will slow an already vulnerable economy and quell inflation. The former might be true, but the latter not.
“This fall I think you’re riding for—it’s a special kind of fall, a horrible kind. The man falling isn’t permitted to feel or hear himself hit bottom. He just keeps falling and falling. The whole arrangement’s designed for men who, at some time or other in their lives, were looking for something their own environment couldn’t supply them with. Or they thought their own environment couldn’t supply them with. So they gave up looking. They gave it up before they ever really even got started.”
JD Salinger, Catcher in the Rye.
They were looking for inflation!
| 10/8/2021 | 10/15/2021 | chg | ||
| UST 2Y | 31.6 | 39.9 | 8.3 | |
| UST 5Y | 104.7 | 112.2 | 7.5 | |
| UST 10Y | 160.3 | 157.6 | -2.7 | |
| UST 30Y | 216.2 | 204.8 | -11.4 | |
| GERM 2Y | -69.1 | -67.7 | 1.4 | |
| GERM 10Y | -15.1 | -16.7 | -1.6 | |
| JPN 30Y | 69.2 | 68.7 | -0.5 | |
| CHINA 10Y | 290.4 | 3.0 | -287.4 | |
| EURO$ Z1/Z2 | 38.0 | 51.5 | 13.5 | |
| EURO$ Z2/Z3 | 68.5 | 69.0 | 0.5 | |
| EURO$ Z3/Z4 | 43.5 | 31.0 | -12.5 | |
| EUR | 115.77 | 115.99 | 0.22 | |
| CRUDE (active) | 78.76 | 81.73 | 2.97 | |
| SPX | 4391.34 | 4471.37 | 80.03 | 1.8% |
| VIX | 18.77 | 16.30 | -2.47 | |
https://www.bloomberg.com/opinion/articles/2021-01-21/the-fed-will-trigger-another-taper-tantrum
https://blinks.bloomberg.com/news/stories/R0ZB0AT0G1KZ

