It’s not just yen-carry. It’s lower employment and consumer spending.
August 11, 2024 – Weekly comment
**************************************
If it’s all about the yen-carry trade, then it’s instructive to look at $/yen chart. Because in order to unwind, it’s necessary to buy yen.

A case can be made that the 10.8% move from 161.69 to Monday’s low of 144.18 was dramatic enough to have cleaned out the majority of weak hands. $/yen held at the 50% retrace of the rally from early 2023 to the July high. Similarly, the low in 2023 was made around the 50% retrace from the low at the start of 2021 to the high in 2022. So, maybe that part of the carnage is over…but maybe it’s not. The 50% retracement of the big move from the 2021 low to last month’s high is 132.20. My guess is that the low set right at the beginning of this year, 140.89, will be tested, and we’re likely to see 130’s. JPM says yen-carry is about 75% exited. From the chart, I don’t see it.
Jim Bianco relates the size of yen carry to the Bank of Japan’s balance sheet:
No definitive statistic shows its [yen carry] size, so we have to infer it from the size of the Bank of Japan’s balance sheet. …the Bank of Japan’s balance sheet is larger than the country’s GDP, at 127.5% of GDP. By comparison, the Fed’s balance sheet is 25% of GDP.
BOJ Deputy Governor Uchida helped stabilize the currency on Wednesday:
(BBG) ‘I believe that the bank needs to maintain monetary easing with the current policy interest rate for the time being, with developments in financial and capital markets at home and abroad being extremely volatile,’ Uchida said.
Certainly part of the action in US markets is associated with yen-carry. However, it’s not just Japan that has had out-sized government influence on markets. US deficit spending has remained at emergency levels but the economic boost has faded. Gov’t hiring has contributed about 25% to payroll growth. It’s likely to slow significantly, no matter who wins the election.
Yields rose and the curve flattened as panicked pleas for emergency rate cuts subsided. Twos popped back above 4%, ending the week at 4.053%, up over 17 from the previous Friday’s 3.88%. Tens rose 14.7 bps to 3.942% and thirties 11.8 to 4.228%. Auctions of 10s and 30s were soft, as both tailed by 3 bps. On the SOFR strip, SFRH5 and M5 were the pivot, retracing the previous week’s rally by nearly one-quarter percent. Both down 24.5 at 9618 and 9646.5. The previous Friday high in SFRH5 was 9670.5! But even last week’s close is a rate of only 3.82%, a bit over six months forward, about 1.5% below the current Fed Effective Rate. SFRU4/SFRU5 spread is also around -150 bps, ending the week at -149 (9513.5/9662.5) from -158.
This week brings inflation data and retail sales. PPI on Tuesday expected 2.3% yoy, with Core 2.7%. CPI on Wednesday expected 3.0% yoy, unchanged from last month’s print, and Core 3.2%, down 0.1 from previous. Retail Sales on Thursday, expected +0.4% on the month. Inflation data has receded in importance relative to the labor market. However, Fed Governor Bowman in a speech Saturday said “…the recent rise in unemployment may be exaggerating the degree of cooling in labor markets.” “I will remain cautious in my approach to considering adjustments to the current stance of policy.” Of course, Chair Powell’s comments at the upcoming Jackson Hole Conference on August 23 will be key in determining the size of the September rate cut. October Fed Funds settled Friday at 9505.5 or 4.945%, almost exactly between 25 and 50 bps. (A 25 bp cut should take the EFFR to 5.08%, and 50 to 4.83%).
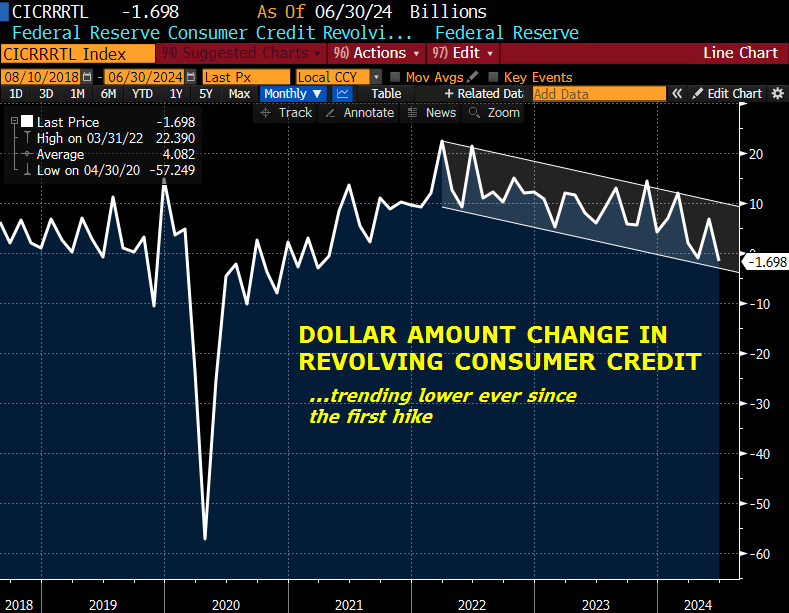
Consumer Credit isn’t a particularly closely watched monthly figure. However, last week’s print for June showed a dollar change of -$1.7 billion in revolving (credit card) debt. The data is a bit noisy, but the trend is declining. Some of that is likely due to increased stringency by lenders, and some due to tapped out consumers.

| 8/2/2024 | 8/9/2024 | chg | ||
| UST 2Y | 388.0 | 405.3 | 17.3 | |
| UST 5Y | 362.5 | 379.4 | 16.9 | |
| UST 10Y | 379.5 | 394.2 | 14.7 | |
| UST 30Y | 410.8 | 422.6 | 11.8 | |
| GERM 2Y | 235.2 | 238.6 | 3.4 | |
| GERM 10Y | 217.4 | 222.5 | 5.1 | |
| JPN 20Y | 172.1 | 168.3 | -3.8 | |
| CHINA 10Y | 212.4 | 220.5 | 8.1 | |
| SOFR U4/U5 | -158.0 | -149.0 | 9.0 | |
| SOFR U5/U6 | -13.5 | -18.0 | -4.5 | |
| SOFR U6/U7 | 6.0 | 4.5 | -1.5 | |
| EUR | 109.11 | 109.29 | 0.18 | |
| CRUDE (CLV4) | 72.59 | 75.61 | 3.02 | |
| SPX | 5346.56 | 5344.16 | -2.40 | 0.0% |
| VIX | 23.39 | 20.37 | -3.02 | |

