
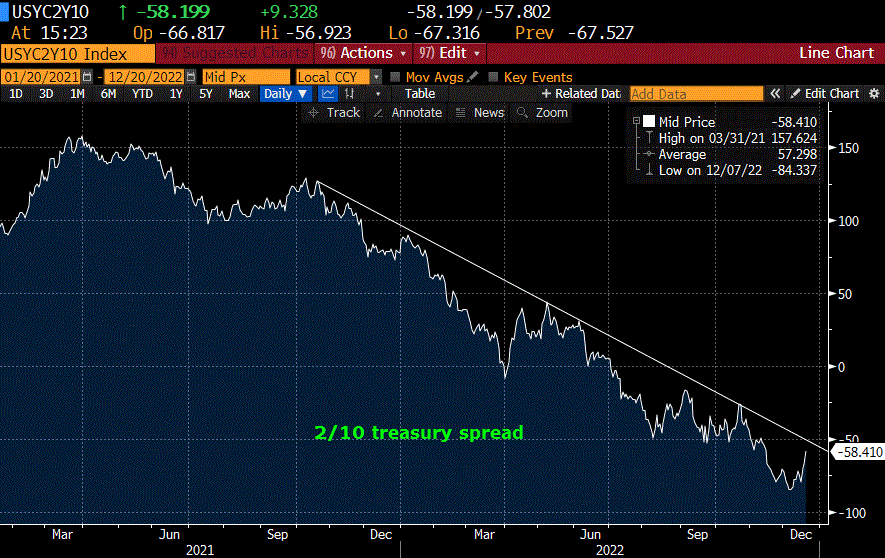
Can 2/10 get above -52?
December 21, 2022
–The days get longer from here!
–Driving factor yesterday was Japan’s surprise widening of band on the 10yr JGB to 50 bps, essentially a hike. JGB went from 25 bps to 42.
–Steepening result in the US with 2/10 at -58 bps, highest since mid-November with the historic low of -84.3 in between (-88 during the day). Downward sloping trend line comes in around -52, which started in October or last year around +127.
–I’ve been focused on the LOW contract of the SOFR curve, which is currently front March’23 at 9515.5 or 4.845%, about 50 higher than the current EFFR of 433 bps. However, it’s also interesting to note the HIGHEST contract on the curve which is currently Z’25 at 9701 or 2.99%. SFRM5 (2 quarters before Z’25) is 9698.0 and SFRM6 is 9696.5. So, not much of a difference, but there has been an awful lot of buying of the 9700 or 3% strike…and the highest forward contract is barely above that level. As evidence of the current positions, note that SFRU3 9700c has 103k open and SFRZ3 has 134k open.
–Another note related to steepening of 2/10 is the nominal level of sofr midcurve straddles. For example, 0QM 9650^ settled 86.5 ref 9645.5 in SFRM4. However, 3QM 9700^ settled 80.0 vs 9696.5 in M’26. Though both expire on the same day, the straddle on the further contract is nominally cheaper. If the curve really does start to dis-invert then the back end might be expected to be more volatile. Of course, the current curve shape argues for the front to be more expensive (due to roll), as SFRH4/M4 is -38 (9607.5/9645.5) while the roll in back is much more modest at +2.5 (9699.0/9696.5).
–Today features 20y re-open auction of $12 billion; late WI was 3.93/3.925. Existing Home sales expected 4.2 million rate from 4.43m last. Consumer Confidence.
BOJ surprise
December 20, 2022
–Yesterday I linked a story from Reuters that reported BOJ might change its ultra loose policy in April with a new BOJ Governor. Today the BOJ surprised markets by expanding the band (cap) on JGBs from 25 to 50 bps, but also vowed to buy more bonds. Ten yr JGB had been stuck at 25 bps, but last is 41 bps. $/yen was around 137 but immediately dropped to 132. US curve is steeper on the move with the TY contract -17.5 to 113-19 and US down 1.5 points to 128-09. On the SOFR curve fronts are nearly unchanged, reds down 4.5 and blues -7.5. US equities seeing additional pressure from yesterday. Gold has jumped back above 1800.
–Yesterday BBG’s Tracy Alloway reported an increase in US Fed Discount window borrowings. The increase is small, with the article linking the rise to smaller banks, and noting that it coincided with the crypto implosion. That’s how these things start!
–Over the weekend I noted that it’s rare for stocks to make new yearly lows in December. Nasdaq Comp was down 1.5% yesterday and this morning is only a few percent away from the year’s low of 10089. In fact AMZN and AAPL currently at year’s lows, as is TSLA. A lot of similarities to late 2018, which ultimately resulted in the final Fed hike in December, followed by Treasury Sec’y Mnuchin having to call the heads of banks together to assure the markets of adequate liquidity. Forced pivot. BOJ is just helping move things along.
Repo Man
December 19, 2022
–Both Daly and Mester made hawkish comments about the Fed’s resolve to beat inflation, yet front SOFR contracts closed higher on the day, with H3 +5 at 9519.5, M3 +8 at 9520.5, U3 +8.5 at 9540.5, and Z3 +6.5 at 9575.0. The Fed’s just released dot plot suggests a FF target over 5% in 2023, which is being dismissed by the market. The highest rate on the curve is March’23 at 4.805% and projections are obviously lower going forward.
–An article on Reuters suggests Japan is getting ready to drop its deflation-fighting policies “…after a new BOJ Governor is appointed in April.” Ten-yr JGB has been pegged at 25 bps. JPY is 136.07, currently just above the 200 DMA.
–Articles about auto repos have been cropping up more frequently. The trained Chicago observer is able to distinguish between the repo man, carjackers, and towing services impounding cars on snow routes. It’s not always easy. A piece from NBC notes: “The percentage of auto loans that were 30 days delinquent was at 2.2% in the 3rd quarter, compared with 2.35% delinquent over the same period in 2019, according to Experian. By contrast, just over 4% of auto loans went into default in 2009.”
Fading the Fed’s Fantasy Forecasts
December 18, 2022 – Weekly Comment
History tells us that sharp reversals in confidence happen abruptly, most often with little advance notice. These reversals can be self-reinforcing processes that can compress sizable adjustments into a very short time period. Panic market reactions are characterized by dramatic shifts in behavior to minimize short-term losses. Claims on far-distant future values are discounted to insignificance. What is so intriguing is that this type of behavior has characterized human interaction with little appreciable difference over the generations. Whether Dutch tulip bulbs or Russian equities, the market price patterns remain much the same.
We can readily describe this process, but, to date, economists have been unable to anticipate sharp reversals in confidence. Collapsing confidence is generally described as a bursting bubble, an event incontrovertibly evident only in retrospect. To anticipate a bubble about to burst requires the forecast of a plunge in the prices of assets previously set by the judgments of millions of investors, many of whom are highly knowledgeable about the prospects for the specific companies that make up our broad stock price indexes.
-Alan Greenspan, Jackson Hole Aug 1999
SF Fed’s Mary Daly on Friday: “I don’t know why markets are so optimistic about inflation.”
There’s an age-old tension regarding Fed policies being behind or ahead of the curve. Markets occasionally act with total disregard to the utterings of Fed officials, even the most powerful.
Greenspan’s Jackson Hole speech in 1999 is a case in point. From the end of 1998 to July 16, 1999, the Nasdaq Comp rose about 800 points, from 2166 to 2864, around 37%. At the end of August, it had pulled back slightly to 2739. By March 10, 2000 it had almost doubled to 5048! Then the declines came, but it still took until November of 2000 just to get back to the level when Greenspan made the original speech. Greenspan was right, in sort of an academic sense. It’s hard for the central bank to argue with “prices of assets set by the judgments of …highly knowledgeable” investors. Like those sponsoring FTX.
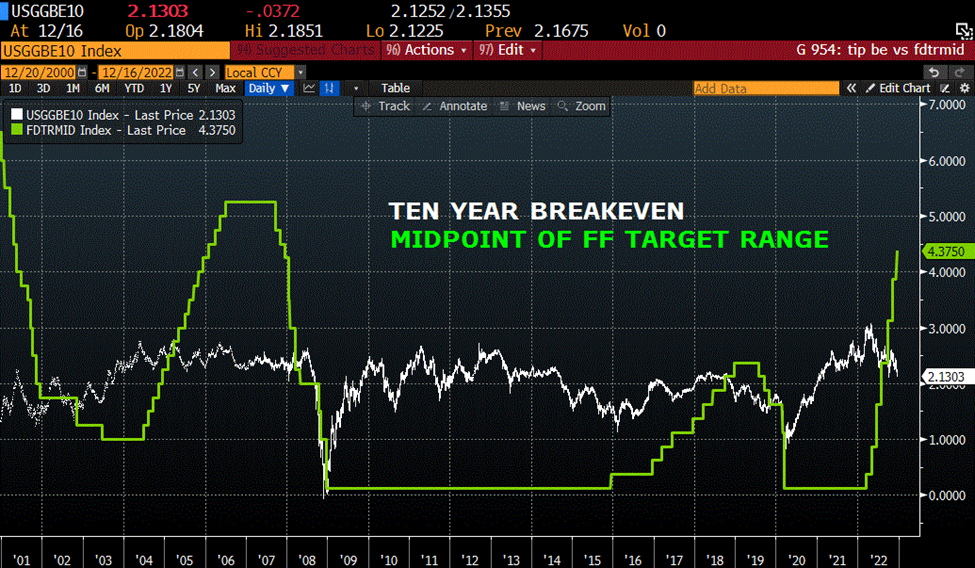
Mary Daly was out there trying to emphasize the Fed’s resolve on inflation. Loretta Mester echoed the message, saying the Fed will need to keep rates above 5% next year. On Friday the 5y breakeven was 219 bps, having been as high as 373 at the end of March. The 10y breakeven ended at a new low for the year at 213 bps, with a high of 304 in April. That’s back around the levels for 2018, when the Fed achieved a peak FF range of 2.25 to 2.50%. It appears as if a FF target above the long-term breakeven rate is restrictive, as the chart below shows.
On Wednesday, the day of the FOMC, EFFR set 383 bps. On Thursday it was at the new target of 433. That rate is above every yield on the treasury curve from the 2y out. That’s another indication of a restrictive rate. In my opinion, the logical extension is that high short-term rates are prohibitive to longer term economic projects.
Daly and Mester are yearning for the 2006 to 2007 experience, when the FF target reached 5.25% in June of 2006 and stayed there until September of 2007. However, US interest rate markets are blatantly ignoring them. The lowest FF future, representing peak rates, is May’23 (FFK3), which settled 9516 or 484, just 51 bps above the new EFFR. By January of ’24 the price is 9565.5 or 434.5 almost exactly at the current EFFR. On the SOFR curve the low contract is March’23 at 9519.5 or 480.5, which was actually UP 5 bps on the day and 11 on the week (9508.5 to 9519.5). By the end of the year the Dec’23 contract is 9575.0 or 4.25%. Mary Daly said the Fed is prepared to hold the peak rate for 11 months. The market is more or less in agreement with THAT idea, if the peak rate is the one that was set last week. Why is the market optimistic on inflation? Take a look at the annual growth rate of M2 (at just 0.8% last).
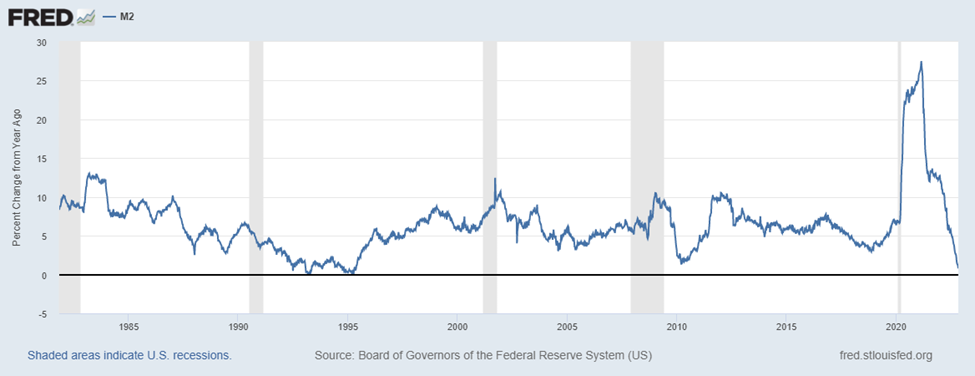
There are a lot of reasons one can point to for inflation, but if it “is always and everywhere a monetary phenomenon…” as expounded by Milton Friedman, then the rapid deceleration of M2 means something. Maybe Friday’s release of S&P Composite PMI at the year’s low of 44.6 is also a clue.
This week features housing data on Monday, Tuesday and Wednesday. New Housing Starts are expected 1400k, near the year’s low of 1377k. Existing Home Sales on Wednesday. The high level of the year was set right at the start of 2022, at 6.65 million. The last data was 4.43 million and the survey shows an expectation of only 4.2 million. (The covid low was 4.07 million). Last month’s 4.43 was the lowest since 2011. On Friday we get the all-important PCE price data, expected 5.5% with Core 4.7%. If the Core estimate is correct, it’s less than 40 bps above EFFR. If the Fed were to hike another 25 bps at the Feb 1 FOMC (which is indicated by the Feb’23 FF contract at 9536.5), then it’s highly probable that Core PCE will decline below EFFR sometime by the middle of next year. In fact, the Fed’s fantasy dot plot has Core CPI for the end of 2023 penciled in at 3.5%, with a FF rate at 5.1%. If that were to come to pass, it will be a year of misery in equities.
OTHER MARKET THOUGHTS/ TRADES
Nasdaq Comp ended the week at 10705. That’s down over 31% ytd. The low in the first half of the year was set in June at 10646. The low of the year so far has been 10321 on October 14, so we’re now only 3.7% above the low. It’s not very common for the low of the year to be set in December, though of course it recently occurred in 2018. Before that, in the GFC year of 2008 the low was set in November. In the year 2000, the year after the Greenspan Jackson Hole speech cited at the top of this note, the low of the year was 2333 on Dec 20, a more than 50% drop from the then all-time-high set in March.
Call spreads in SOFR have been popular buys, even with the inversion already present. SFRZ3 settled exactly at 9575 or 4.25%. The 9500p or 5% strike, settled 20.75. The equidistant 9650c settled 24.50, just another market signal that easing will be much more likely than tightening by the end of next year.
| 12/9/2022 | 12/16/2022 | chg | ||
| UST 2Y | 432.8 | 417.8 | -15.0 | |
| UST 5Y | 375.3 | 361.4 | -13.9 | |
| UST 10Y | 356.7 | 347.9 | -8.8 | |
| UST 30Y | 354.7 | 353.1 | -1.6 | |
| GERM 2Y | 216.0 | 242.3 | 26.3 | |
| GERM 10Y | 193.3 | 215.2 | 21.9 | |
| JPN 30Y | 140.1 | 146.9 | 6.8 | |
| CHINA 10Y | 292.1 | 291.4 | -0.7 | |
| SOFR H3/H4 | -93.0 | -100.5 | -7.5 | |
| SOFR H4/H5 | -97.0 | -89.5 | 7.5 | |
| SOFR H5/H6 | -9.0 | -8.0 | 1.0 | |
| EUR | 105.34 | 105.87 | 0.53 | |
| CRUDE (CLf3) | 71.02 | 74.29 | 3.27 | |
| SPX | 3934.38 | 3852.36 | -82.02 | -2.1% |
| VIX | 22.83 | 22.62 | -0.21 | |
OpEx might lead to exaggerated moves
December 16, 2022
–Large equity option expiry today, along with December midcurves in rates. Data yesterday was generally weak, with Retail Sales -0.6%, Philly Fed Business Outlook -13.8 vs -10 expected. Today’s news includes S&P Composite PMI, expected 46.9 from 46.4 last, the year’s low has been 44.6.
–Vol crushed again in rates with TYG3 115 straddle sold at 2’19 in size of 3k early, settled 2’17. TYH3 115^ settled 2’61 having been sold down from 3’10 to 3’02 on Wednesday. (Pegging 10y yield around 3.5%). SFRZ3 9575^ settled at 99 Wednesday, was sold on a block at 94 early and traded later at 96; settled 96.25 ref 9568.5.
–Short term US curve flattened: whites -3.0, reds 0, greens +2.75 and blues +4.5. The ten year yield fell over 3 bps to 3.45%. Changes in euribor were much more dramatic on hawkish comments from Lagarde post-ECB. ERZ2/ERZ3 jumped 30.5 bps to 105 as ERZ3 settled -26 at 9685.0. Quite a stark difference from the US where SFRZ2/Z3 settled negative 18.25.
–The most inverted one-yr calendar on the SOFR curve is Sept’23/Sept’24 which printed -153.5 yesterday and settled -152.5 (9532.0/9684.5). Going back 20 years the lowest any 1-yr ED calendar has settled is -158.25 in late 2007, and that was the first quarterly vs fifth quarterly, signifying that the need to ease was imminent and obvious. Currently, the market is reflecting a clear bias for ease, but the timing is, of course, later.
–Ten year treasury to inflation-index breakeven ended at 218 bps; early mark at 213.5 is new low for the year.
The Fed is buying it, just after the fact
December 15, 2022
–Finally a headline on BBG that captures price action: ‘Powell sees rates higher for longer, but the market doesn’t buy it’. I didn’t see the entire press conference, but my takeaways are: The Fed is currently not restrictive enough. No rate cuts until the Fed is confident that inflation is moving down to 2% goal. Seventeen out of nineteen dots for the end of 2023 were above 5% [ten of those were 5.125%].
–So, Dec’23 SOFR ended at 9571.0 or 4.29% and January’24 Fed Funds settled 9561.0 or 4.39%. The market isn’t buying it, it being a terminal rate >5%, OR, the market feels like the economy and inflation are going to decline in a way the Fed doesn’t perceive. The short term horizon leans toward a hike of just 25 at the Feb 1 FOMC. February FF closed UP 1 on the day at 9536, a spread of just 31 to what will be today’s new EFFR of 433. Worth mentioning is that every point on the treasury curve from the 2y out will have negative carry (repo > yield) as the 2y ended 4.226% and tens 3.483%. A headwind of over 75 bps of negative carry on tens is hard to stomach unless you’re pretty sure either the economy is ready to slow a LOT or inflation implodes from here. On that note, it’s worth a mention that the breakeven (ten yr yield vs 10y inflation indexed yield spread) notched a new low just below 220 bps. I.e. the market’s long term inflation expectations are declining, also indicated by recent surveys of, you know, the man in the street (who is now easy to find as he’s living in a tent).
–The Fed itself knows that its restrictive stance now will lead to lower future rates. For end-of-2024 the median dot is 4.1%, 100 bps lower than end-of-2023 median. And, in this case, the market and Fed aren’t too far apart: SFRZ3/Z4 (Dec) is -127 bps, while H4/H5 (March) is -90.5. The problem, as always, lies in the TIMING. The lowest spread is Sept’23/Sept’24 at -147.5.
–Taken together, Powell pretty much said what he had to…because he believes inflation is job one and that [lagging] labor data is still too strong. The market sees a slower economy and lower inflation, as hinted by the CPI report. Now, the Fed is never getting to a FF target over 5% in this cycle. (the MUSH, right? “C’mon Krytonite!!”) The question is, how long can the Fed keep the repo rate over the treasury curve.
–Today’s news includes Retail Sales expected -0.2 m/m. Jobless Claims expected 232k. Industrial Production…skewed higher if you include the need to replenish Christmas inventories of stinger missiles and drones.
BoE, ECB, Norges Bank and SNB.
–In terms of the incredibly tight labor market that Powell always cites, here’s a clip from the Philly Fed:
FOMC Day
December 14, 2022
–CPI lower than expected, up just 0.1 month/month with yoy 7.1% vs 7.3 expected and Core 6.0 vs 6.1 expected. A Timiraos (WSJ) bullet point followed: “THE FED IS ON TRACK TO RAISE INTEREST RATES BY 50 BASIS POINTS TOMORROW, BUT LOWER INFLATION COULD COMPLICATE THE 5% TARGET – WSJ” Bloomberg this morning has a headline, “Fed to downshift…but point to higher peak”
Short-term rate futures have signaled a peak rate of around 5% for quite some time, followed by easing. For example, SFRM3 yesterday settled 9518 or 4.82%, while six months forward SFRZ3 settled 9571.5 or 4.285%, more than 50 bps lower in yield; the same magnitude as today’s hike. The new Fed Effective today should be 433 bps, and indeed FFF3 settled 9566.5 or 433.5. FFG3 settled 9535 (a spread of 32 to 433), leaning heavily toward a hike of just 25 bps at the Feb 1 FOMC.
–Implied vol was crushed with the benign CPI release. For example, SFRH3 9512.5^ settled 33.0 Monday vs 9505.5. Yesterday, the underlying contract soared 11.5 to 9517, but the straddle settled 27.0. The challenge for Powell is to convey that the downshift could easily mean a pause, but NOT an ease. Of course, as noted above, the easing is being priced already.
–Late ESH3 was 4055 late, fully 125 off the euphoric high of 4180 post-CPI. Treasury yields ended lower, especially in the front. Twos fell 17.6 bps to 4.225% while the 30y bond was down only 5 bps to 3.525% as yesterday’s auction resulted in a tail of over 3 bps with bid/cover only 2.25 vs an average of 2.39. After today, the entire treasury curve will have negative carry with a funding rate of around 4.3%. If Powell can gently guide towards pause, then structural curve shorts may begin to unwind, which would pressure the long end and partially negate the easing of financial conditions seen elsewhere.
CPI today as NY Fed cites lowered expectations
December 13, 2022
–Yields rose Monday in front of today’s CPI report, the curve was flatter with the 2y yield +7.3 bps to 4.401% and tens up 5 bps to 3.615. On the ED & SOFR curves, reds (2nd year forward) led the way lower, -7.375 while greens (3rd year) were -6.875 and blues -4.25. The ten year auction was soft, tailing over 3 bps, 3.625% vs 3.588 at 1 pm. Bid to cover just 2.31. In some ways it’s surprising that selling pressure was slightly more concentrated on the front end, but apparently there are still those that need to hedge against a hawkish CPI/Fed outcome. CPI yoy is expected 7.3% vs 7.7 last, with Core 6.1 vs 6.3 last. EDZ2 9525 straddle settled 8.5 vs 9522.5, with buying at 9.0 yesterday even though the contract expires on Monday and libor is pegged just a shade above 4.75%. Thirty year auction today.
–Stocks seem inclined to side with the NY Fed’s inflation expectations data: “Median one-, three-, and five-year-ahead inflation expectations decreased to 5.2 percent, 3.0 percent, and 2.3 percent, respectively, according to the November Survey of Consumer Expectations.”
SPX rose 1.4% and JPM is forecasting a powerful rally if CPI comes out lower than expected.
–EDZ2/EDZ3 one-yr calendar made a new recent high of -2.5 (9522.5/9525.0); same with SFRZ2/Z3 at -4.75 (9546.25/9551.0). However, while Z2 and Z3 prices are nearly the same the June’23 contracts in between are forecasting a peak yield around 5%, with EDM3 9479.5 (5.205%) and SFRM3 9503.5 (4.965%). There’s going to be a lot of analysis of end-of-2023 dots, but I sure don’t know why; overall the Fed’s projections have been horrible. In September, regarding the FF forecast for end of 2023, there were 6 dots with a midpoint of 4.375%, 6 with a midpoint of 4.625% and 6 at 4.875%. I suppose those will ratchet a bit higher, but my guess is that it won’t make a bit of difference after a day or two.
–One last note, the US deficit for November was a whopping $249 billion as tax receipts fell.
https://www.fiscal.treasury.gov/files/reports-statements/mts/mts1122.pdf
See page 6 of 40. The technical way I like to look at this is: The green bars are getting smaller and the blue bars are getting bigger! More seriously, if tax receipts are declining due to a slowing economy, and the Fed is shedding treasuries and has a GOAL of slowing the economy (and thus tax receipts), then who is going to buy this 30y auction?
EDZ2 going out with a bang?
December 12, 2022
–Stocks and bonds both closed Friday on a weak note. Ten year yield up 7.2 bps to 3.565% with three- and ten-year auctions today. Yellen says inflation is coming down, noting shipping cost declines, delivery times are improving and gas prices are lower. CPI released tomorrow.
–EDZ2 expires one week from today, and there can still be fireworks associated with (libor-based) expiration. This morning EDZ2 is exactly at the 9525 strike with 58k calls open, and another 97k open in the 9531.25c (0.75 settle). The spread between SFRZ2 and EDZ2 has collapsed to just 22.5, down 30 from a little over a month ago when it traded 53. EDZ2 futures still have 1.3 million open. EDZ2/H3 settled at a new high of 37.25, up 2 on the day. There are a lot of exposed shorts in EDZ2. While Wednesday’s FOMC is locked for 50 bps, hints for the February 1 meeting can still influence EDZ. Many analysts expect the Fed will end its hiking campaign some time in 1H of 2023 and hold rates high for a while. FFN3/FFN4 settled -126 bps, so into the end of next year the market clearly forecasts eases.
Another Pezzonovante
December 11, 2022 – Weekly Comment
“Now listen. Whoever comes to you with this Barzini meeting, he’s the traitor. Don’t forget that.”
-Don Corleone to his son Michael
I was looking over old Godfather clips this weekend, for personal reasons that are probably clear to the euro$ pit community.
Vito Corleone knew the signals before they even occurred. As he’s talking to Michael, lamenting that this son has been pulled into the family business instead of becoming a Senator or Governor, Michael responds, “Another pezzonovante” (another bigshot).
It’s a lame analogy, but the financial pezzonovante will have a press conference this week, with signals for the future of monetary policy. The yield curve has been projecting economic trouble ahead, and there are more indications that the vice is tightening. Blackstone’s nontraded real estate investment trust (BREIT) was forced to limit redemptions as did Starwood’s. Blackstone’s private credit fund BCRED also hit its 5% cap as it “…saw redemptions worth around 5% of its outstanding shares in the quarterly withdrawal window that ended Nov 30.” (BBG). I have linked several articles below and won’t go into details here. As one article from SL Advisors notes: “The Vanguard Real Estate Index Fund (VNQ) was down 26% for the year through October. BREIT reports it is up 8.5% over the same time period…” Blackstone stock (BX) is down about 50% from the high posted in November 2021. As the SL article concludes:
But investors in Blackstone’s stock (BX) see a closer relationship with public real estate values as measured by VNQ rather than the private valuations represented by BREIT. Blackstone created the appearance of public market liquidity for privately held assets and asserts valuations remain strong. Their bluff is being called.
The question of course is, are these private market issues large enough to affect policy? Does the Fed have a good handle on liquidity and valuation issues? This week the Fed reported in its Z.1 quarterly report that Household Net Worth declined by another $392 billion in Q3. However, the real estate component ROSE $820 billion in Q3 (swamped of course, by the $1.94 trillion decline in corporate equity). Does it really make sense that real estate values are increasing, against the backdrop of nontraded REIT redemptions that are surging?
The signal of cycle lows in many yield curve measures remains important. Our system is based on the transformation of savings into longer maturity projects and investments. People accept lower yields on short-term investments, in part for access to instant liquidity and in part because they don’t have the knowledge or wherewithal to create greater value through long-dated investment projects. We place our savings with intermediaries: they’re the ones that have the expertise. The Fed’s zero rate policy accentuated a reach for yield, and many investment funds were happy to present a façade of instant liquidity. (As Mario Puzo wrote in the Godfather, “One lawyer with a briefcase can steal more than a hundred men with guns…”) Short term rates higher than long rates suggest that opportunities are ever more rapidly moving in reverse.
Bloomberg reported last month that President Jon Gray had put $100 million more of his own money in BREIT since July, as had Chief Executive Officer Steve Schwarzman, a person familiar with the matter said at the time. (wealthmanagement.com)
Now listen, when the company uses its own capital to attempt to shore up the nontraded funds (and the investments of top executives) that’s when you know it’s close to the end game.
In June 2007 Bear Stearns announced that its mortgage funds were wiped out and that they would recapitalize them. That was Tessio, coming to Michael to propose a Barzini meeting. SPX broke down after that, losing about 10% into a spike low in August. Then it made a new high into October. From there the unraveling played out, with the Lehman bankruptcy in September 2008 (Moe Greene shot through the eye).
The critical point is that the Fed was wrong in its early projections of inflation. It now seems to be using farcical valuations on real estate; sort of using the Blackstone model instead of measuring against the yardstick of other more liquid assets. Interest rate markets are registering a protest in the form of severe inversion. Several Fed officials, including Powell, have said they don’t want to over tighten. It might end up just like 2018, with the last hike of the cycle occurring in December.
This week CPI is released on Tuesday, expected 7.3% yoy vs 7.7% last. Core expected 6.1 vs 6.3. Auctions are crammed into the beginning of the week, with $40b 3-yr notes and $32b tens on Monday, followed by $18b 30-yr bond reopening on Tuesday. The FOMC result and press conference is Wednesday. ECB and BOE both expected to hike 50 on Thursday. At the Sept FOMC, projections for year-end 2023 FF target had 1 participant at 3.875-4.125%, 6 at 4.375-4.625%, 6 at 4.625-4.875% and 6 at 4.875-5.125%. Peak rate in 2023 as projected by the lowest FF contract is FFM3 at 4.955% (95.045), but the Dec’23 contract is back down to 4.575%. On an expected 50 bp hike EFFR will move to 4.33%.
Pezzonovante is Sicilian for a big gun, 90 caliber… a big shot. For TS: “Leave the gun. Take the cannoli.”
| 12/2/2022 | 12/9/2022 | chg | ||
| UST 2Y | 427.8 | 432.8 | 5.0 | |
| UST 5Y | 366.6 | 375.3 | 8.7 | |
| UST 10Y | 350.4 | 356.5 | 6.1 | wi 357.0/356.5 |
| UST 30Y | 356.0 | 354.7 | -1.3 | wi 355.0/354.5 |
| GERM 2Y | 211.0 | 216.0 | 5.0 | |
| GERM 10Y | 185.6 | 193.3 | 7.7 | |
| JPN 30Y | 148.7 | 140.1 | -8.6 | |
| CHINA 10Y | 291.1 | 292.1 | 1.0 | |
| SOFR Z2/Z3 | -22.3 | -9.5 | 12.8 | |
| SOFR Z3/Z4 | -137.5 | -133.0 | 4.5 | |
| SOFR Z4/Z5 | -21.5 | -18.5 | 3.0 | |
| EUR | 105.38 | 105.34 | -0.04 | |
| CRUDE (CLf3) | 79.98 | 71.02 | -8.96 | |
| SPX | 4071.70 | 3934.38 | -137.32 | -3.4% |
| VIX | 19.06 | 22.83 | 3.77 | |
http://creditbubblebulletin.blogspot.com/
https://blinks.bloomberg.com/news/stories/RMHC97DWRGG0
https://www.federalreserve.gov/releases/z1/dataviz/z1/changes_in_net_worth/chart/

