Focus on FOMC minutes
January 4, 2023
–Today’s news includes ISM Mfg expected 48.5, and FOMC minutes in the afternoon, the latter of which has been hyped as a market mover.
–Atlanta Fed GDP Now revised up to 3.9% for Q4, but a St Louis Fed report flagged by ZH questions whether the US is already in recession by looking at state data (SCI) State Coincident Indexes. The punchline: “So, where are we now? In Oct ’22, 27 states had negative growth in the SCI. That would exceed the six-recession average of 26 states but would fall short of the outlier-adjusted estimate (excluding 2008) of 29.” Just like always, some things are good and some things are bad.
https://www.stlouisfed.org/on-the-economy/2022/dec/are-state-economic-conditions-harbinger-national-recession
–Ever since rallying to -47 a week ago, 2/10 spread has been easing back lower, now -61. Yields generally fell yesterday, with tens down just over 5 bps to 3.788%. Solid rally this morning with TYH up 21.5/64s to 113-10. Yesterday there were a couple of short end trades suggesting the Fed is close to done. SFRM3 9525/9550c 1×2, lower leg bought for credit of 2 bps, settled 13.75/7.5 so credit of 1.25 ref 9504. Also a buyer of >20k SFRG3 9506.25/9518.75/9531.25 c fly which settled 3.5 vs SFRH3 9508.5. Middle strike is target, with a yield of 4.8125. Current EFFR is 4.33. Hike of 25 in Feb with another 25 expected in March would likely benefit the fly.
Confused by price action on the first day of the year!
January 3, 2023
–A boost to the dollar, bonds, stocks, gold to start the year. ECH3 (euro) at 1.0589 is below every price from the middle of December, GCG3 >1840 is above every price since July. SOFR contracts from March’25 back are up 8.5 to 10 bps.
–Fighting in Ukraine seems to be accelerating with Russians taking severe casualties in a missile attack in Makiivka near Donetsk. Perhaps some of the bid in treasuries has a flight-to-quality aspect, though equities are rebounding somewhat from end-of-year weakness as well.
–ISM Mfg and FOMC minutes tomorrow. Payrolls on Friday. Several Fed speakers Thursday and Friday, starting with Bostic.
Brief note
January 1, 2023 – Weekly comment
There’s a LOT of end-of-year summaries, and a lot of forward projections circulating around. It’s a bit overwhelming. Or perhaps tedious is a better word. I’m just going to keep this note brief and highlight short-end changes over the past week or two.
On the week, I marked the US ten-year up about 10 bps to 3.84% (+2.35% on the year) and the German bund up 17 to 2.57% (+2.75% on the year). I would note that China’s 10y is nearly unchanged on the year, at 2.84%. Japan’s decision to raise the cap on the 10y JGB is still filtering through markets, as is ECB hawkishness. The related move I am going to cite is in near calendars in SOFR futures.
On the week SFRH3/SFRH4 ROSE 10.5 bps to -77.5, while SFRH4/SFRH5 FELL 8 bps to -88.5. These directionally opposite changes reflect relative weakness in SFRH4 or reds in general. The inversion of 2023 contracts to 2024 remains, but has lessened. While there is a clear bias toward easing, it is being pushed back in time a little bit. For example on Dec 23, there was a large buyer of SFRM3/U3 at -19. On Friday it settled -14.5 (9504/9518.5), while SFRH3/M3 settled +4.5 (9508.5/9504). If prospects for rate cuts vanish going into the second half, then M3/U3 should move into positive territory, where H3/M3 is currently.
Typically, when the Fed eases it happens pretty quickly, and rate hikes are slower and more methodical. This past year the hikes were aggressively fast. And now the easing schedule is becoming more tentative?
SFRH3 fell 3.5 on the week, from 9512.0 to 9508.5.
SFRH4 fell 14.0 on the week, from 9600.0 to 9586.0 (largest decline, same as Z3)
SFRH5 fell 6.0 on the week, from 9680.5 to 9674.5
The lowest contract on the SOFR futures curve is M3 at 9504.0. The highest is Z5 at 9682.0. The difference over that two and a half year period is 178 bps. The change in Fed Funds over the past year has been 425 bps.
The “easy” trade is to just stay with a short in Z3 or H4 and watch it roll down the curve as the Fed either continues to hike or at the very least holds rates steady over the year. It’s not that easy.
In terms of year end prognostications, SFRZ3 settled 9547.0 or 4.53%, and the 9550 straddle at 100. There. That’s the prediction: 4.5% overnight rate (maybe 25 bps above the current target) plus/minus 100. The big shops are spending a lot of time on this stuff, writing long papers with charts. “Here comes two words for you” as Jack Walsh says in Midnight Run.
A caveat. Last year on 12/31/21 EDZ’22 was 9895.5. Final settlement for the contract: 9526. A change of 369.5.
Data this week includes:
Wed: ISM Mfg. Last was 49.0, a new low for ‘22 and low since mid-2020 covid period. Expected 48.5
JOLTS 10m expected from 10.3
FOMC minutes for December
Thursday: Job Claims expected 230k
Friday: NFP expected 200k, 3.7% Unemp rate
ISM Services expected 55
January 12 is CPI release
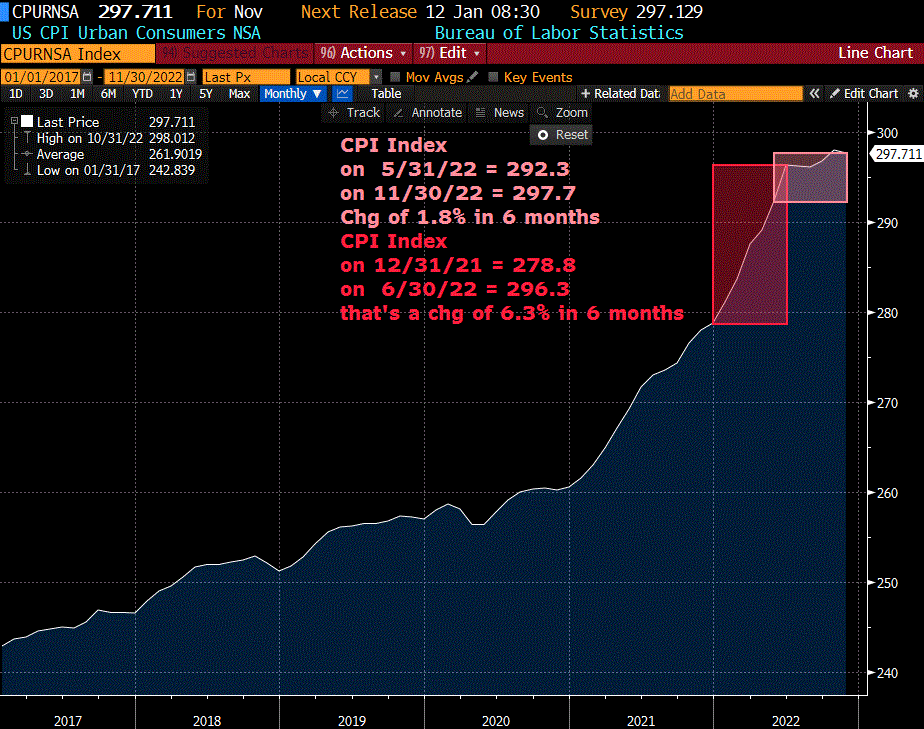
With respect to CPI, this chart clearly shows deceleration in the rate of advance. CPI Price index stopped going up in June. Any surprise that the market is pricing eases from June of next year?
| 12/23/2022 | 12/30/2022 | chg | ||
| UST 2Y | 428.0 | 440.3 | 12.3 | |
| UST 5Y | 386.0 | 397.0 | 11.0 | |
| UST 10Y | 374.3 | 384.0 | 9.7 | |
| UST 30Y | 382.0 | 393.3 | 11.3 | |
| GERM 2Y | 264.8 | 276.4 | 11.6 | |
| GERM 10Y | 240.3 | 257.1 | 16.8 | |
| JPN 30Y | 150.9 | 160.1 | 9.2 | |
| CHINA 10Y | 286.6 | 283.9 | -2.7 | |
| SOFR H3/H4 | -88.0 | -77.5 | 10.5 | |
| SOFR H4/H5 | -80.5 | -88.5 | -8.0 | |
| SOFR H5/H6 | -7.0 | -6.5 | 0.5 | |
| EUR | 106.17 | 107.03 | 0.86 | |
| CRUDE (CLG3) | 79.56 | 80.26 | 0.70 | |
| SPX | 3844.82 | 3839.50 | -5.32 | -0.1% |
| VIX | 20.87 | 21.67 | 0.80 | |
Warren Zevon sums up 2022
December 30, 2022
–Happy New Year!
–Minor rebound in financial markets Thursday. 10y yield down 5 bps to 3.835%. SPX up 1.75%. 2/10 eased back down to -53 from -47.
–A few of the near one-year spreads squeaked up to new highs, for example, SFRU3/U4 settled +0.5 to -125.5; it’s still the most inverted one-year calendar on the strip.
–Some reasonable size option trades went through. For example, a buyer of 30k SFRZ3 9650/9750cs for 12.25 to 12.5. SFRZ3 settled 9551.5 so the lower strike is nearly 100 bps away. Another structure in much smaller size on SFRZ3 is the 9550/9600/9650 call tree, buying the 9550 (atm) call, and selling the 9600 and 9650 for -2. Settled there, 49.75/31.75/20.0. Upside breakeven is 9702. Slow grind higher is desired outcome.
Send Lawyers Guns and Money…
2/10
December 29, 2022
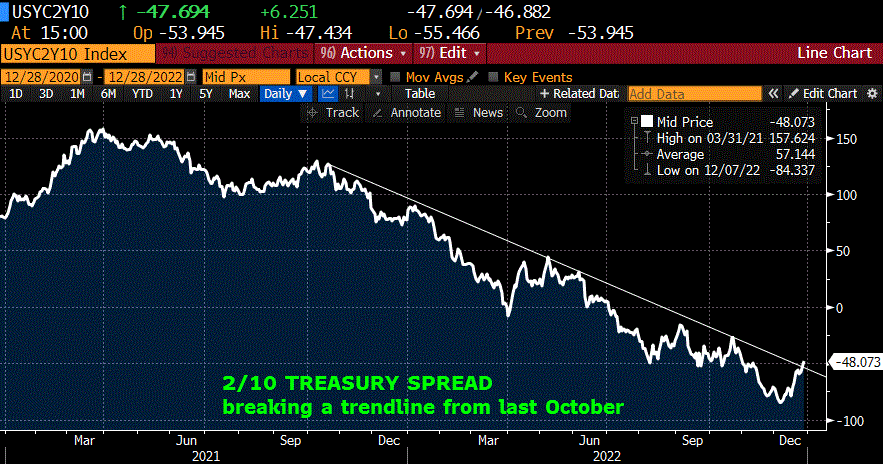
–Weakness in both stocks and bonds yesterday with SPX -1.2%, Nasdaq Comp -1.35%, and the ten year yield up 3.6 to 3.885. with the 30yr closing in on 4% (3.974). The standout feature was curve steepening, with the 2/10 spread slightly breaking a downward sloping trendline in place since October of last year, ending at -47. The low on 12/6 was -84. Some of the near one-year SOFR calendars also made new recent highs. For example, on Dec 7, SFRU3/SFRU4 (the most inverted 1-yr calendar) was -155 at the low. Yesterday it settled -126. SFRH3/H4, which had gotten at low as -101.5, settled yesterday at -79.0, essentially removing a 25 bp ease from that forward year. If the Fed can convince the market that eases are not forthcoming, then front spreads should continue to grind higher. In a way, the question becomes, if the Fed stops and holds for, let’s say three quarters, then where is the pivot on the curve? If the Fed hikes again, and EFFR goes to 458 and stops, then H3 (9510.5), M3 (9507.5), U3 (9523.0) would be too low, and the next few contracts past Z3 (9551 or 4.49%) would be too high. That’s not a forecast, though I could easily see that outcome. Would something like a sale of SFRZ3 9550 straddle at 98.5 bps provide enough of a cushion either way? Ultimately it might, but there are a LOT of possible landmines lurking out there.
–Today’s news includes Jobless Claims expected 225k and the 7yr auction.
Longer term funding at 3.25%, tens 3.75%
December 28, 2022
–Yields jumped Tuesday with tens at 3.85%, up over 10 from Friday, and 30s nearing 4% at 3.935%. Two year auction well received with a yield of 4.373; fives auctioned this afternoon. SFRZ3 closed -10 on the day at 9551.0. That’s a rate of 4.49% with the FOMC FF projection at 5.1% for end of 2023. In terms of a market ‘lean’ the 9500p settled 28.0 and the 9600c at 32.0. Every SOFR contract from March’25 to March’27 settled between 9671 and 9679. There’s a lot of blather about the ‘terminal rate’ but the market has (for now) decided that something around 3.25% makes sense longer term.
–China re-open is a dominant theme, though I can’t help but think it will come with a new wave of covid sweeping the globe that will hopefully taper by summer.
–TSLA down 11.4% yesterday and down by 2/3rds in the past three months! When collateral backing loans loses value, chain reactions start, and we seem to be in a series of rolling adjustments that should ultimately tighten credit decisions, and beyond that, hiring decisions.
Possible inflection point in the US curve?
December 26. 2022
–Yields rose Friday with tens up 7 bps to 3.743%. This week brings auctions of 2s, 5s and 7s starting today (Tuesday).
–Large new buyer Friday of SFRM3/U3 calendar at -19. Volume was >50k, open interest up about 11k in both contracts. SFRH3/M3 is -0.5 (9512/9512.5) so if the Fed is able to convince the market that rates will stay high through 2023, then M3/U3 should roll up towards H3/M3. However, the curve has a bias toward easing which has been in place for quite some time. The most inverted three-month calendar is Dec’23/March’24 at -39 (9561/9600). While many observers look for a terminal FF rate at 5% or higher, the SFRH4 contract settled at just 4% (9600).
–Over the weekend Klaas Knot told the FT, “…with five policy meetings between now and July 2023, the ECB would achieve ‘quite a decent pace of tightening’ through half percentage point rises in the months ahead before borrowing costs eventually peaked by the summer.” So that’s the ECB playbook and the US curve is projecting the same, with the peak rate projected by the US Fed Fund curve being May and June’23 contracts at 9509.5 or 4.905%. The first four FOMC announcement dates are Feb 1, March 22, May 3 and June 14. Current EFFR is 433. If the Fed hikes 25 at the next three meetings, then EFFR will be 508, about 18 higher than what is being projected by FFM3. BoJ sent a shock through markets last week by raising the cap on the 10y JGB to 50 bps, and Kuroda’s term ends in April, which is expected to mark the end of ultra-loose policy.
–Will more aggressive policies from other central banks lessen the pressure on the Fed to hike more, or will it lead to a weaker dollar which exacerbates inflation dynamics. I lean toward the former, and expect the structural short in the US curve will start to be unwound, which, along with capital being repatriated to Japan, will lead to higher US rates at the LONG end.
Stocks and Commodities
December 25, 2022
The chart below is SPX divided by the BBG Commodity Index, stocks priced in terms of commodities. The real acceleration/breakout started from around 2012. From 2012 until the beginning of 2021, yoy CPI ranged from 2.9% to 0, with the majority of data 1.2 to 2.2%. Inflation was a little bit below the Fed’s target. However, there was a lot of concern about inflation in financial assets, on display in this chart. What is interesting is that the BCOM chart, shown below in log format, doesn’t really scream long-term inflation, although the rate of change from the COVID low is aggressive.
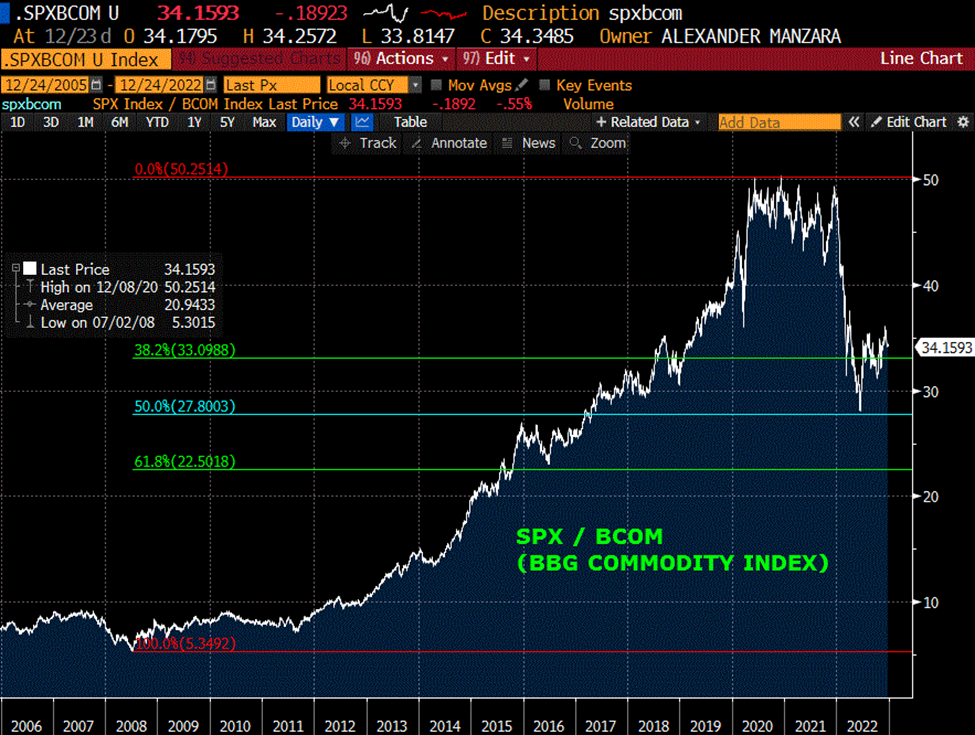
I would suggest that the first real manifestation of inflation was in goods, related to the surge in commodity prices. That move has abated, and now the concern has shifted to inflation in services. The idea of course, is that the labor market remains robust and that wage gains are sticky and pernicious.
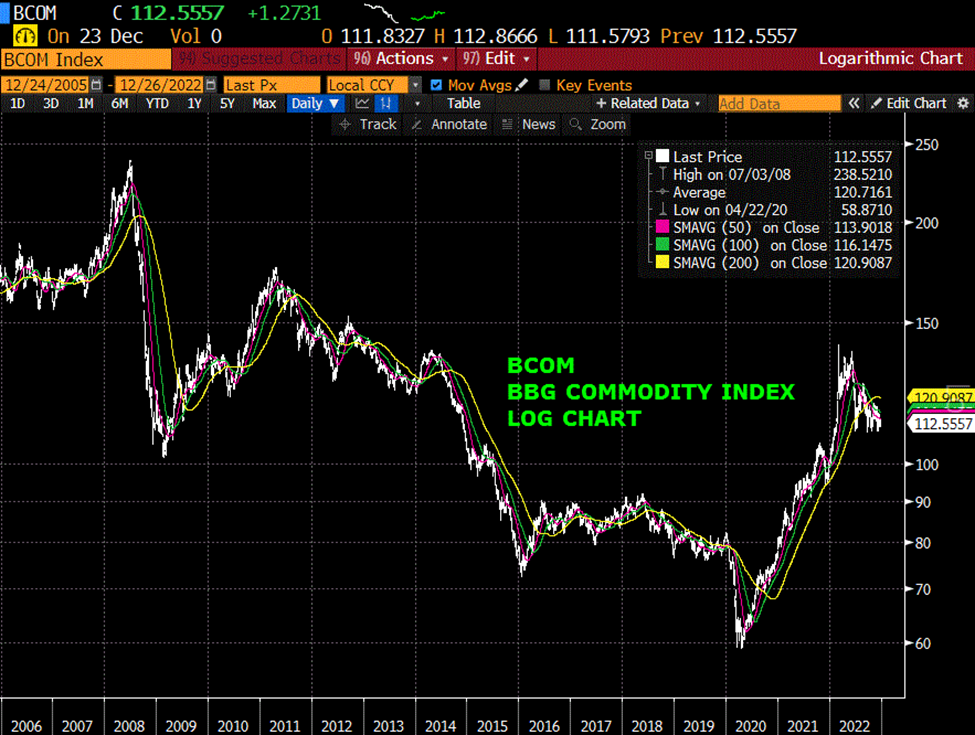
The Fed’s goal is to re-anchor wage and inflation expectations, and to stifle wealth-effect consumption using the blunt tool of short term rate increases. With respect to stocks and housing, the air has come out of financial assets, to say nothing of the crash in crypto.
There are many indications that the Fed has imposed sufficient monetary restraint on the economy. I’ll just note a few:
The yoy growth rate of M2 as of October 31 is just 1.3%, the lowest reading since 1995.
The new EFFR of 433 bps is above every point on the treasury curve from the 2-yr forward (the when-issued 2y ended Friday at 4.28%).
If the Fed hikes 25 on Feb 1, the new EFFR would be 458 bps. That’s within 1/8% of the Core PCE price deflator.
The yield on the 5y inflation-indexed note is 1.56% and on the 10y is 1.52% (real yields highest since 2008 and 2010 respectively).
The ten-yr breakeven ended Friday at 223, near the low of the year (213), more than ¾% from the year’s high of 304.
The lowest SOFR one-year calendar is Sept’23/Sept’24 at -129 bps, indicating a tight Fed which will lead to forced easing next year. (Low has been -155).
2/10 treasury spread had a nice bounce this week, ending at -57.5, but earlier this month printed -88, the lowest level since 1981.
In my opinion, the challenge for the Fed now is to maintain restraint. There is further tightening in the pipeline from previous moves. I think one small measure of success for the Fed might be if stocks to commodities ratio could settle back down around the 50% midpoint touched earlier this year.
Next week’s news is light, though treasury auctions twos, fives and sevens starting Tuesday. Chicago PMI on Friday. Last was 37.2, the lowest since 2001 save the GFC and COVID lows.
OTHER MARKET THOUGHTS
Japan takes first tightening step by raising the 10y JGB yield cap from 25 to 50 bps.
Big buyer Friday of SFRM3/U3 3m calendar -19.0. Higher for longer?
Decent amount of buying of SFRH3 put spreads with 9500p as the top (long) strike. Suggests Fed hikes in both Feb and March.
Nice rebound in US curve in conjunction with BOJ move. 2/10 ends at 57.5 from historic 40+ year low of -88 earlier in the month. Can US curve dis-invert?
Challenge for Powell is to convince the market that there is no easing on the horizon. There’s a lot of restraint in the pipeline that needs to work through the economy.
SFRZ3 has never closed below 9500 or 5%. SFRZ5 has never closed below 9600 or 4%.
| 12/16/2022 | 12/23/2022 | chg | ||
| UST 2Y | 417.8 | 431.9 | 14.1 | wi 428.5/27.5 |
| UST 5Y | 361.4 | 385.9 | 24.5 | wi 386.5/85.5 |
| UST 10Y | 347.9 | 374.3 | 26.4 | |
| UST 30Y | 353.1 | 382.0 | 28.9 | |
| GERM 2Y | 242.3 | 276.0 | 33.7 | |
| GERM 10Y | 215.2 | 240.3 | 25.1 | |
| JPN 30Y | 146.9 | 150.9 | 4.0 | |
| CHINA 10Y | 291.4 | 286.6 | -4.8 | |
| SOFR H3/H4 | -100.5 | -88.0 | 12.5 | |
| SOFR H4/H5 | -89.5 | -80.5 | 9.0 | |
| SOFR H5/H6 | -8.0 | -7.0 | 1.0 | |
| EUR | 105.87 | 106.17 | 0.30 | |
| CRUDE (CLG3) | 74.46 | 79.56 | 5.10 | |
| SPX | 3852.36 | 3844.82 | -7.54 | -0.2% |
| VIX | 22.62 | 20.87 | -1.75 | |
Deep freeze in Chicagoland, but only a dusting of snow
December 23, 2022
–It’s -6 farenheit, -21 celsius.
–Weakness in stocks yesterday abated slightly near the end of the session. SPX ended -1.45% and Nasdaq Comp -2.2%. Yields ended slightly higher with SFRM3 weakest on the strip at 9515.0, down 5 on the day. March’23 is the lowest contract, settling 9514.5, down 3.5. Q3 GDP was revised slightly higher and Core PCE prices came out 4.7% vs expected 4.6%. However, some of the weakness was attributed to David Tepper’s interview on CNBC when he said he leans short stocks (against his normally optimistic outlook) and is heeding what central banks are saying in terms of further tightening intentions.
–Today PCE prices are released, expected yoy 5.5 from 6.0 last, and Core 4.7 from 5.0. Japan’s Core CPI is at a 40 yr high 3.7% (with ten year JGB around 40 bps).
–As mentioned SFRH4 settled 9514.5, with a decent amount of buying yesterday of put spreads, for example 20k 9500/9475 ps for 4.75 (4.5s) and 9500/9481.25ps (3.75s). If the Fed were to hike 50 at the Feb 1 FOMC then these put spreads might be reasonable, but FFG3 settled at 9535.0 and really hasn’t deviated much from that price since the last FOMC. Still leans heavily toward only 25 at the Feb 1 FOMC, which would put EFFR 458.
Getting ready for the (Chicago) deep freeze
December 22, 2022
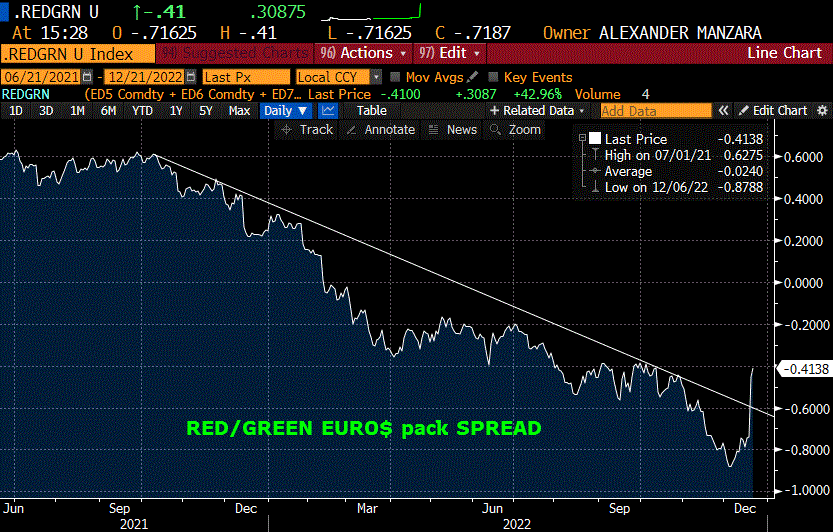
–On Tuesday I noted that 2/10 rallied following the BOJ decision to widen the band/cap on 10y JGBs. I cited a downward sloping trendline from October 2021, that came in at -52. Yesterday 2/10 closed at -53, up another 5 on the day. Is it a change in trend? Maybe, and maybe not. But it’s worth noting that many back spreads in ED and SOFR broke important resistance levels. For example, SFRU3/SFRU4 settled -134 yesterday from a recent low of -155. Red/green euro$ pack spread attached, up 46 bps from the low on 12/6 (pre-FOMC) of -87.875. Of course, the pack spreads roll with the expiration of contracts; before the FOMC the red pack was Z3/H4/M4/U4 and now it’s H4 thru Z4 as Dec’22 expired. On a short term basis it’s better to watch treasury spreads
–Existing Home Sales plunged to a rate of just 4.09m units, near the lows of the GFC and covid. I guess without Blackstone, Zillow, etc. in the market to buy and rent, the market is seeking a new level.
–Heavy trade in both call and put flies in near contracts. Yesterday SFRG3/SFRH3 9518.75/9531.25 call spread spread traded flat 50k, buyer able to buy March. Recent high in SFRH3 is 9523.5, settled yesterday at 9518.0.
–Today’s news includes final Q3 GDP. Jobless Claims expected 222k.