
Stocks and Commodities
December 25, 2022
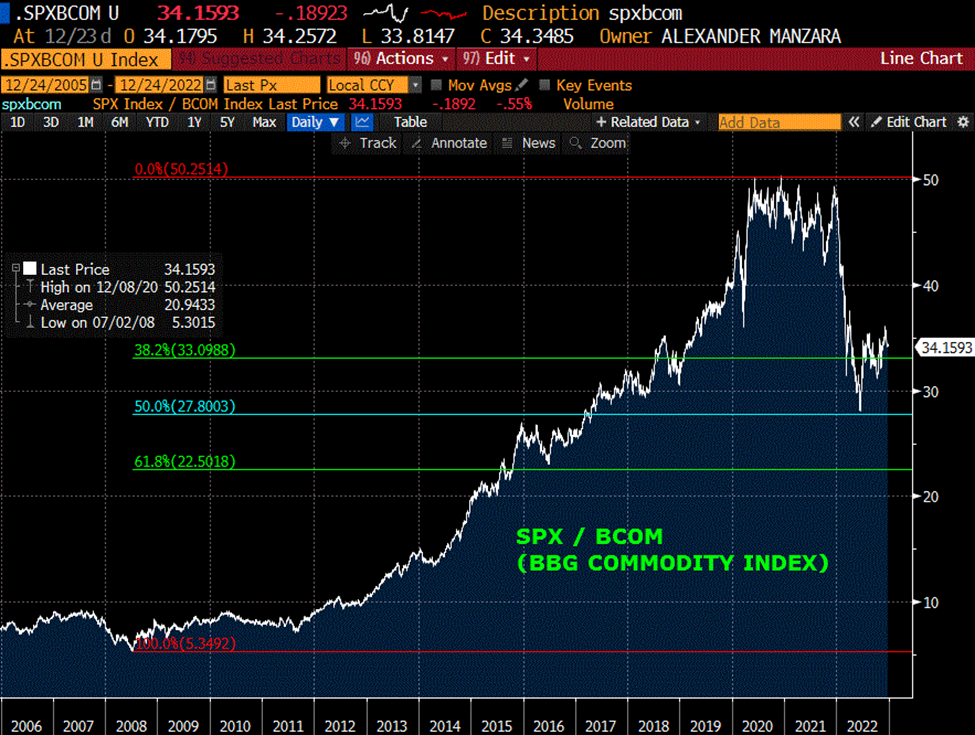
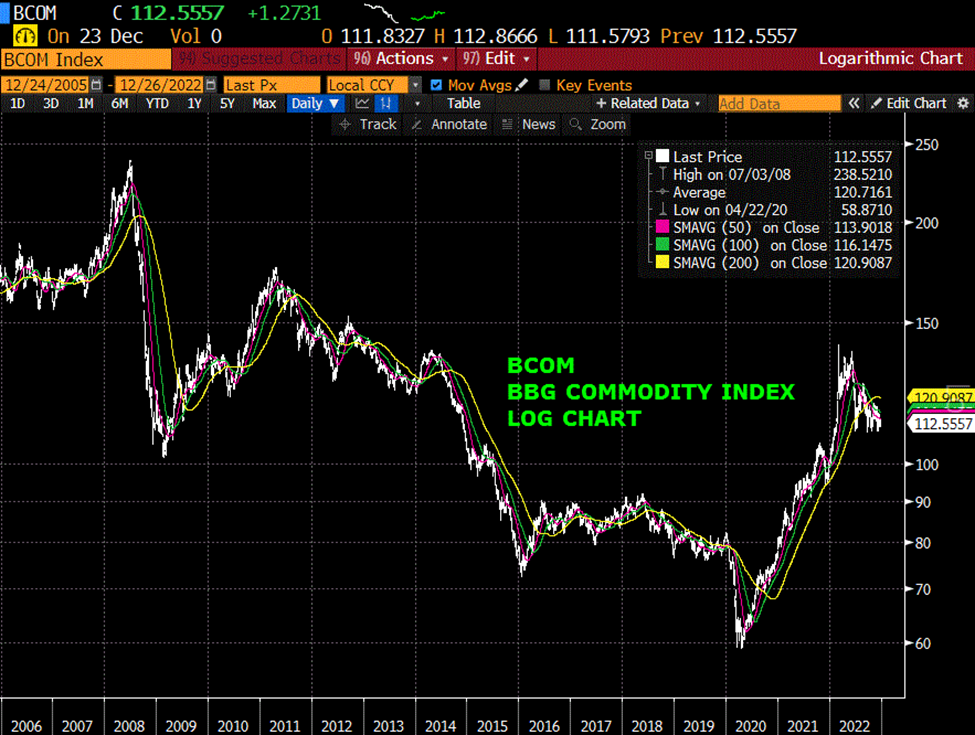
The chart below is SPX divided by the BBG Commodity Index, stocks priced in terms of commodities. The real acceleration/breakout started from around 2012. From 2012 until the beginning of 2021, yoy CPI ranged from 2.9% to 0, with the majority of data 1.2 to 2.2%. Inflation was a little bit below the Fed’s target. However, there was a lot of concern about inflation in financial assets, on display in this chart. What is interesting is that the BCOM chart, shown below in log format, doesn’t really scream long-term inflation, although the rate of change from the COVID low is aggressive.
I would suggest that the first real manifestation of inflation was in goods, related to the surge in commodity prices. That move has abated, and now the concern has shifted to inflation in services. The idea of course, is that the labor market remains robust and that wage gains are sticky and pernicious.
The Fed’s goal is to re-anchor wage and inflation expectations, and to stifle wealth-effect consumption using the blunt tool of short term rate increases. With respect to stocks and housing, the air has come out of financial assets, to say nothing of the crash in crypto.
There are many indications that the Fed has imposed sufficient monetary restraint on the economy. I’ll just note a few:
The yoy growth rate of M2 as of October 31 is just 1.3%, the lowest reading since 1995.
The new EFFR of 433 bps is above every point on the treasury curve from the 2-yr forward (the when-issued 2y ended Friday at 4.28%).
If the Fed hikes 25 on Feb 1, the new EFFR would be 458 bps. That’s within 1/8% of the Core PCE price deflator.
The yield on the 5y inflation-indexed note is 1.56% and on the 10y is 1.52% (real yields highest since 2008 and 2010 respectively).
The ten-yr breakeven ended Friday at 223, near the low of the year (213), more than ¾% from the year’s high of 304.
The lowest SOFR one-year calendar is Sept’23/Sept’24 at -129 bps, indicating a tight Fed which will lead to forced easing next year. (Low has been -155).
2/10 treasury spread had a nice bounce this week, ending at -57.5, but earlier this month printed -88, the lowest level since 1981.
In my opinion, the challenge for the Fed now is to maintain restraint. There is further tightening in the pipeline from previous moves. I think one small measure of success for the Fed might be if stocks to commodities ratio could settle back down around the 50% midpoint touched earlier this year.
Next week’s news is light, though treasury auctions twos, fives and sevens starting Tuesday. Chicago PMI on Friday. Last was 37.2, the lowest since 2001 save the GFC and COVID lows.
OTHER MARKET THOUGHTS
Japan takes first tightening step by raising the 10y JGB yield cap from 25 to 50 bps.
Big buyer Friday of SFRM3/U3 3m calendar -19.0. Higher for longer?
Decent amount of buying of SFRH3 put spreads with 9500p as the top (long) strike. Suggests Fed hikes in both Feb and March.
Nice rebound in US curve in conjunction with BOJ move. 2/10 ends at 57.5 from historic 40+ year low of -88 earlier in the month. Can US curve dis-invert?
Challenge for Powell is to convince the market that there is no easing on the horizon. There’s a lot of restraint in the pipeline that needs to work through the economy.
SFRZ3 has never closed below 9500 or 5%. SFRZ5 has never closed below 9600 or 4%.
| 12/16/2022 | 12/23/2022 | chg | ||
| UST 2Y | 417.8 | 431.9 | 14.1 | wi 428.5/27.5 |
| UST 5Y | 361.4 | 385.9 | 24.5 | wi 386.5/85.5 |
| UST 10Y | 347.9 | 374.3 | 26.4 | |
| UST 30Y | 353.1 | 382.0 | 28.9 | |
| GERM 2Y | 242.3 | 276.0 | 33.7 | |
| GERM 10Y | 215.2 | 240.3 | 25.1 | |
| JPN 30Y | 146.9 | 150.9 | 4.0 | |
| CHINA 10Y | 291.4 | 286.6 | -4.8 | |
| SOFR H3/H4 | -100.5 | -88.0 | 12.5 | |
| SOFR H4/H5 | -89.5 | -80.5 | 9.0 | |
| SOFR H5/H6 | -8.0 | -7.0 | 1.0 | |
| EUR | 105.87 | 106.17 | 0.30 | |
| CRUDE (CLG3) | 74.46 | 79.56 | 5.10 | |
| SPX | 3852.36 | 3844.82 | -7.54 | -0.2% |
| VIX | 22.62 | 20.87 | -1.75 | |

