
Summer Solstice
June 21, 2022
–On Friday EDU2/EDU3 made a new low settle of 43.5 from 87 the previous Friday; down 2 on the day. The euro$ curve continues to flatten in the face of the Fed’s inflation fighting resolve. EDZ2/EDZ3 settled -28.5, indicating that by next year, the Fed will be back to an easing bias.
–Bitcoin traded sub-18k over the weekend, but is now back around 21k as the crypto army regroups. The problem now is that companies like MSTR issued bonds to buy bitcoin. Whenever leverage is involved, there is more of a chance for forced sales that spiral, and the low rate environment encouraged borrowing. Higher rates create a hurdle, especially when the collateral is volatile.
–Crude oil is rebounding this morning, with CLQ2 up 2.50 over 110.50/bbl. Biden is floating the idea of a gas tax holiday which Yellen inexplicably endorsed; the Federal gas tax is 18.4 cents a gallon.
–News today includes Existing Home Sales and a Barkin speech. Existing Home Sales expected at 5.4 million rate from 5.6 last. The high in 2020 was over 6.5m; the range from 2016 to 2020 was mostly 5.2 to 5.5, so today should put us squarely back into that range. Powell begins semi-annual testimony tomorrow.
Uncertain, but economy strong (for now)
June 19, 2022 – Weekly comment
A couple of excerpts from Powell’s press conference:
…the economy often evolves in unexpected ways.
And we will strive to avoid adding uncertainty in what is already an extraordinarily challenging and uncertain time.
So remember how highly uncertain this is, but that [a restrictive level] is generally a range of 3 to 3.5%.
So, for much of the yield curve now, real rates are positive. [tips]
The consumer’s in really good shape financially…There’s no sign of a broader slowdown that I can see in the economy. …consumer confidence is very low. That’s probably related to gas prices and also stock prices to some extent for other people. …ultimately it does appear that the US economy is in a strong position and well-positioned to deal with higher interest rates.
…financial conditions have tightened over the last seven months and that’s a good thing, we think. But the FF rate, even after this increase is at 1.6%. So it’s hard to see how that is too high of a rate and even if we did another, so we’re going to get here by the end of the summer, somewhere in the twos probably. Still, that’s a low rate. So, that’s not a rate this is calculated to bring a recession on.
***************************
Just a couple of notes on the above. Uncertainty is the watchword, but Powell thinks the economy can withstand an inflation-fighting Fed. The objective is to get to a restrictive level of 3 to 3.5% by the end of the year. However, in Q4 2018, stocks — and the economy in general — couldn’t handle QT and rate increases, which met a forced end at 2.25 -2.50%. Powell often says that expectations are a powerful determinant in terms of inflation and the Fed has a primary goal of anchoring those expectations at 2%. I personally think that “expectations” and “confidence” go hand in hand, but Powell is dismissive of the impact of low consumer confidence on the economy, saying the US is in a strong position and able to handle higher rates.
He says, “…if you look around the world at where inflation levels are, it’s absolutely extraordinary. It’s not just here. In fact, we’re sort of in the middle of the pack…”
If the US is really the only country dead set on stopping inflation, which is a global phenomenon, doesn’t that imply extraordinary USD strength? (DXY ended the week 104.65, marking a new high since 2002). Perhaps the weekend plunge in bitcoin to sub-18k as tether became untethered, is an indication. From a mid-May Forbes article, “It is difficult for Tether to follow the path of Terra completely because if they decide to take out even 30% to 50% of their collateral, that will shake up not only the crypto market but also the broader financial markets,” says Kavita Gupta, founder of Delta Blockchain Fund. “…Tether’s site states that ‘All Tether tokens are pegged at 1-to-1 with a matching fiat currency and are backed 100% by Tether’s reserves.’ Typically, this is when we find out that the reserves were of dubious value.
Powell pegged the July meeting at either 50 or 75 and Waller is out this weekend supporting 75. August Fed Funds settled 9771.0 or 2.29%. With last week’s 75 bp hike, EFFR set at 158. Another 75 in July would mean 233, so FFQ2 is leaning heavily toward that outcome. Further out, the market is clearly erasing hikes next year, as EDU2/EDU3 is the only positive one-year calendar spread until EDZ5/EDZ6 (2.5s). EDU2/U3 settled 43.5, exactly halving its value on the week, and EDZ2/EDZ3 settled -28.5, a plunge of 34. The most negative one-year calendar on the ED strip is EDM23/EDM3 at negative 45.5. I.e. in one year from now, the market is loosely projecting 50 bps of rate CUTS. Of course, that would be from higher base rates than now, as EDH3 is the lowest contract on the strip at 9601, just under 4%; EDM3 is 9607.
There are all sorts of warning signs of recession ahead. The Atlanta Fed GDP Now Is 0.0 for Q2. Back end ED and SOFR calendars are inverted. The 5/30 treasury spread is also inverted at -4.7 (3.338% and 3.291%). At the end of May 5/30 was 24 bps, it reached a low on Tuesday of -17. SPX has fallen 10.5% in the past two weeks. Credit spreads are widening. According to the St Louis Fed, CCC & lower high-yield effective is 14.25%. From Axios: “If a CCC bond is going to be 13 or 14%, that really changes the math for private equity sponsors. It’s really hard to make it work,” Christopher Miller, director of capital markets at Neuberger Berman. While 14.25% is about double the average from 2021, the covid high in 2020 was about 20%. Energy prices took a huge tumble last week as emphasis on demand destruction skimmed some froth. CLQ2 closed 107.99 down 8.5% on the week. July NatGas plunged over 21% on the week. July RBOB -9%.
While treasury yields finished higher, the week ended with a FI bid, as a flight into safety developed. Unlike everything else on the curve, the thirty-year bond this week did NOT exceed the high-water mark in 2018 which was 3.455%. The week’s high was 3.427%, so for now, a double top is in place with a test of 3% likely to occur over the near term. (Friday close 3.29%). In late 2018 as stocks sold off, thirties went from 3.45 in the beginning of November to 2.90 on Jan 3. Ultimately, bonds rallied through 2019, but this time, the Fed appears to have new-found resolve on squeezing out inflation. SFRU2 settled 9691.0 or 3.09%, meaning by Q4 positive carry will be priced out. SFRZ2 settled 9641.0 or 3.59%; higher than everything on the treasury curve; the high point is the 20y which ended at 3.53%. It may become more difficult to place treasury debt into the hands of the private market without the benefit of a positive yield curve. Declines in long rates will probably be limited. (SFR contracts refer to SOFR, the Secured Overnight Financing Rate which is the funding rate on treasuries).
It’s now two weeks from the end of Q2. Many ‘wealth managers’ suggest not even bothering to look at the returns on one’s long term portfolio, except perhaps quarterly. Anyone who compares end of March to end of June is likely to be somewhat shocked.
News this week includes Existing Home Sales on Tuesday, expected 5.4m from 5.6. New Home Sales on Friday, expected 592k from 591k. In late 2020 New Home sales hit a rate of over 1m, and to start this year 839k. The doubling of the 30y mortgage rate this year is unambiguously biting.
Powell delivers semi-annual testimony on Wednesday, which will be followed by the 20-yr auction (re-opening). Barkin speaks several times this week, starting with an interview on Tuesday. Evans, Harker and Barkin on Wednesday afternoon. Powell again on Thursday, followed by Bullard and Daly on Friday.
| 6/10/2022 | 6/17/2022 | chg | ||
| UST 2Y | 304.7 | 316.2 | 11.5 | |
| UST 5Y | 325.1 | 333.8 | 8.7 | |
| UST 10Y | 315.6 | 323.7 | 8.1 | |
| UST 30Y | 319.3 | 329.1 | 9.8 | |
| GERM 2Y | 97.1 | 109.4 | 12.3 | |
| GERM 10Y | 151.6 | 166.1 | 14.5 | |
| JPN 30Y | 108.7 | 116.8 | 8.1 | |
| CHINA 10Y | 279.4 | 281.4 | 2.0 | |
| EURO$ U2/U3 | 87.0 | 43.5 | -43.5 | |
| EURO$ U3/U4 | -39.0 | -38.5 | 0.5 | |
| EURO$ U4/U5 | -21.0 | -17.0 | 4.0 | |
| EUR | 105.18 | 104.99 | -0.19 | |
| CRUDE (active) | 118.12 | 107.99 | -10.13 | |
| SPX | 3900.86 | 3674.84 | -226.02 | -5.8% |
| VIX | 27.75 | 31.13 | 3.38 | |
https://www.forbes.com/advisor/investing/cryptocurrency/what-is-tether-usdt/
2023 spreads invert further
June 17, 2022
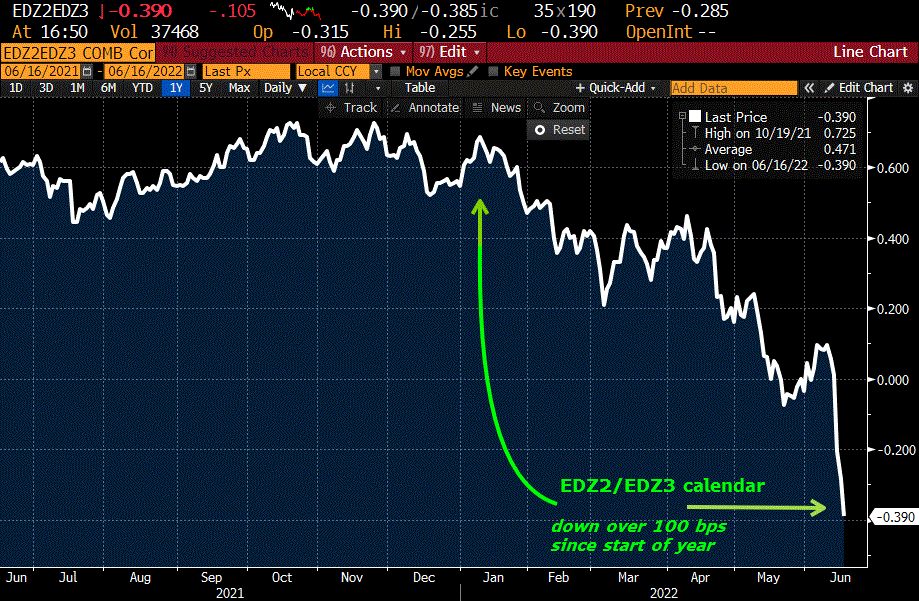
–Short end calendar spreads are sending a very clear signal about the economy and the forward path of central bank policy after hikes by the Fed, SNB and BOE. EDZ2/EDZ3 closed yesterday at -33, down 4.5, and was lower after settlement; in January it was at high as +67. The FF spread Jan’23/Jan’24 settled -15.0; prices 9640.5 and 9655.5. The Jan’23 price indicates 3.6% FF for year-end, but the inversion of spreads covering 2023 means the market perceives those rates will be restrictive enough to kill the economy and create an easing bias next year. EDH3/EDM3 settled -9.0. EDH3 now the clear winner for lowest contract on the strip at a price of 9596 or 4.04%.
–Though bonds rallied strongly, with tens down 8.5 bps at futures settlement to 3.305%, the stock market is slowly realizing what high funding rates mean. Going to be hard for companies to roll debt over without the Fed buying everything in sight, especially if fantasy non-GAAP earnings receive more scrutiny.
–BOJ stuck with ultra-easy policy, allowing $/yen to fully recoup yesterday’s loss; close to 135 now. Powell gives opening remarks this morning at 8:45, at a conference on ‘The Internat’l Roles of the US Dollar’. Even as economic fraying becomes obvious, he’s likely to cite robust labor market and consumer spending. Philly Fed for example was expected 5.5 vs actual print of -3.3. Biden noted that people are “really down” but says recession isn’t inevitable. “The need for mental health in America, it has skyrocketed, because people have seen everything upset.” Not exactly confidence-inspiring. Soooo…here come price controls.
–US rate futures halt Monday at noon Chicago time; no official settlements for Monday. Summer solstice is Tuesday.
A couple of post FOMC notes
June 16, 2022
–SNB surprise 50 bp hike from -0.75 to -0.25. Fed hiked 75 of course, so new Fed Effective should now be 158 bps. August FF settled yesterday at 9773.0, up 3.5 bps to 227 bps. Powell said the August meeting is likely to be either 50 or 75. If 50 new EFFR would be 208 or 9792 and if 75 then 233 or 9767. The market leans towards another 75, but deterioration in the economy and in stocks will likely see FFQ2 trade the midpoint at around 9780.
–EDH3/EDM3 settled negative 8. EDH3 settled 9587 and EDM3 at 9595. So, March is now the lowest contract on the strip, i.e. the end of hiking and timing for recession has moved forward. FFF3/FFF4 settled negative 5, 9641 and 9646. A price of 9641 or 3.59% on FFF3 indicates 200 bps of additional hikes over the next four FOMC meetings. Atlanta Fed GDPNow for Q2 is projecting 0.0 from 0.9 last. Ford says auto loan delinquencies are moving higher.
–By the way, the HIGHEST priced contract on the ED strip yesterday was 9660 or 3.4% and that’s EDU’25. Currently the market feels that Fed Funds above 3% will be sustained.
–Interesting projections out of the Fed. The majority of ‘dots’ see Fed Funds at 3.25 to 3.5% by year end, and 3.5 to 4% by the end of 2023. Obviously the economy should slow…that’s what the goal is: to crush demand. Therefore the change in GDP was revised lower from the last projections in March. For 2022, March was 2.8 and is now 1.7, and for 2023 March was 1.9 and now 1.7. The projections therefore are solidly indicative of a Fed engineered slowdown which will squeeze inflation out of the system, as can be seen by the estimates. In March, PCE inflation was 4.3% and now, as actual data can no longer be denied, the number is 5.2% for end of 2022. BUT, for 2023 and 2024 the estimates have been revised LOWER, from 2.7 in March to 2.6 for end of 2023, and from 2.3 to 2.2 for 2024. In the press conference, Powell said the Fed “…is not trying to induce a recession”. I guess that’s fair, but it’s coming in any case. And BBG leads off with this asinine headline: The Big Take: US Faces Fed-triggered Recession That May Cost Biden a Second Term. That’s nice, laying the blame for Biden’s gaffes at the doorstep of the Fed. It’s true that the US faces a Fed Triggered Recession…JUST STOP THERE. Political bias? nah…just good solid objective reporting.
–One last note. The market projection for year end FF is now 3.59% (as seen in January Fed Funds). Dec SOFR future settled 9638 or 3.62%. That is, as of yesterday’s close, the Fed dots and market prices weren’t all that far away.
Bloomberg:
Powell Sets Path to Restrain Economy and Stop Runaway Inflation
The Big Take: US Faces Fed-Triggered Recession That May Cost Biden a Second Term
An itsy bitsy gully
June 15, 2022
“The market’s in an itsy bitsy little gully right now. Like everybody says, ‘OK that was crazy let’s just all calm down'”. That’s a line from The Big Short, delivered by the Florida real estate agent showing Mark Baum around a subdivision with For Sale signs everywhere. (But of course it could be Christine Lagarde this morning. Or anyone long crypto). It’s not that I think the core of upcoming problems are related to residential real estate, though Compass and Redfin are cutting staff as the doubling in mortgage rates this year impacts housing. In my opinion, it’s just that the little gully might be macroeconomically much larger.
–ECB holding an emergency meeting to address market stress. Biden releasing oil from the SPR; CLN2 this morning around 117.50, about $6/bbl off yesterday’s high. FOMC today of course.
–Here are a few observations on yesterday’s trade:
1) FFF3/FFF4 collapsed to 3.5 bps, a new low. On June 1 this spread was 23.5. The takeaway is that the Fed will be done hiking THIS year, leaving nothing to do next year.
2) Nominal ED straddle levels are the highest I can remember.
For example EDZ2 95.875^ settled 94 with a bit over six months left. I guess a decline of 90.5 bps in a week in the underlying from 9676 to 9585.5 will cause expansions in premium.
3) on the other hand TYU 114.5 atm straddle settled yesterday at 3’50 with 73 days to go. On March 10, 2020 (during COVID) the TYM20 137.5 atm straddle was 4’40, also with 73 dte. (and it had been higher).
4) March’23/June’23 ED and SOFR 3m calendars both inverted around -4.5; bringing perceptions of the oncoming recession closer in time.
5) ED reds to deferred contracts steepened. As an example EDM3/EDM6 traded -85 early in the session but came back to settle -75.5. Red pack settled -3.375, grns -7.25, blues -11.125 and golds -11.5.
6) FFQ2 at 9769.5 is just a couple of bps away from what will be the new Fed Effective of 233 if the Fed hikes 75 and 75. FFF3 at 9631 suggests 286 bps of tightening thru year end, including tomorrow.
7) SFRZ2 to EDZ2 out to a new high 39 bps…no surprise as credit spreads generally widen
The last SEP in March pegged PCE inflation at 4.3% in 2022, 2.7% in 2023, and 2.3% in 2024. These numbers have to go up, as do the dots.
https://www.federalreserve.gov/monetarypolicy/files/fomcprojtabl20220316.pdf
| Summary of Economic Projections – Federal ReserveFor release at 2:00 p.m., EDT, March 16, 2022 Summary of Economic Projections InconjunctionwiththeFederalOpenMarketCommittee(FOMC)meetingheldonwww.federalreserve.gov |
Large trades yesterday include +40k SFRZ2 9750/9775/9800c fly for 1.0 (settled there ref 9624.5
+50k EDU2 9687.5/9650/9612.5p fly for 8.5; settled 8.0 ref 9657.5. new position.
+20k TY week3 113/112p spread mostly for 6; settled 8 vs 114-13, new position.
Biden picks up a fiddle as Powell shuffles deck chairs
June 14, 2022
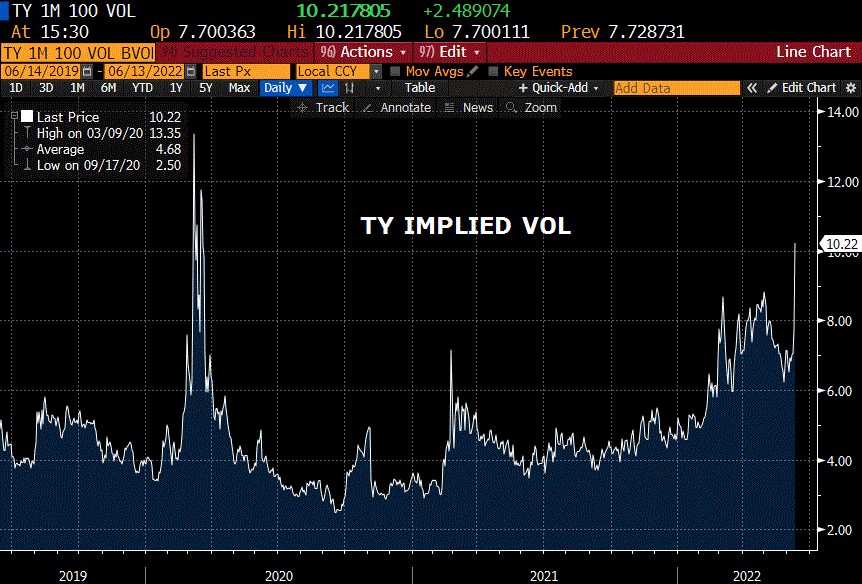
–At the 2:00pm CST settle, EDZ2 was 9609.5, down 29 on the day. Within another hour and a half it was printing 9588, down 50 on the day. I don’t think I have ever seen that sort of a post-settle move. This morning the contract prints 9591.0 and EDH3 has become the lowest priced contract on the strip at 9573, outpacing the former low-priced leader EDM3, which currently prints 9578. EDZ2 is consistent with a Fed Funds target of 3.75 to 4.0%, meaning another 300 bps over the next five FOMC meetings. The culprit for the late move was a report the Fed will hike by 75 tomorrow.
–ZeroHedge this morning leads off by highlighting a Morgan Stanley piece on Japan which features this quote: “we worry that the currency and Japanese financial markets are in the process of losing any sort of fundamental-based valuation anchor.” What is sadly amusing is that this quote could just as easily apply to financial markets across the world. Then of course, there was this comforting salve: *WHITE HOUSE WATCHING STOCK MARKET CLOSELY: JEAN-PIERRE. I’m almost surprised she didn’t add that staff was also anxiously monitoring NFT values.
–FFQ prints 9774.5 last, which is down 23 from settle. Current Fed Effective is 83 bps, and August, which captures the June (tomorrow) and July FOMCs, is 225.5 bps, a difference of 142.5 bps…nearly predicting 75 bps at each meeting. On the jolting adjustment in sentiment, the curve flattened. At settlement yesterday, the (new) red/gold pack spread, using Sept’23 and ’26 for the start of each pack, was -44.75. It’s actually around the same spot currently with reds higher on the morning as the upcoming recession is priced. EDU2/EDU3 calendar settled 99 bps yesterday and this morning EDU2 prints 9667, down 25 while EDU3 prints 9598, up 5, a plunge of 30 bps in the spread to 69. Implied vol has unsurprisingly exploded and is just shy of the covid surge.
–News today includes PPI expected 10.9 yoy with Core 8.6. This morning July WTI (CLN2) is over 121.50, $4/bbl higher than yesterday’s low and close to the high for the move.
Fear and Greed? Nah, just fear
June 13, 2022
–New lows in stock index futures this morning as we slide into quarterly expiration. Current ESM -95.00 at 3805.50. Rate futures have also plunged as fears of a 75 bp hike have gripped the market. EDM3, the weakest contract on the ED strip settled 9808.0 on Friday and is currently -23.0 at 9585.0. This contract is down over 100 bps from May 27 high, 10 sessions ago. Bitcoin is down 5000 sub 24000, and gold is just below 1860, down around $16/oz. Nowhere to hide today. TYU2 down nearly a point at 116-01.
–Friday’s U of Mich Consumer Sentiment made a new low at 50.2, beneath the 2008 plunge, and the start of this week isn’t going to help. Brainard speaks at a Community Reinvestment forum this afternoon.
–This morning prints 9798.5 in August Fed Funds, which captures this week’s and the July 27 FOMC. Current Fed Effective is 83, so with Aug at 201.5, that’s a total of 118.5 bps priced (with the 75 bp shot being primarily embedded in the July meeting). It’s going to be a day, perhaps a week, of wide markets and forced position exits.
Terminal and Neutral in Flux
June 12, 2022
Headline yoy CPI +8.6% with Core 6.0%. University of Michigan Consumer Sentiment 50.2, a historic new low. U of Mich 5-10 year inflation expectations 3.3, a level not seen since the 2008 peak of 3.4. Interest rate futures went into a tailspin, with EDH3 weakest on the ED strip, settling -28.5 at 9613.0. March’23 SOFR was also the weakest on that strip, settling -30 at 9641.0 or 3.59%. The lowest priced contract is EDM23 at 9608, -26 on Friday and -44 on the week, taking out May 3rd low settle by 23.5.
In treasuries, all maturities made new high yields except for thirties, which at 3.19% fell just a few bps shy of the May 6 high 3.23%. On the week, the two year note soared 38 bps to 3.047%. Twos and fives have now surpassed the high yields of 2018: 2y in 2018 hit 2.97%, now 3.065% and fives in 2018 reached 3.09% now 3.26%. Highs in 2018 for tens and thirties are 3.24% and 3.455% (vs current 3.16 and 3.195).
The market is now pricing a string of 50 (or more) bp hikes. I believe the first FOMC in 2023 is Feb 1, making Jan’23 a clean month for Fed Funds; FFF3 settled 9680.5 or 319.5 bps. Current Fed Effective is 83 bps, and there are five FOMC meetings before Jan’23 expiry, including this Wednesday’s. So that’s an average of 47.3 bps per meeting. Of course, near contracts have a bit more than 50 priced. For example, August FF which captures both next week and the July 27 meeting, settled 9803.5 or 196.5, an average of 56.75 for each of the two meetings. SPX down 5% on the week and Nasdaq Comp -5.6%.
5/30 re-inverted to -6.5 bps; the low in March was -12.9. What’s notable is that while red/gold euro$ pack spread settled at a new recent low of -56 (using the June contracts for one last day), it’s well above the April 1 low of -87. The attached chart is instructive.
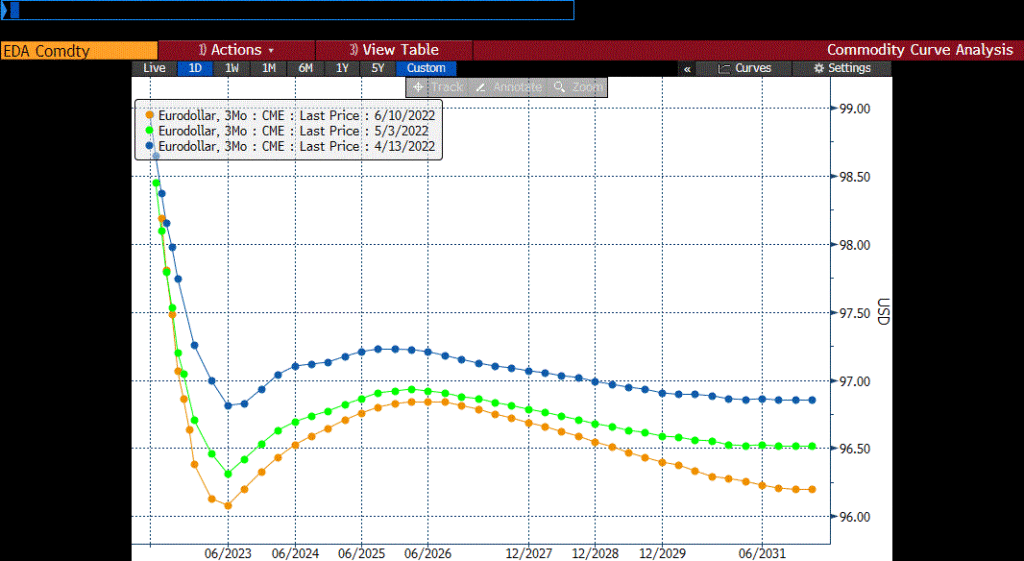
That’s the Eurodollar futures curve. The amber dots are from Friday (June 10). The green dots are from May 3 when EDM’23 had put in its previous low settle at 9631.5. The blue lines are from 2 months ago. What is interesting is that, although the curve is inverted for the next couple of years starting in the middle of 2023, the amber dots from June 2026 forward are becoming steeper. I would take this as a rather bearish indication that forward inflation expectations are becoming more entrenched. That’s not quite borne out by the 5y5y forward inflation swap, which at 274 bps remains below late April (just above 280). I would simply conclude that the ‘terminal rate’ is moving steadily higher with much less certainty about its value. Weekend headlines like these: ‘US gasoline average price tops $5 per gallon in historic first’ (RTRS) and ‘Average rents top $2000 for the first time in US history’ only solidify rising inflation worries, and spill into a general sense of malaise.
Here are a couple of excerpts of Credit Bubble Bulletin commenting on the quarterly Z.1 report, emphasis added:
Household Net Worth was up $12.706 TN (9.3%) over one year, and $37.830 TN (33.9%) over three years – in history’s greatest inflation of perceived wealth. Household Net Worth-to-GDP declined to 612% (from 624%). But this compares to 491% at cycle peak Q1 2007, and 445% during peak Q1 2000. Years of asset inflation have fueled a consumer spending boom. The downside of the cycle will see sinking asset prices and tightened Credit conditions significantly restrain household spending.
…as bank and financial shares came under heavy selling pressure (with bank CDS moving sharply higher), gold enjoyed a burst of strong buying – ending the session up almost $24.
As yields rise, future streams of income are more heavily discounted leading to asset price declines. This dynamic is likely to be a major factor in the reversion of Household Net Worth relative to GDP. There have been several commentators, notably Bill Ackman, who have said that aggressive rate hikes now will cause longer dated bonds and other long maturity assets to rally. Refer back to the ED curve. The market is pricing in an ever more aggressive Fed, but the most deferred contracts are going down.
As a friend notes, gold is most responsive to crisis conditions in the global financial architecture, not necessarily inflation. The gold/silver ratio ended at 85.5. A key level appears to be 92 to 93, corresponding with the early 1990’s highs and the high from mid-2019. During 2020’s covid crisis it popped to 124. Gold itself has a double top around 2075, from the covid high and then the Russian invasion surge. XAU ended the week 1871.60. A close above 1915 portends new highs.
Any way they can do 75 on Wednesday? I calculate odds of just under 20%. Other news on the week includes NFIB Small Business Optimism, which was 93.2 last and has a covid low of 90.9. PPI also on Tuesday, yoy expected 10.8% with Core 8.6%. Retail Sales and the FOMC Wednesday.
OTHER MARKET THOUGHTS/ TRADES
SFRZ2 (December SOFR) settled 9674.0 or 3.26%. That’s higher than every on-the-run treasury yield except for the 20 yr, which implies NO positive carry. Current SOFFRATE is 75 to 80 bps.
EDH’26 settled 9684.0, which is near the highest price/lowest yield on the ED curve except for EDU2. The SEP quarterly projections from the Fed go out to 2024, and then “Longer Run”. In March, PCE inflation in 2024 was projected at 2.3% with longer run at 2%. There’s a reasonable chance that all inflation forecasts besides ‘Longer Run’ will be bumped up. 3EH 9500p (expires on EDH’26 underlying, 3/10/23) settled 5.25. 3EH 9600/9500ps settled 12.5. While there’s no open interest in Blue midcurve SOFR options to speak of, 3QH 9525p settled 4.75 ref SFRH6 9710.0s. The pit is making decent markets in SOFR midcurves. Given weakness in more deferred contracts, it’s worth looking at puts on this part of the curve.
| 6/3/2022 | 6/11/2022 | chg | ||
| UST 2Y | 266.7 | 304.7 | 38.0 | |
| UST 5Y | 295.1 | 325.1 | 30.0 | |
| UST 10Y | 296.2 | 315.6 | 19.4 | |
| UST 30Y | 311.2 | 319.3 | 8.1 | |
| GERM 2Y | 66.2 | 97.1 | 30.9 | |
| GERM 10Y | 127.3 | 151.6 | 24.3 | |
| JPN 30Y | 102.3 | 108.7 | 6.4 | |
| CHINA 10Y | 280.7 | 279.4 | -1.3 | |
| EURO$ U2/U3 | 72.0 | 87.0 | 15.0 | |
| EURO$ U3/U4 | -31.5 | -39.0 | -7.5 | |
| EURO$ U4/U5 | -8.0 | -21.0 | -13.0 | |
| EUR | 107.19 | 105.18 | -2.01 | |
| CRUDE (active) | 118.87 | 120.67 | 1.80 | |
| SPX | 4108.54 | 3900.86 | -207.68 | -5.1% |
| VIX | 24.79 | 27.75 | 2.96 | |
CPI today
June 10, 2022
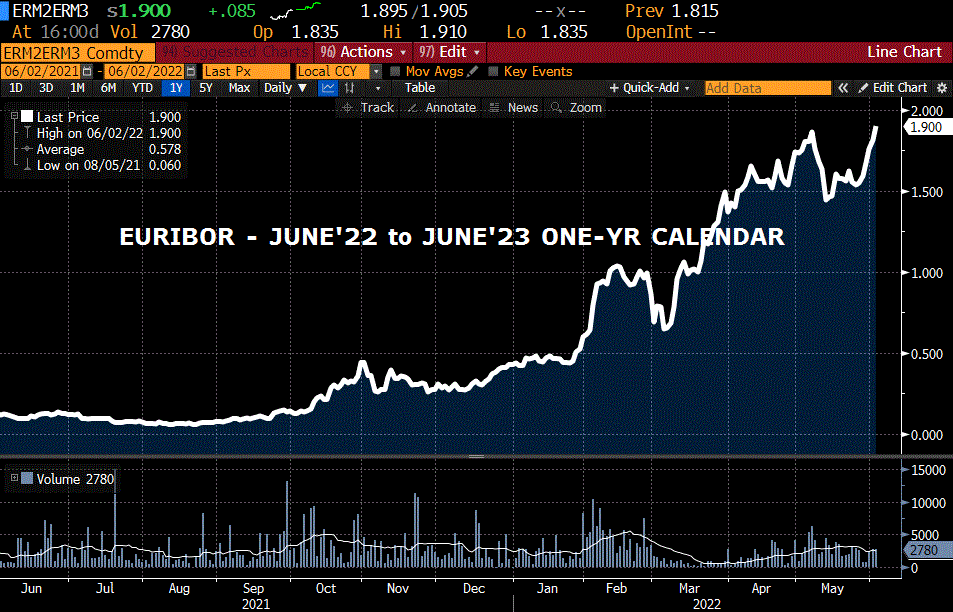
–A friend is calling it “the Biden rally” (thanks PC). SPX -2.4%. Yields rose with near ED calendars posting new highs. As EDM2 expires Monday, EDM2/EDM3 jumped 8.25 to 188.5. It’s the same in euribor with M3/M3 190. EDM2/EDU2 settled at a new high 93.0. Oct FF settled 9770.5, just a few bps higher in price than they should be if the Fed hikes 50 at each of the next three meetings. The curve flattened, with 5/30 spread down 4 bps to 10.5. On April 21 I had marked it at -2 bps, with a subsequent rally to 27. Markets are fragile, and the Fed’s forced pivot to inflation-fighting is adding to vulnerability.
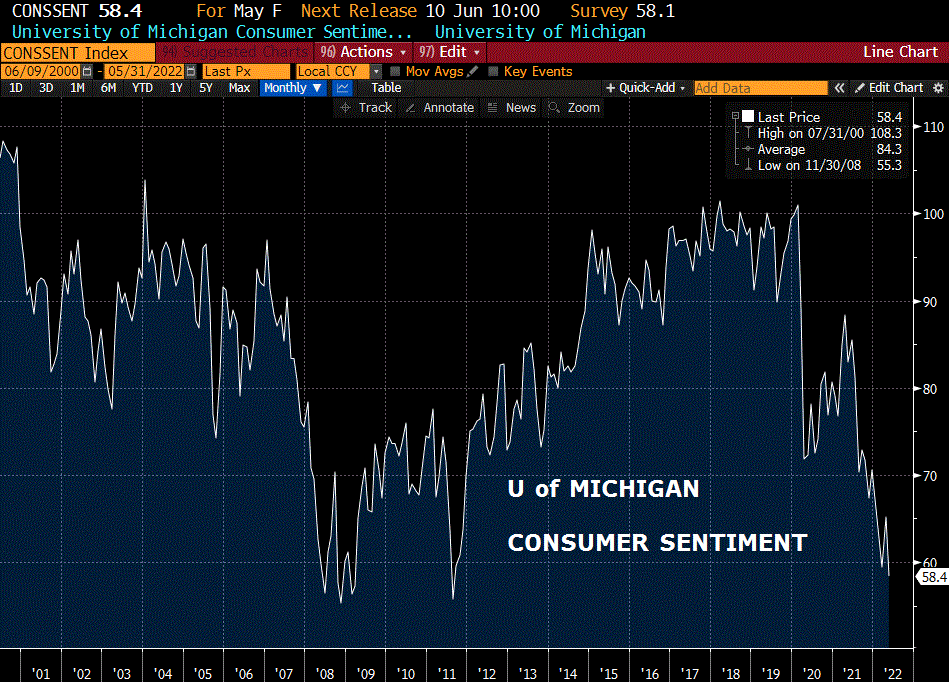
–Today brings the CPI report, expected 8.3% yoy, same as last, with Core 5.9 from 6.2 last. Yesterday’s Z.1 (flow of funds report from the Fed) showed Net Worth had declined slightly. In Q1 SPX fell 5%, so far in Q2 it’s down 11%, so things aren’t exactly better. Of course, real estate was marked higher in the report. Which brings us to today’s U of Michigan Consumer Sentiment report. Last was 58.4, which is nearing the lows of the Great Financial Crisis in 2008 at 55.3.
ECB today. US 2yr near new high
June 9, 2022
–Going into the last few days before June expiration, EDM2 calendars are pressing new highs (EDM2 is pegged and back contracts fell). EDM2/M3 settled 180.25 vs high 182 on April 21. EDM2/U2 settled at a new high 90.75. October Fed Funds settled 9772.5 or 2.275%; if the Fed hikes 50 in June, July and Sept then EFFR will be 233, or a futures price of 9767. The two-year note was 2.772% late, up 4 bps, pretty much matching May 3rd high of move at 2.78%. Tens rose 5.2 bps on auction day, with a yield of 3.024%. CLN2 was at a new high of 122.50 late, obviously keeping pressure on the Fed to DO SOMETHING.
–Today brings the ECB meeting, US Jobless Claims (expected 210k) and the quarterly Z.1 Fed report which highlights debt levels and Household Net Worth. SPX fell 5% from Dec 31 to March 31, so total net worth was likely stagnant. It’s worth taking a look at the summary tables on debt in this report. HouseHold debt doesn’t look all that bad while gov’t debt has exploded. Pre-covid 2019 total HH debt was 16.099T end of 2021 $17.933, up 11.3% over 2 yrs. Total business debt: 2019 $16.283T to 18.541, an increase of 13.8% in 2 yrs. Fed’l gov’t in 2019, $19.040 and at end 2021, $25.314T, an increase of 33%. That’s a huge factor which supported and spurred ‘growth’ and inflation.
–Thirty-year auction also occurs today (re-opening). Yield at futures settle was 3.17%. Tomorrow CPI is released with the headline number expected 8.3%, so that’s a big negative yield on the bond unless inflation starts falling in a hurry.
–A contributor on BBG multi-strat chat noted that WTI priced in yen had taken out the 2008 high, which in dollars was around $145/bbl.
–Implied vol in treasuries rose as yields firmed. TY back to 7% or higher.

