
Watch TIPS
May 3, 2022
–Fives, tens and bonds all ended above 3% on Monday, with 10s up 12 bps to 3.006%. The curve steepened with the 2y note up only 3.7 to 2.733%. On the eurodollar strip reds were down 7.125, greens -11, blues -12.375 and golds -14.875 (new lows for the move in the back end of the curve). The big story is that REAL yields exploded higher. For example, the ten-yr inflation indexed note rose 20 bps from -3.7 to +16.7. In a general sense, real yields that are negative are expansionary; a move to more restrictive real yields is disinflationary and indeed gold was crushed by $50/oz. It’s around 1850 this morning, down over 125 in two weeks. As can be seen from the attached chart, the real yield as expressed by the ten-yr tip has been negative since covid. A move to positive is possibly the start of big change in sentiment, indicating that the Fed will carry through on policies to stifle growth and inflation.
–RBA (Australia) raised the cash rate by a quarter percent from 0.10 to 0.35 to withdraw “…some of the extraordinary monetary support.”
–The treasury announced new borrowing estimates. For the Apri-June period, Treasury expects to pay down $26 billion. “The borrowing estimate is $92b lower than announced in January 2022, primarily due to an increase in receipts, partially offset by increases in outlays…” This small change in supply is pretty meaningless against the backdrop of balance sheet reduction. In the bigger picture, higher yields and a decline in forward expectations of inflation will draw capital to bonds.
https://home.treasury.gov/news/press-releases/jy0755
Powell on Wednesday
May 2, 2022
–Friday featured a decline in equities, with SPX -3.6% and Nasdaq Comp -4.2%. Interest rate futures remained under pressure led by weakness in front, as EDU2 and EDZ2 both made new lows for the move. On Dec 31, EDZ2 settled 9895.5. On Friday it settled 9677.0, 218.5 bps lower in four months! FFF3 settled 9717 or 2.83%, pricing exactly 250 bps (more) of hikes by year end. We’ll get started with 50 at Wednesday’s meeting, but Powell will have to talk tough even as asset values crumble. There are five FOMC meetings remaining in the year after this one.
–As mentioned, EDZ2 led the weakness, settling down 8 on the day at a yield of 3.23%. The two-yr yield rose 5 bps to 2.696%, while tens and bonds were up around 2 bps each, with tens 2.887%. EDM2/EDU2 settled at a new high of 83.5 bps, which is approximately half of EDM2/EDM3 which closed 168.5. They’re ripping the band-aid off this year. Next year is forecast to be a different story, with EDH3/EDH4 settling at new recent low of negative 17. This morning there appears to be some rotation for the new month, with stocks up slightly and commodities losing ground as the dollar continues to trade with a strong bid.
–Today brings ISM Mfg expected 57.5 from 57.1 last. FOMC on Wednesday and Payrolls on Friday, expected around 400k.
Colder by the Lake
May 1, 2022 -Weekly Comment
We’ve entered that phase of the year when every kid from the west suburbs of Chicago used to hear this from their moms if they were going downtown, “Take a coat. It’s colder by the lake.” It’s a bit of sage insurance advice. Oak Park, where I grew up, is about nine miles due west of the Lake Michigan shoreline, and the difference in springtime temperatures could easily be 10 degrees.
Here are a few ytd percentage changes in equity indices:
DJIA down 9.4%
DJT down 9.8%
SPX down 13.3%
R2K down 17%
Nasdaq down 21%
The colder lakefront temperatures are currently associated with “innovation” and “disruptors” in today’s stock market. If you didn’t already have some insurance in the form of puts, it might be a bit late now (or might not), as highlighted by the chart below. It’s the ARK Innovation fund pictured over the date range of May 2019 until now. From its high in the beginning of 2021 until Friday it lost 70% of its value, pretty much a full round-turn from pre-covid. Overlaid in pink is the Nasdaq “bubble” from June 1998 to June 2001. From its high in March 2000 to its low a year later, it fell 67%. Unfortunately, the March 2001 low was not the ultimate low, that came over a year later in October 2002 at 1114, which was another 30% lower than the March 2001 low of 1639.
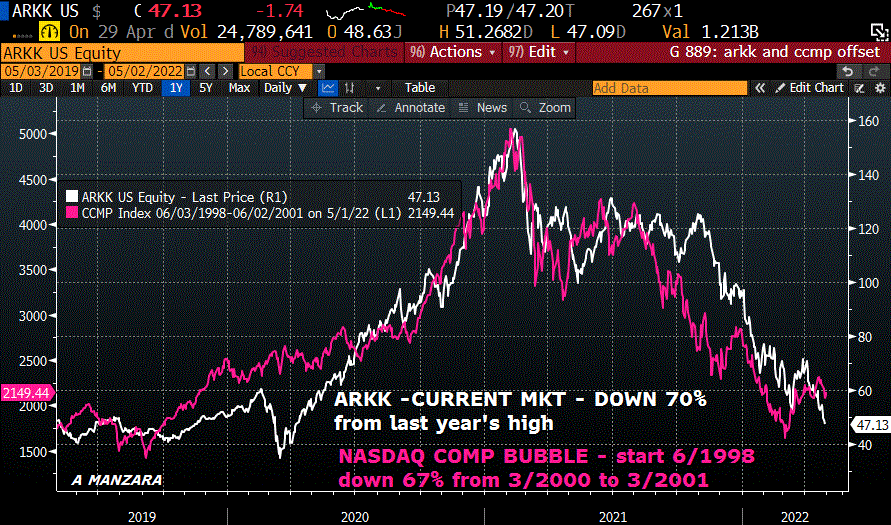
Investors tend to get giddy when they’re presented with new innovations, and they tend to overlook possible obstacles and competitive challenges, especially when there are no funding hurdles. In hindsight, the “innovation” of 2020 was the overwhelming stimulus from the Federal Gov’t and from the Federal Reserve. It has now gone into reverse-novation. It’s little wonder that Q1 GDP was -1.4% though it was expected +1.2. Stimulus checks ran out. Debt and rent forbearance are over. Yoy growth in M2 had surged over 26% in the beginning of 2021 and is now 8.6%, still high, but much closer to pre-pandemic levels. Inflation expectations have shifted higher. A more stagflationary period appears to be ahead, as reflected by the negative Q1 GDP number with PCE deflator released the following day at 6.6%. The state of the equity market was aptly described by Charlie Munger, “We have people who know nothing about stocks being advised by stock brokers [TV commentators] who know even less.”
On Wednesday, Powell has an in-person press conference following the FOMC announcement. His job is to underpin the Fed’s commitment to anchored inflation expectations, which have floated well away from the pier. On November 11 of last year Powell retired “transitory” from the Fed’s lexicon of price pressures. At the Dec 15 FOMC, he advocated a “gradual pace of firming” but also opined “I wouldn’t say we’re behind the curve” in response to a reporter’s question. In support of a more hawkish tilt, he mentioned the ECI, (Employment Cost Index) released just before the Nov 3 FOMC, the strong employment report two days after the meeting and the CPI report which followed a week later. At that time QoQ ECI was 1.2%, and last week it was reported at a record 1.4% for Q1 22. The CPI report cited by Powell was 6.2% (released 11/10) but is last at 8.5%. The unemployment report was 4.6% (on 11/5), but last at 3.6%. In December the projections for year-end 2022 were as follow: Fed Funds 0.9%, PCE prices 2.6% and GDP 4%. At the last meeting in March: FF 1.9% (up to 2.8% by the end of 2023), PCE prices 4.3% and GDP 2.8%. There are no projections at this meeting, but the January 2023 FF contract, which prices the end of 2022, is currently 9717 or 2.83%, a full year ahead of schedule.
In short, the data has become much more challenging for the Fed, using Powell’s own guideposts. In 2018, it was the 20% drop in SPX from October to the end of December that sparked an end to the Fed’s tightening. From this year’s high on January 3 of 4796, a 20% drop would be 3837. We’re now 4132. However, re-anchoring inflation expectations, which the Fed has repeatedly said it has the tools to accomplish, means ignoring asset prices. We’ll see if the Fed can stand the pressure around SPX 3800, especially in light of headlines like this: “Top Five U.S. Stocks Lose $1.2 Trillion in Value in April.”
Some commentators are saying that last week’s stock market sell-off was due to fears of a 75 bp move at this week’s FOMC. If the Fed hikes 50, the projected level for May Fed Funds (FFK2) would be 9923.5. Friday’s settle was 9921.5. A hike of 75 would put FFK2 at 9902.0. It’s pretty clear that the market is NOT expecting 75 at this meeting, pricing just reflects someone bringing a light jacket.
It does, however, remain abundantly clear that the market has accepted the Fed’s prescription of front-loaded hikes. EDM2/EDU2 three month Eurodollar calendar settled at a new high of 83.5 on Friday (9807.5/9724.0). EDM2/EDM3 one-yr calendar settled 168.5. So the three month spread is nearly half the one-year spread. That’s a FRONT LOAD. In fact, EDM’23 is (still) the lowest contract on the ED strip at 9639.0 or 3.61%, while on the SOFR strip it is also SFRM’23 at 9672.0 or 3.28%. Contracts following June’23 are at successively higher prices / lower yields. The message is that the market puts the terminal rate at 3.25 to 3.5% which, by extension, is the level at which inflation is eventually tamed in a stagnant growth environment.
| 4/22/2022 | 4/29/2022 | chg | ||
| UST 2Y | 267.0 | 269.6 | 2.6 | |
| UST 5Y | 293.3 | 291.6 | -1.7 | |
| UST 10Y | 290.2 | 288.7 | -1.5 | |
| UST 30Y | 294.7 | 294.7 | 0.0 | |
| GERM 2Y | 27.6 | 26.1 | -1.5 | |
| GERM 10Y | 97.0 | 93.8 | -3.2 | |
| JPN 30Y | 101.4 | 96.2 | -5.2 | |
| CHINA 10Y | 284.5 | 284.0 | -0.5 | |
| EURO$ M2/M3 | 171.5 | 168.5 | -3.0 | |
| EURO$ M3/M4 | -38.0 | -39.0 | -1.0 | |
| EURO$ M4/M5 | -21.5 | -16.5 | 5.0 | |
| EUR | 107.90 | 105.46 | -2.44 | |
| CRUDE (active) | 102.07 | 104.69 | 2.62 | |
| SPX | 4271.78 | 4131.93 | -139.85 | -3.3% |
| VIX | 28.21 | 33.40 | 5.19 | |
Fed policy pivot 2H 2023
April 29, 2022
–Yields rose yesterday and the curve flattened, even as US Q1 GDP was reported at -1.4% vs expected +1.1%. The two year rose 7 bps to 2.646%, while tens added 5 to 2.863%. There were a couple of large trades in euro$ options: early buyer of 25k 0EQ 9750/9775cs for 2.5 (settled 2.25 vs EDU3 9654.5). Exit seller of 45k 0EZ 9550/9500ps at 6.25 to 6.0 (settled 6.25 vs EDZ3 9665.0). These underlying contracts, EDU3 and EDZ3, are only three months apart; the futures spread settled -10.5, and yet strike prices are 200 apart on these option trades, simply indicative of a huge range of possibilities in a market that was completely staid a few years ago.
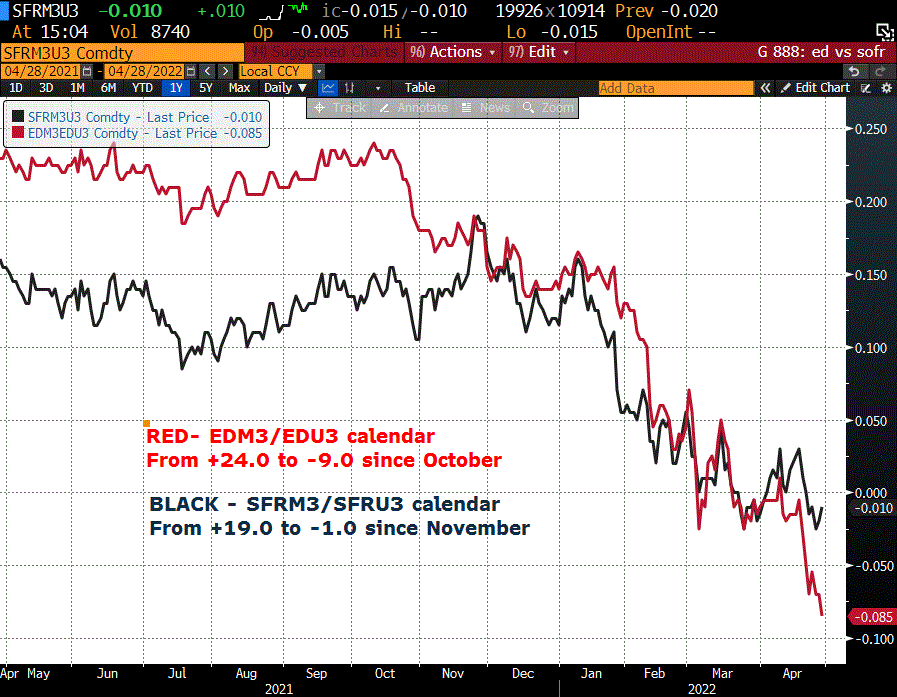
–The attached chart is also focused on this part of the curve, namely the reds, or the second year forward on the eurodollar strip. The chart is the spread EDM’23 to EDU’23, which settled at a new low of -9.0 yesterday (9645.5 and 9654.5). The lowest low for a 3-month calendar was set last Friday and it was the next spread forward, EDU’23/EDZ’23 at -11.5 (settled -10.5 yest). On the SOFR curve, M3/U3 settled at -1.5, while U3/Z3 is the low point at -10.5. As the chart shows, EDM3/U3 was +24 in early October, when we thought the Fed would hike at a slow and measured pace, but plunged on Bullard’s blather of front-loaded aggressive hikes. Market pricing is concentrated on the second half of next year for when the economic slowdown accelerates and potentially causes a shift in monetary policy with a bias toward easing.
–I included the SOFR spread for another reason. Libor will be discontinued after the end of June’23, and ED contracts will change to SOFR at a spread of ~26. The SOFR/ED spreads in U3, Z3, H4 are pegged within a bp of 26. However, SFRM3 to EDM3 is 34, which gives the bittersweet taste of what’s lost with the end of EDs, namely a credit aspect. SFRZ2/EDZ2 is a spread of 37.5 (9722.5/9685.0). The idea of a turn in policy in the second half of next year is still reflected in SFRU3/Z3 at -10.5.
–One other note about the initial trade cited, the 0EQ call spread. It expires Aug 12, which covers the July 27 FOMC. I would note that the KC Fed’s Jackson Hole Symposium, which might grow in significance as this year progresses, is usually at the end of August.
–Today’s news includes the Fed’s preferred measure of inflation, Core PCE prices expected +5.4%. There was a late buyer yesterday of TY week-5 (today’s) 119.25p, paying 14 for 33k…protection against an outlier high number? TYM2 settled 119-115 but easily absorbed the put buy and was trading 119-14 shortly after.
King Dollar
April 28, 2022
–Treasury weakness into the end of the day with TYM trading 119-215 late; currently 119-28 in front of today’s Q1 GDP release, which is expected 1.0 to 1.2% with the Price Index +7.2%. Jobless Claims 180k, and the treasury auctions seven-year notes. Relief rally in stocks this morning as FB was better than expected. Today AAPL and AMZN report.
–The dollar continues to surge with $/yen 130.58 as the BoJ clings to easy policy. CNY has weakened from 6.35 to 6.61 so far in April, and EUR broke 105, with GBP near 1.25. Commodities priced in dollars are becoming a huge strain on emerging economies. Sweden’s Riksbank raised rates and is going to start shrinking its balance sheet in a policy shift which acknowledges the inflation problem that the ECB is still trying to ignore. FOMC next week with Powell giving an in-person press conference. Tomorrow is the Fed’s preferred measure of inflation, Core PCE prices, expected 5.3 to 5.5% from 5.4 last. Also released tomorrow is the ECI (Employment Cost Index) expected 1.1%. The 1.3% figure for Q4 was one of the contributors to Powell’s hawkish pivot.
NEUTRAL! (then ease)
April 27, 2022
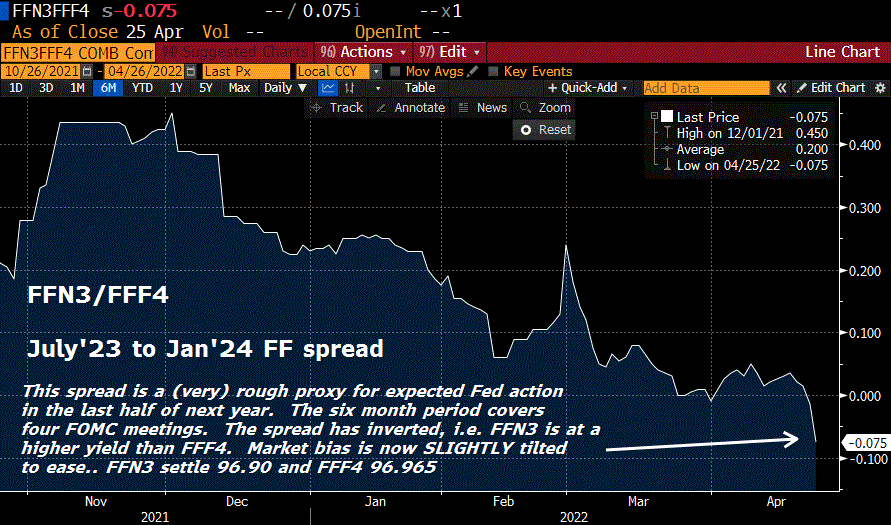
–SPX fell 2.8% yesterday, down 121 to 4175.20, and has now completely reversed the torrid short covering rally which followed the March FOMC. As mentioned in yesterday’s note, the market is starting to suspect the Fed will fold like a cheap suit if equity market weakness persists. Here are some changes in rate markets yesterday: EDM2/EDM3 one-year calendar spread settled at a new recent low of 152.5. This is down an astonishing 30 bps from last Thursday’s high of 182 (so one hike erased). January 2023 Fed Funds, which prices aggregate hikes through the end of this year settled 9731.0 or 2.69%. The low settle last week was 9717. Measured against the current EFFR of 33 bps, FFF3 projects 236 bps of hikes through the end of year, easily within majority estimates of “neutral”, However, FFF’24 settled 9696.5, only 34.5 bps higher in yield, meaning that the market looks for a quiet Fed through 2023. In fact, as the attached chart shows, July’23/Jan’24 Fed Fund spread has inverted, settling at -6.5. That is, the yield on the July contract is higher than it is projected six months later. This period covers 4 FOMC meetings, and reflects a bias toward easing BY THE SECOND HALF OF NEXT YEAR. In eurodollars, EDM3/EDU3 settled at a new low of -7.0 (9661.5/9668.5). Same message. SFRM3/SFRZ3 settled negative 12. Same message again. Bullard has had his day in the sun with tightening bravado, but it’s going to be Powell who gets in front of reporters and stoically tries to say that asset prices don’t matter, until he’s forced to pirouette like a ballerina as he did at the end of 2018.
–GOOGL got spanked after the earnings report, shaving over $100 billion of market cap off the stock, or a couple of TWTRs. TSLA lost a couple of TWTRs as well. This morning the major indexes are seeing a modest bounce. Shifting away from paper assets, it’s worth noting that July Soybean Oil is at a new high of 84.20 this morning, nearly triple its price from 2 years ago.
–Five year note auction today. Pending home sales. Earnings from FB, CME, Boeing, Bunge, and Spotify. Bunge is up 35% since the start of December, while SPOT has lost 2/3rds of its value since November.
Pricing the Fed’s Resolve
April 26, 2022
–What has been the weakest (lowest priced) contract on the eurodollar strip bounced the most on Monday with EDM3 +14.5 to 9650.5, as the market re-assesses whether the Fed will have the resolve to walk the walk on aggressive rate hikes in the face of weakening stocks. From the highs in November, Russell is down 20%, Nasdaq Comp -19%, and from the high made in January SPX is down 10.4%. Heavy tech earnings reports in the next few days, with MSFT, GOOGL and TXN today (along with V, RTX, ADM…). A slowdown in GDP growth will also test the Fed, with advanced Q1 GDP expected 1.1 to 1.3% on Thursday. GDP Now from the Atlanta Fed is currently projecting 1.3. On Friday, the Fed’s preferred inflation data are out, with PCE deflator expected 6.7% from 6.4 last, and Core 5.3% vs 5.4 last. Lower growth, high inflation.
–The curve steepened, most notably on the ED strip, with reds, the second year forward, +12.25, but greens and blues only +7.125 and +7.25. The 2y note yield fell 8.7 bps to 2.626% in front of today’s auction. New recent low posted in EDU2/EDU3 spread at 76.5. EDU2 was +7 to 9732.5 while EDU3 jumped 13 to 9656.0. EDM2/M3 settled 161, so the difference in these spreads reflects front-loaded tightening. A new low in EDU2/U3 is consistent with a rapid move to “neutral” followed by stagnation. Indeed, the spread between FFN3 and FFF4 (July to Jan Fed Funds) settled at an inverted -7.5, 9680.5 vs 9688.0 with the former +14 and latter +20. According to this spread (which had been settling around +1 to +5), the bias for the second half of next year is for easing rather than tightening.
–Yesterday, I marked the long green atm straddle strip at 724 bps (sum of EDM4, U4, Z4 9687.5^ with EDH5 9700^). A couple of weeks ago, the strip (I believe it was all the 9700 strike at the time) traded 656. The long-dated straddles are pumped! I suppose it should be no surprise, given daily ranges like yesterday’s, where EDM4 had a range of 25.5, and the straddle settled 173.25. The back end of the dollar curve is inverted, with reds (2nd yr) at 9662 or 3.38% while greens (3rd) are 9689 or 3.11%. The takeaway is that uncertainty is highly priced, even in the not-too-distant future.
Powell today
April 21, 2022
–From SF Fed’s Daly yesterday (BBG)
“I see an expeditious march to neutral by the end of the year as a prudent path,” Daly said Wednesday in a speech in Las Vegas, noting that most forecasters see that level lying around 2.5%. “Moving purposefully to a more neutral stance that does not stimulate the economy is the top priority.”
–Yesterday Jan’23 FF contract settled 9740.5 or 2.595%. EDZ2 settled 9702.0 or 2.98%, and Dec SOFR (SFRZ2) was 9734.5 or 2.655%. The market has priced Daly (and Evans) already. In fact, EDZ2 at 2.98% is 14 bps higher than the 10yr treasury (2.842%, down 7 bps on the day) and 8 bps higher than the 10-year swap (2.90%). Therefore, the market has priced an aggressive Fed for this year into 2023, but continues to see a terminal rate at or below 3.5%. The lowest ED contract is still EDM3 at 9650.5 and the lowest SOFR contract is U3 at 9678.0. That’s with Core PCE deflator at 5.4%, so if inflation doesn’t recede, a supposedly ‘neutral’ of 2.5%, and a ‘terminal’ of 3.5% would continue to be negative real rates.
–The curve flattened yesterday on the hawkish comments, with 2’s unchanged and 30’s down 10.6 bps to 2.863%, helped by a strong 20y auction. Today we have Powell’s take on things.
2yr yield, ED5 and Fed Funds
April 20, 2022
–Yields continue their ascent, with tens adding another 5.3 bps to 2.913%. The thirty year ended (at futures settlement) just shy of 3% at 2.989%, up 4 bps, and the ten year swap was also marked near 3%, at 2.973%. Volume was light. The weakest contract on the eurodollar strip was EDU’23 at down 15.5, settling 9651.5, but the lowest settle is still EDM23 at 9651.0, more on that below.
–The Fed’s preferred measure of inflation is Core PCE deflator. On March 31, that data point was released for February at 5.4%. In the Fed’s projections from March, the estimate for Core PCE was 4.1% for 2022 and 2.6% for 2023. I had a friend ask me to poll clients as to what they thought it would be in June 2023. (Thanks JC) His guess is over 5%. Mine is 4.5%. Respond to this e-mail if you care to, and I will aggregate.
–A couple of website blurbs are citing the possibility of positive real yields as a large risk for markets. While the ten year inflation-indexed note is nearly positive at -4 bps, yields across the board vs actual inflation are negative. According to St Louis Fed’s website, the BofA Hi-Yield effective yield is 6.4%, still well below the last CPI reading.
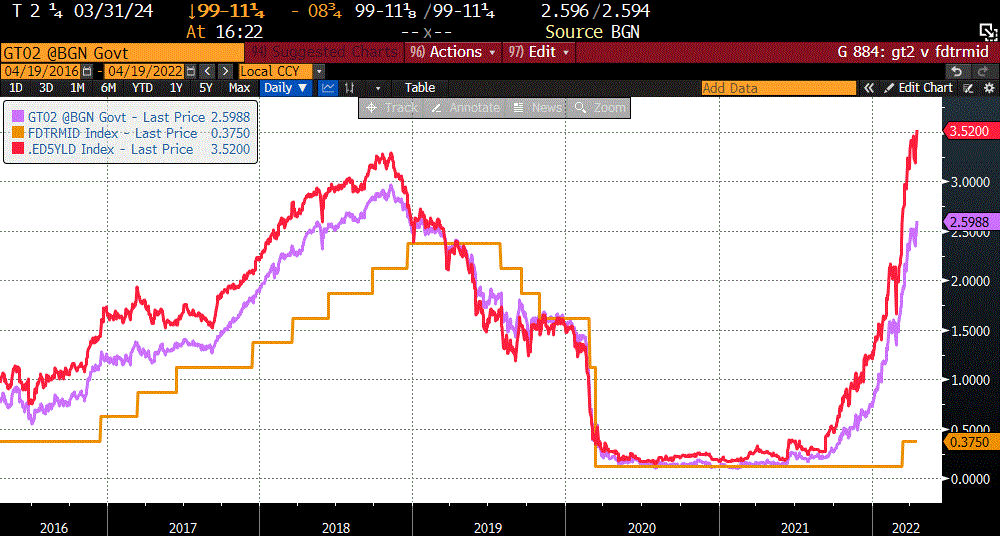
–The above chart shows the mid-target for Fed Funds in amber. The two year note yield is purple. In red is the 5th quarterly eurodollar contract, currently EDM’23, which, as noted above is the lowest contract on the strip at 9651.0 settle. The sixth contract, currently EDU23, settled 9651.5, so these two are essentially 3.5%, consistent with a FF target of 3.25%. Though not shown on the chart, this is the lowest price for the 5th quarterly since 2008. In 2018, the lowest settle for ED5 was 9671.5. By comparison, the high yield in the 2yr treasury was 2.96% in 2018, and yesterday, even at a new high for this move, it’s 2.58% or 38 bps lower! The high in the 5y yield in 2018 was 3.09%, now 2.89% or 20 bps away.
In 2018, the 2y made its high yield of 2.96% in November, with the FF target 2.0-2.25%. The final hike was in December 2018, raised to 2.25-2.5%. It had taken two years to hike a total of 200 bps. Currently, we’ve experienced just one hike of 25, with 50 bp moves priced for each of the next two meetings in May and June. The forecast embedded in EDM’23 is quite astounding.
Yen falls
April 19, 2022
–Light volume associated with Easter Monday. Yields pushed to new highs with tens +5.6 bps to 2.86%, and 2/10 also edged to a recent high at 40.4, up 3.5 on the day. Buyer of about 20k FVM 116.5c for 3 to 3.5, settled 3 vs 113-06 (strike is over 60 bps away; new position).
–Implied vol edged a bit lower as we go into May treasury option expiration, though still pumped.
–Bullard brought up the prospect of a 75 bp hike. The last time the Fed hiked by 75 was November 1994, from 4.75 to 5.50%. In any case, July FF settled unch’d at 9867.5 or 1.325% vs the current Fed Effective of 33 bps. I.e. the market is set on the idea of two 50 bps hikes in May and June; it’s priced already.
–Yen continues to make new lows. $/yen from around 115 in the beginning of March to 127 yesterday and 128.30 this morning. TY and US also at new lows; 119-135 vs 119-205s and 139-21 vs 140-06s.
–Housing Starts today for March, expected a bit lower as mortgage rates begin to bite. Evans speaks at 11:00.
https://www.bankrate.com/banking/federal-reserve/history-of-federal-funds-rate/#2011

