
Rates move higher
April 18, 2022
–No relief for longs in rate futures. On Thursday the ten year yield rose 11.7 bps to 2.804%, with TYM settling 119-30. This morning TYM prints 119-20 with the cash yield moving ever closer to 3% (now 2.86%). 2/10 spread and other curve measures continued a furious rebound, with 2/10 ending Thursday at 37 bps, having printed negative 5.5 at the start of the month. April treasury options expire Friday, with TYJ 120 straddle settling 1’06.
–Equity futures are lower following Thursday’s monthly option expiration. Commodities are generally higher, with gold again tickling $2000/oz and May Wheat up 20 cents at 1116. April bitcoin future is at a new recent low, just under 39000. Yen made fresh 20 year lows, even as Kuroda’s comments today caused a brief bounce. $/yen hit 126.79 before Kuroda; the yen is nearly 10% lower vs USD than it was in the beginning of March.
–Bullard speaks this afternoon. Beige book is Wednesday.
immature markets
April 17, 2022 -Weekly comment
Jack Dorsey Tweet NFT Once Sold for $2.9 Million, Now Might Fetch Under $14,000
Modest bids for the tweet, which was converted to a nonfungible token last year, reflect a maturing NFT market.
The above is clipped from Sunday’s WSJ site. “Maturing market” is a rather charitable description of something that has lost over 99.5% of its “value”. This, at a time when TWTR and the exploits of Elon Musk have dominated the news. A Forbes article explains that Dorsey created an NFT of his first five-word tweet in December 2020, and initially it “garnered little interest” but in “March 2021, the market entered hype mode” and the NFT sold for $2.9m. “On April 5, Estavi put the NFT up for auction for 14,969 ether, or about $50m. Embarrassingly, no one bid more than $280.” So it sounds like even the quoted $14,000 might be a bit generous.
The Forbes piece named OpenSea as the digital marketplace for NFTs. Having checked the site and watched a short video, I think rather than describing the NFT marketplace as “maturing”, I would have perhaps likened it to a “virtual flea market.”
Markets can get out of hand. Should it come as a surprise that gov’t stimulus checks coupled with the Fed’s confetti money printing, while sports and other public activities were suspended, led to some awfully stupid market decisions?
In the late 1980s it was said that Tokyo’s Imperial Palace was worth more than California, and that Tokyo real estate “could sell for as much as $139,000 per sq foot, nearly 350 times as much as equivalent space in Manhattan.” A golf club membership could cost $3 million. (Take THAT, Harker!)
With dollar/yen breaking out and closing this week above the high of 2015, the next big trade of the year just might be shorting the yen, as the Fed’s inflation-fighting removal of accommodation strengthens USD. At the start of 1985, just prior to the Plaza accord, JPY was 250. Now it’s 126.46.
In the US rates market, the big story was the large rebound in the curve. On the week, the two-yr note yield fell 8.7 bps to 2.435% while 30s rose 15.1 bps to 2.903% for a difference of 46.8 bps. On April 1, this spread had inverted to -3 bps. On March 16, the last FOMC meeting, the spread was 51. In the space of one month this spread fell over 50 bps and then rebounded to end near its starting level. On March 10, yoy CPI was released at 7.9% and last week on April 12, it had accelerated to 8.5%. The steepening bounce likely has more to do with Brainard’s signaling of more rapid balance sheet reduction than with inflation, though a thirty-yr yield of 2.9% is hardly justifiable with >8% CPI. In fact, a friend (thanks Tots) pointed out that i-bonds on TreasuryDirect, priced off CPI-U, are paying juicy rates: “If an i-bond is purchased in April, you’ll get the current rate of 7.12% for six months followed by 8.62% for six months. That’s a 12-month avg rate of 8.37%.”
Some will point to the curve move and conclude that the brief inversion of treasuries is nothing more than a false signal of a possible recession. However, on the Eurodollar strip, the red pack (2nd year forward) is 23 bps higher in yield than the green pack (3rd year) and therefore solidly inverted. Using the SOFR strip, the average price of the first four contracts, SFRM2, U2, Z2 and H3, is 9778 or 2.22%. However, the next four contracts SFRM3, U3, Z3, H4, average to a price of 9704 or 2.96%. That’s above the yield on just about everything on the treasury curve aside from the 20-yr, which was 3.08% late Thursday. In other words, if the Fed carries through with pricing implied by forward ED and SOFR strips, inversion will once again clearly forecast a recession.
Additionally, supply problems keep popping up, for example this crucial tidbit concerning rail shipments of fertilizer to farmers: (from CF Industries site)
On Friday, April 8, 2022, Union Pacific informed CF Industries without advance notice that it was mandating certain shippers to reduce the volume of private cars on its railroad effective immediately. The Company was told to reduce its shipments by nearly 20%. CF Industries believes it will still be able to fulfill delivery of product already contracted for rail shipment to Union Pacific destinations, albeit with likely delays. However, because Union Pacific has told the Company that noncompliance will result in the embargo of its facilities by the railroad, CF Industries may not have available shipping capacity to take new rail orders involving Union Pacific rail lines to meet late season demand for fertilizer.
Tony Will, CEO of CF Industries Holdings added, “By placing this arbitrary restriction on just a handful of shippers, UP is jeopardizing farmers’ harvests and increasing the cost of food for consumers.” The BBG Commodity Index closed at the high of the year Thursday and is up 33% ytd.
A lot of Fed speakers this week, with Beige Book on Wednesday. Bullard late Monday, Evans on Tuesday and Wednesday, Daly Wednesday. On Friday, Powell and Lagarde take part in an IMF panel on the Global Economy.
OTHER MARKET THOUGHTS/ TRADES
In the month of April, FFN3/FFF4 calendar spread has been priced from 1 to 5. In other words, these two contracts, which are a proxy for policy over the last half of 2023, trade at nearly the same price. Friday’s settles 9697.5 and 9695.0 or just slightly above 3%. The takeaway is that the market expects a terminal FF target around 3%, and hiking will have ended by the first half of next year.
Note that rate markets, typically highly liquid, have lost quite a bit of depth in the past few weeks. Moves can easily be exaggerated. Vols remain quite high.
There will be no weekly comment next week.
| 4/8/2022 | 4/14/2022 | chg | ||
| UST 2Y | 252.2 | 243.5 | -8.7 | |
| UST 5Y | 276.4 | 275.6 | -0.8 | |
| UST 10Y | 272.7 | 280.4 | 7.7 | |
| UST 30Y | 275.2 | 290.3 | 15.1 | |
| GERM 2Y | 5.0 | 4.7 | -0.3 | |
| GERM 10Y | 70.7 | 84.2 | 13.5 | |
| JPN 30Y | 97.2 | 92.9 | -4.3 | |
| CHINA 10Y | 275.9 | 276.1 | 0.2 | |
| EURO$ M2/M3 | 179.0 | 164.5 | -14.5 | |
| EURO$ M3/M4 | -32.0 | -28.0 | 4.0 | |
| EURO$ M4/M5 | -24.5 | -11.0 | 13.5 | |
| EUR | 108.76 | 108.31 | -0.45 | |
| CRUDE (active) | 97.73 | 106.38 | 8.65 | |
| SPX | 4488.28 | 4392.59 | -95.69 | -2.1% |
| VIX | 21.16 | 22.69 | 1.53 | |
https://www.depositaccounts.com/blog/inflation-treasury-series-i-savings-bonds/
Bullard or BlackRock?
April 14, 2022
–Large block buying of 2y note futures (~80k in total) helped the cash yield fall another 4.9 bps to 2.336%. Red eurodollars were strongest on the strip closing +5.25 (greens +3.875, blues +3.0 and golds +3.25). Open interest in TU was +21k, while it was down 25k in FV and TY. Perhaps unsurprisingly there’s an article on BBG this morning citing BlackRock as saying the market is wrong in pricing aggressive rate hikes and that the Fed will stop at around 2%. On Tuesday, FFF’23 (which forecasts the year-end FF target) settled 9745.5 or 2.545%. Yesterday the contract surged 12 bps to 9757.5 or 2.425%. The 2/10 spread which printed -5.5 on April 1 has rebounded to 35 bps, about 13 bps higher than it was on March 16, the FOMC meeting. Here’s an amazing round turn: on March 16 EDM3/EDM6 settled -39.0. The low settle was -93.5 on April 1, but it traded around -100. Yesterday it settled -39, exactly where it was on the last FOMC. Does this extraordinary bounce in the curve reflect a false signal in terms of the possibility of recession? Not hardly. The Fed’s new emphasis on balance sheet reduction suggests that the Fed would like to see a steeper curve, if not to dissuade recession cassandras, then to help the treasury auction new bonds with the carrot of positive carry.
–Apart from the TU block buys there was also heavy selling of FV puts, with 20k FVM 113.25p sold 25.5 to 25 (25s vs 113-28) and 20k FVM 112.5 sold 19 to 13 (17s). The former saw open interest rise 15.6k while the latter appears to be an exit with OI down 13.6k.
–ECB this morning on the heels of 50 bp rate hikes by Canada and New Zealand yesterday, and South Korea this morning. C’mon Lagarde, everyone’s doin’ it. Today also brings Retail Sales expected +0.6%. U of Mich Consumer Sentiment is released, important as it is near the lows of the GFC.
Wide range of possibilities
April 13, 2022
–Lower than expected core inflation of 6.5% sparked talk of ‘peak inflation’ which translated into a plunge of shorter maturity yields. The two year note fell nearly 12 bps to 2.385%, 5s down 11.2 to 2.671%, 10s down 5.5 to 2.721%. At the start of April, the 2/30 treasury spread went slightly inverted. Yesterday it hit a new recent high of 44.3 as the 30 bond yield actually rose 1 bp to 2.828%. On the euro$ strip the reds surged 19 bps while golds were only up 7. The red/gold pack spread bottomed April 1 below -87 bps and yesterday settled -28. January 2024 FF were up 19.5 bps to 9701.5, or just under a rate of 3%, essentially trimming one 25 bp hike. The thought is that if official inflation stats start to decline, then the Fed will not be forced into adopting the hawkish path outlined by Bullard et al.
–Here’s a quote attributed to GS, “today’s CPI release is a reminder that there still exists a non-zero probability that all of the inflation we have seen the past year is indeed transitory – the product of pandemic balances that constrained supply chains, kept people out of the workforce, and fed an unusual consumer demand for stuff.” Thanks for the insight. There’s also a non-zero probability that inflation will stay well above the Fed’s target even if the economy slows dramatically, which appears will occur. In any case, we get PPI today, expected 10.6%, along with a 30 yr bond auction. This morning we’ll also get JPM’s earnings call. Again, it’s not a big data-point, but NFIB small business optimism fell yesterday to 93.2. The post-pandemic high was around 104; it’s now approaching the pandemic low.
–Premium fell pretty hard on the rally with TYM2 120.5^ at 2’26 or 7.8 from 8.3 on Monday. Interesting trade in eurodollars was a sale of 500 long green 9700 straddle strip at 656. Long greens are EDM4, U4, Z4 and H5, and the options expire at the same time as the futures. The atm strip on monday had settled over 690. Yesterday, the 9700 straddle strip settled 671.25 as there were two new block call buyers after the strip had traded. Late in the day a buyer of EDH4 9750c for 56.0 in size 17.5k and EDM4 9750c for 61.0, 15.4k. Settlements were 50.75 vs 9698.0 and 58.5 vs 9705.0. These positions are new open interest. Long greens were never particularly liquid, but these prints vs settlements are indicative of a high degree of looseness. The straddle strip seller was marked ~3.5 bps against on each straddle, and the call buyer had the same experience, the other way. In fact, as I have mentioned, bid/ask quantities along the eurodollar (and SOFR) strip are declining. US interest rate contracts are among the deepest and most liquid in the world. If there’s a decline in liquidity here, it’s probably a warning across markets and in a broader sense, the rate markets are the basis for all valuations.
Weak stocks, steeper curve, low liquidity
April 12, 2022
–Massive steepener again on Monday as the curve adjusts to the idea of balance sheet reduction beginning in May. On the euro$ strip, the red pack (2nd year forward) closed UP 4.375 bps and golds, 5th year settled DOWN 11.875. These moves are spectacular. On the treasury curve, 2’s yield fell 1.8 bps to 2.504% and tens rose 6.5 to 2.776% with an auction this afternoon (re-open tens). The high point on the treasury curve, the 20yr, was sporting a yield just over 3% yesterday. AMZN $12.75 billion bond offering (with a callable 40y) was a factor as well. SPX fell 1.7% and Nasdaq Comp 2.2%, going into Thursday’s option expiration.
–Liquidity is faltering, perhaps accentuated by the holiday week. At noon Chicago time on the eurodollar strip, there was not one contract bid or offer greater than 1000 contracts. At the same time on the SOFR strip just two contracts had a bid or offer greater than 1k, SFRM2 and SFRZ2, and those were less than 1500.
–Today brings CPI, expected 8.4% from 7.9% with Core 6.6 vs 6.4. The White House already warned of an extraordinarily large number. NFIB small business optimism is also released, expected somewhat below the last reading of 95.7. While not a particularly important number, the fact that many confidence measures have turned down (and that BofA is forecasting a “recession shock”) makes it noteworthy. Also today, Brainard speaks again and will take questions (12:10). Chicago’s Evans helpfully guided that a rate hike of 50 might occur in May, (after it has been priced for weeks).
–EDU3 was the strongest contract yesterday, settling +6 at 9659 while EDM3 was only up 3.5 at 9657.5. Therefore the calendar EDM3/EDU3 was -1.5. On the SOFR strip, the net changes were the same, +3.5 and +6.0, but the calendar is +0.5 (9685.5 and 9685.0). The end of June ’23 is when libor ends and euro$ contracts will transition into SOFR contracts. Perhaps the higher SRFM3/EDM3 spread relative to September is the last hurrah indicating the credit aspect of euro$s. Of course, JNK and HYG (hi-yld etfs) both made significant new lows yesterday, so it’s not hard to find clues that credit problems are popping up (which might also be a topic in bank earnings reports. JPM and BlackRock Wednesday. Citi, Wells, GS and MS on Thursday).
Something going wrong around here
April 10, 2022 – Weekly comment
‘Cause if my eyes don’t deceive me
There’s something going wrong around here
-Joe Jackson
Fed officials, especially Powell, used to loosely equate “inflation” with higher wages when the goal was to get to 2%. On August 27, 2020, the Fed adopted FAIT, Flexible Average Inflation Targeting. Just twenty months ago. Here’s an excerpt of Powell’s speech:
The persistent undershoot of inflation from our 2 percent longer-run objective is a cause for concern. Many find it counterintuitive that the Fed would want to push up inflation. After all, low and stable inflation is essential for a well-functioning economy. And we are certainly mindful that higher prices for essential items, such as food, gasoline, and shelter, add to the burdens faced by many families, especially those struggling with lost jobs and incomes.
The inflation on essential items for less well-off households was a topic of Brainard’s speech last week. After years of creating financial asset inflation which increased economic inequality, the Fed is now in a full fledged-fight against inflation, and by unstated implication, against asset values. Here’s the key comment by Brainard:
…the Committee will continue tightening monetary policy methodically through a series of interest rate increases and by starting to reduce the balance sheet at a rapid pace as soon as our May meeting.
It’s worth mention that many other central banks are also raising base rates: Romania on April 5, from 2.5 to 3%. Poland on April 6, from 3.5 to 4%. Pakistan on April 7, 250 bps from 9.75 to 12.25% as inflation and political instability weigh on the rupee. (Pakistan’s leader Imran Khan was ousted this weekend). High inflation is a source of societal instability.
Below is a chart of the Fed’s balance sheet and SPX. You can see that the initial balance sheet reduction of 2018 went fairly smoothly. In continuation of a hiking cycle that essentially started in December of 2016, the Fed hiked rates four times in 2018, by 25 bps each time: March 22, June 14, Sept 27 and Dec 20, culminating with a target of 2.25 to 2.5%. Q4 of 2018 was a tough one for markets and liquidity, prompting Mnuchin to call an emergency meeting on Dec 23 of the heads of major banks, and forcing the Fed into an abrupt shift of policy.
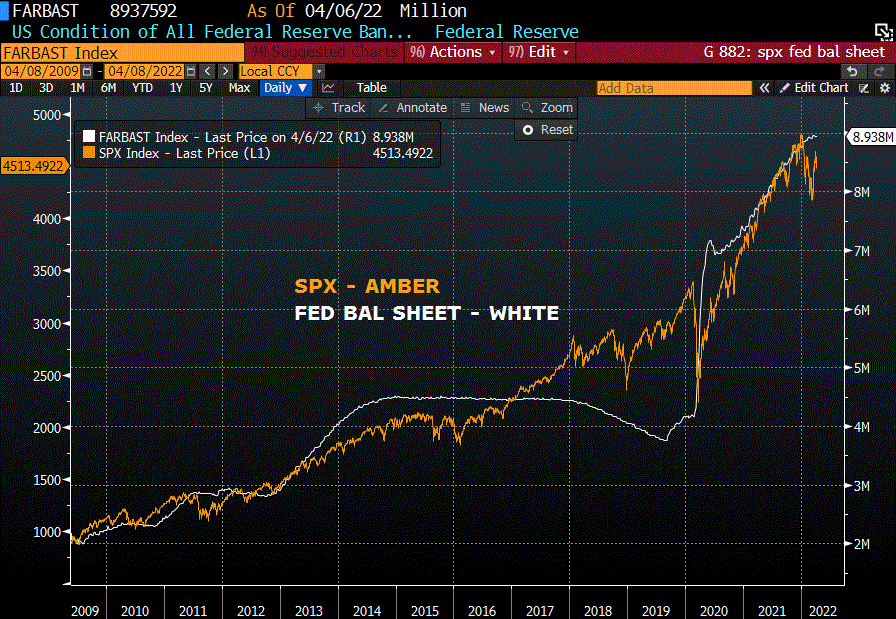
The great repo scare of September 17, 2019 also occurred while the Fed was trimming the balance sheet. Probably just a coincidence (right?) but after that event the balance sheet started to grow again.
They say, don’t fight the Fed, and indeed, Brainard’s speech last week coincided with a jump in the ten year yield of nearly 35 bps, as the balance sheet comments caused an immediate re-evaluation of curve flattening trades. On Friday 1-April, 2/30 had gone slightly inverted; by Friday 2s ended just over 2.52% and 30s at 2.75%, a swing of over ¼% in a week. With QT, the Fed’s goal was to push investors into riskier assets, i.e. stocks. Now the Fed is telling you it is engaging in QT. Your eyes are NOT deceiving you. The Fed has shifted its focus to benefit savers rather than borrowers and is, by extension, discouraging capital flows into riskier assets. The saying I always keep in the forefront of my mind is this: When a bullish news item or event occurs, and the market does NOT GO UP, that’s bearish. I’m not sure this is a good analogy, but Miami just hosted a huge bitcoin conference. Peter Thiel and others received all sorts of press for the bitcoin hype and “the man is keeping me down” rhetoric [but Peter, you ARE the man]. Here’s a headline from Sunday’s WSJ: ‘Crypto Boosters Toast Bitcoin, Jeer Wall Street over Cigars in Miami’. Bitcoin did not go up. THAT’S bearish. BTC was 46k Sunday April 3 and is 42.5k as of Sunday morning April 10.
One other point. Growth in M2 exploded during COVID. It has now decelerated massively. Velocity of course, declined with the huge injection of Fed largesse. Now velocity is going to increase. There’s NO WAY we could have seen that coming, right? In the week prior to the March FOMC, the 10y inflation-indexed note yield hit MINUS 107 bps. On Friday it ended at -19, a move of 88 bps in a month. Real rates are going up.
This should be an interesting (holiday shortened) week. On Tuesday and Wednesday we get inflation data with yoy CPI expected 8.4% and yoy PPI 10.6%. Thursday we have Retail Sales (+0.6% month/month) and Michigan Sentiment which has collapsed to test GFC lows! Auctions of $46b in 3s on Monday, $34b 10s on Tuesday and $20b 30s Wednesday will raise $35b in new cash. Supply and inflation. How will the curve handle it?
I’ll note a couple of clues from the ED curve. Last week EDM2/EDM3 was up 4.5 bps to 179, but EDM4/EDM5 jumped 12 from -38.5 to -24.5. The front-loaded rate hikes are still being priced, but the new dynamic is a steeper back end due to uncertainty about balance sheet reduction. This feature is also apparent in the level of US vol, at its highest since the onset of covid. EDM3 has been the lowest point on the ED curve and settled at a new low 9654 on Friday. However, EDU3 actually settled slightly lower at 9653, a subtle shift further back. My guess is that the market will trade heavy in the early part of the week, but rally out of the completion of the re-opened 30y auction, and I believe the curve will be slightly steeper at the end of next week.
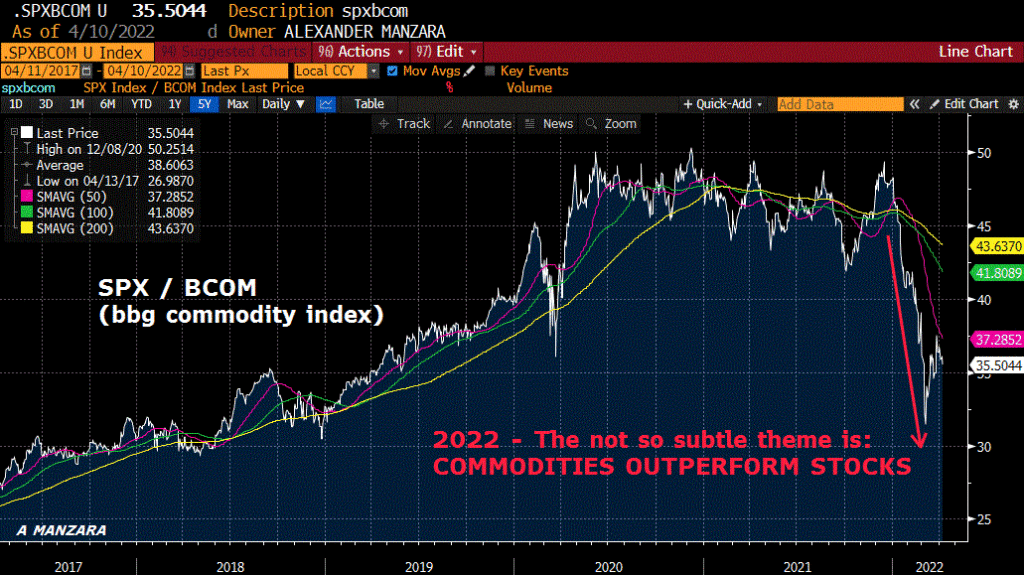
One more bonus chart:
OTHER MARKET THOUGHTS
Since 2000, peak one-year spreads occurred at the end of 2001, start of 2002, as the Fed was easing with the pop of the dotcom bubble and 9/11. Highs in ED calendars at that time: 1st to 5th 252.5, 2nd to 6th 263.5, 3rd to 7th 264, 4th to 8th 243. These spreads made the historic highs with EASING, not tightening. The most recent highs were in 2009 associated with the GFC: 1st to 5th 166, 2nd to 6th 179, 3rd to 7th 173, 4th to 8th 163. The high for any one-year calendar this cycle was put in last week at 181, and it was EDM2/EDM3 or 1st to 5th. That level is higher than anything seen in 2009 and is based on tightening rather than easing. Quite a stark change.
| 4/1/2022 | 4/8/2022 | chg | ||
| UST 2Y | 242.8 | 252.2 | 9.4 | |
| UST 5Y | 254.5 | 276.4 | 21.9 | |
| UST 10Y | 237.3 | 272.1 | 34.8 | WI 272.7 |
| UST 30Y | 242.1 | 275.0 | 32.9 | WI 275.2 |
| GERM 2Y | -6.8 | 5.0 | 11.8 | |
| GERM 10Y | 55.5 | 70.7 | 15.2 | |
| JPN 30Y | 94.8 | 97.2 | 2.4 | |
| CHINA 10Y | 277.7 | 275.9 | -1.8 | |
| EURO$ M2/M3 | 174.5 | 179.0 | 4.5 | |
| EURO$ M3/M4 | -30.5 | -32.0 | -1.5 | |
| EURO$ M4/M5 | -36.5 | -24.5 | 12.0 | |
| EUR | 110.46 | 108.76 | -1.70 | |
| CRUDE (active) | 99.27 | 98.26 | -1.01 | |
| SPX | 4545.86 | 4488.28 | -57.58 | -1.3% |
| VIX | 19.63 | 21.16 | 1.53 | |
https://www.federalreserve.gov/newsevents/speech/powell20200827a.htm
Short end absorbs hawkish Bullard comments/ long end not so much
April 8, 2022
–Bullard: “I would like the committee to get to 3-3,25% in the second half of this year.” Getting to 3-3.25 would be consistent with a eurodollar contract price of around 9663.0. Indeed, EDM3 settled at 9664.5 (+6 on the day) or 3.355%, and that contract is still the lowest price/highest yield on the euro$ curve. The next five FOMC meetings are May 4, June 15, July 27, Sept 21 and Nov 2. Current FF target is 0.25 to 0.50. So 3.00 to 3.25 would require 275 bps of additional tightening. Let’s assume 50 bps at every meeting through November. FF target would be 2.75 to 3.0%. That would take EDU2 through the 9700 strike and indeed there was a buyer of 50k EDU2 9700/9675ps for 2.75 (settled 2.75 vs 9766.5). VERY bold projection.
–Yesterday featured a continued bounce in the curve with the 2yr down 3.6 bps and 30s up 5.5 to 2.462% and 2.685% respectively. Philip Grant of ADG notes that this spread of 22 bps occurred just two days after the yields had inverted. While the short end of the market easily absorbed Bullard’s hawkish comments, the long end is struggling with implications of balance sheet reduction. Indeed, steepening was dramatically pronounced on the euro$ curve, with reds settling up 6.25 bps, while golds closed DOWN 6.875. Just looking at EDM’23 to EDM’26 spread: on March 25 it was -51, April 1, -96.5 and yesterday -63.5. Even with hawkish Fed comments front-end straddles were sold and fell by 3 to 4 bps, but what is interesting to note is that US (bond) vol closed at 13.9, a new high while FV was lower (chart). I.e. curve uncertainty is clearly shifting to the long end.
–Monster consumer credit number yesterday (Feb) of $41 billion with revolving up $18 billion, an annualized rate of 20.7! An interesting addendum on the Fed’s website that we can loosely file under the ‘extend and pretend’ column: “…the release will no longer report the Commercial Bank Interest Rates for 48-month New Car Loans. Instead, the release will report the Commercial Bank Interest Rates for 72-month New Car Loans.”
Is this a good report because it reflects confidence? Or a very worrying report that indicates stretched consumer behavior? Or simply wrong data? The consumer confidence numbers have been declining…
–CPI on Tuesday expected 8.4%. Earnings season also upon us. Easter holiday is one week from Sunday and Friday markets are closed. Worth noting perhaps, is that Orthodox Easter is the following Sunday on the 24th which may or may not impact military activity in Ukraine.

Get ready for QT
April 7, 2022
–Curve continues a modest bounce with the two-yr yield unchanged at 2.50% and tens up 5.6 to 2.605% as the Fed readies a plan to trim the balance sheet by $95 billion per month. Stocks retreated yesterday but stabilized after the minutes. A 50 bp hike in May is now a foregone conclusion. July’22 Fed fund contract settled 9869.0 or 131 bps with Fed Effective at 33 bps, indicating 50 in May and 50 in June.
–Implied vol eased slightly in near contracts but rose in bonds; the market may not quite be ready for the implications of QT. Bullard, Bostic, Evans and Williams all scheduled for comments today. CPI is released next week on Tuesday and is expected to print 8.4%, followed by PPI the next day. Oil fell 5.73 yesterday with CLK2 settling 96.23; small bounce this morning.
–The problems with urban real estate continue with the owners of Chicago’s iconic Water Tower Place apparently handing the keys back to the lenders and walking away. The Chicago Tribune notes “The Michigan Avenue crisis is getting worse.” The crown jewel of Chicago’s tourist experience is crumbling.
Putting out fire…with gasoline
April 6, 2022
–Key line from Brainard speech:
…the Committee will continue tightening monetary policy methodically through a series of interest rate increases and by starting to reduce the balance sheet at a rapid pace as soon as our May meeting. Given that the recovery has been considerably stronger and faster than in the previous cycle,
–Yields exploded to new highs, with tens up 14 bps to 2.548%. New highs in near euro$ calendars. EDM2/EDU2 three month spread rose 3.5 to 74. EDM2/EDM3, the peak one-year calendar, and of course, the nearest, surged 8 to 181, the highest for any one-year spread in this cycle. (Usually, one-year spreads only reach this level on aggressive EASING from higher rates). The curve steepened with 2/10 back in positive territory to 5 bps, up 6.5 on the day. On the euro$ curve, reds (2nd year) fell 10.25 bps, but golds (5th yr) plunged 22.25 as balance sheet reduction is expected to steepen the curve. Daly also said balance sheet reduction could start in May; today’s FOMC minutes have been preempted.
–Gasoline cost too much? We’ll sell from the SPR. Don’t want to pay the student loans? We’ll extend the moratorium on payments until August. The Federal gov’t tries to protect the voting base from all pain. However, Brainard yesterday noted that low income households pay around 45% of their income towards housing, while high income HHs spend about 18%. The thirty-year mortgage rate just hit 5%, compared to about 3% at the start of the year, taking monthly mortgage payments up 27%. What should the Fed’l gov’t do about that? Housing activity already slowing, and the percentage growth of M2 has slowed dramatically.
–The low contract on the ED curve is still EDM3 at 9658 or 3.42%. Note these high yield levels in treasuries from 2018: 5yr 3.08%, 10yr 3.23%, 30yr 3.455%. Currently, EDM3 is closing in on the 30yr high from 2018! But not only that, there are buyers of protection in case the Fed moves its timetable even more rapidly: for example, there was a new buyer of 15k EDU2 9650p for 5.0. EDU2 settled 9765.0!! Massive premium. Also, the long dated ED straddles are at nosebleed levels. Example, EDH4 9675^ vs 9681 settled 157.25 and EDH5 9712.5^ vs 9711.5 settled 182. I haven’t double checked, but these might be the highest nominal levels I have seen.
Brainard
April 5, 2022
–Light volume Monday featured a slightly steeper curve with the ten year yield up 3.5 bps to 2.408% and twos down half a bp to 2.424% (still inverted). EDM3, the ED contract with the highest yield, made an overnight low of 9858.5, but closed unchanged at 9868.5, suggesting that selling pressure is abating. FFF3 settled 9753.5, indicating 200 to 225 bps of additional tightening this year.
–This week features a lot of Fed speakers (and FOMC minutes tomorrow) but perhaps Brainard’s comments today will be the highlight. I was looking for a previous speech of hers where she suggested the neutral rate was rising as the Fed was hiking, and found it in a May 31, 2018 piece titled ‘Sustaining Full Employment and Inflation around Target.’ I was struck at the time by the idea of a moving target on the neutral rate, seemingly bolstering the case for the Fed’s tightening regime at that time. She also noted the low term premium in the long end, a condition that is currently in place but may (as she predicted in 2018) expand. In any case, here’s an interesting excerpt on the yield curve:
“Since 1960, there has only been one case where the 3-month Treasury yield has moved above the 10-year Treasury yield and a recession has not followed–in 1966.9
This correlation between yield curve inversions and recessions might arise for a variety of reasons. First, let us take a case where short-term rates rise relative to long-term rates. When the FOMC is undertaking a deliberate tightening in policy, short-term interest rates typically rise, as do expectations of short-term interest rates in the medium term, while interest rates in the distant future may be less affected. For example, if short-term interest rates were raised to stabilize temporary swings in the economy, the logic of the expectations hypothesis would suggest that long rates would not rise as much. And if tighter monetary policy were to weaken the economy with a lag, this would lead to long rates not rising by as much or at all.
–Brainard doesn’t allow much room for debate as to the signal of an inverted curve. However, there has been a tendency of Fed officials to fit the economic narrative to the policy prescription. Should be an interesting speech, which I think might contain a slight pushback to current market pricing of aggressive near-term hikes. Title of today’s speech:
Variation in the Inflation Experience of U.S. Households
https://www.federalreserve.gov/newsevents/speech/brainard20180531a.htm

