
Innovation blues
April 4, 2020
–A solid employment report contributed to a fierce sell off in near contracts. NFP rose 431k with an unemp rate of 3.6%. At the futures settlement, I marked 2s up 14.4 bps to 2.428% and 5s up 12.7 to 2.545%. New lows in most measures of the curve with inversions in 2/30 at -1 bp, 2/10 at -5.5 and 5/30 at -12.4. Eurodollar curve is imploding with the red/green pack spread (2nd yr to 3rd year) at -34.5. EDM3 settled 9668.5 (low point on the curve) and was trading 9663.5 late in the day. This morning it printed 9658.5 or 3.415%. I don’t think any treasury traded above this yield level in 2018 (recent peaks).
–Over the weekend Williams (NY Fed) said balance sheet reduction could begin as soon as May, and Daly (SF Fed) said that the case for 50 min May has grown. Given pricing, NOT going 50 would be a shock. Fed minutes on Wednesday.
–Cathie Wood tweeted that the Fed raising rates in this environment would be a mistake. Her ARKK fund was around 125 in November and is now 67. Companies with high hopes of becoming market leaders by borrowing to buy market share are getting crushed on the prospect of higher rates. You can call it innovation, but without a steady stream of capital, the value of innovation crumbles. Tiger Global reported a loss of 34% for the quarter. Softbank CDS have been on a 45 degree angle higher (though have pulled back somewhat as leverage issues are addressed). And then there’s Russia, with Jamie Dimon saying the associated loss could be $1 billion for JPM. We’re a little over a week away from earnings reports for banks to start being released.
Slaves of some defunct economist
April 2, 2022 – Weekly comment
Challenge of Central Banking in a Democratic Society- Dec 1996 – Irrational Exuberance speech
…The stagflation of the 1970s required a thorough conceptual overhaul of economic thinking and policymaking. Monetarism, and new insights into the effects of anticipatory expectations on economic activity and price setting, competed strongly against the traditional Keynesianism. Gradually the power of state intervention to achieve particular economic outcomes came to be seen as much more limited. A consensus gradually emerged in the late 1970s that inflation destroyed jobs, or at least could not create them.
But where do we draw the line on what prices matter? Certainly prices of goods and services now being produced–our basic measure of inflation–matter. But what about futures prices or more importantly prices of claims on future goods and services, like equities, real estate, or other earning assets? Are stability of these prices essential to the stability of the economy?
…how do we know when irrational exuberance has unduly escalated asset values, which then become subject to unexpected and prolonged contractions
Jackson Hole Speech – August 1999
History tells us that sharp reversals in confidence happen abruptly, most often with little advance notice. These reversals can be self-reinforcing processes that can compress sizable adjustments into a very short time period. Panic market reactions are characterized by dramatic shifts in behavior to minimize short-term losses. Claims on far-distant future values are discounted to insignificance. What is so intriguing is that this type of behavior has characterized human interaction with little appreciable difference over the generations. Whether Dutch tulip bulbs or Russian equities, the market price patterns remain much the same.
Collapsing confidence is generally described as a bursting bubble, an event incontrovertibly evident only in retrospect. To anticipate a bubble about to burst requires the forecast of a plunge in the prices of assets previously set by the judgments of millions of investors, many of whom are highly knowledgeable about the prospects for the specific companies that make up our broad stock price indexes.
As we make progress, hopefully, toward understanding asset-pricing mechanisms, we need also to upgrade our insights into the effect of changing asset values on GDP–the so-called wealth effect.
In conclusion, the issues that I have touched on this morning are of increasing importance for monetary policy. We no longer have the luxury to look primarily to the flow of goods and services, as conventionally estimated, when evaluating the macroeconomic environment in which monetary policy must function. There are important–but extremely difficult–questions surrounding the behavior of asset prices and the implications of this behavior for the decisions of households and businesses. Accordingly, we have little choice but to confront the challenges posed by these questions if we are to understand better the effect of changes in balance sheets on the economy and, hence, indirectly, on monetary policy.
Alan Greenspan’s speeches were thought-provoking. He was Fed Chair from August 1987 until January 2006. He was clearly intrigued by the interplay of asset prices, confidence, trust, and their effect on the performance of the economy. During his tenure the Fed navigated the 1987 stock crash, the Russian devaluation, the SE Asia crisis, the dotcom bubble, 9/11, and several rate hike cycles.
In the top line of this note Greenspan says “the power of state intervention to achieve particular economic outcomes came to be seen as much more limited.” The next sentence implicitly links excessive gov’t spending with inflation which leads to job destruction. We’ve now swung the pendulum to the opposite end of the spectrum with MMT, but clearly the first outcome of state intervention has occurred, i.e. inflation, even though the lagging indicator of unemployment has just notched a near record low of 3.6%. (Of course, intervention due to covid was essential, but the extraordinary stimulus of the Fed’l Gov’t and Fed sparked inflation).
There are now many comparisons being made with the 1994 hiking cycle. Throughout 1993 Fed Funds were 3%. 1994 started with a 2y note yield of just over 4%, and CPI at 2.5 to 2.6%. I.e. real rates were positive. In Jan 1995, FF peaked at 6%, a total increase of 300 bps; a double. At the end of 1994, the 2y yield topped at just under 7.75%, not quite a double, a move of 375 bps. Over this period CPI peaked in Sept’94 at 3%, fell back a bit, and then ultimately rose to 3.2% by Q2 1995 before ending that year at 2.6%.
This is NOT 1994. FF started this year at 0-0.25%. The 2y started at 75 bps, and CPI began 2022 at 7%. In 1994 Fed’l Debt to GDP was just under 68%, now it’s over 120%. In 1994 the ‘Buffet Indicator’ of market cap to GDP was also around 68%, now it’s 202%. The 2yr yield was 58 bps at the end of November. In four months it has surged to 244 bps, a change of 186 bps, about half the 1994 move in a third of the time. Of course in percentage terms the move is much more dramatic. The rapid adjustment in short end rates is nothing less than a shock to the economic system.
Let’s return to Greenspan’s concern with the wealth effect. With total Net Worth reported to be a record $150 trillion as of the end of 2021, and market cap to GDP also near a record 200%, and the Shiller p/e ratio currently at 37 (vs long-term mean of 17 and an all time peak of 44 in 1999’s dotcom mania), could a crack in confidence cause a rapid re-pricing of financial assets?
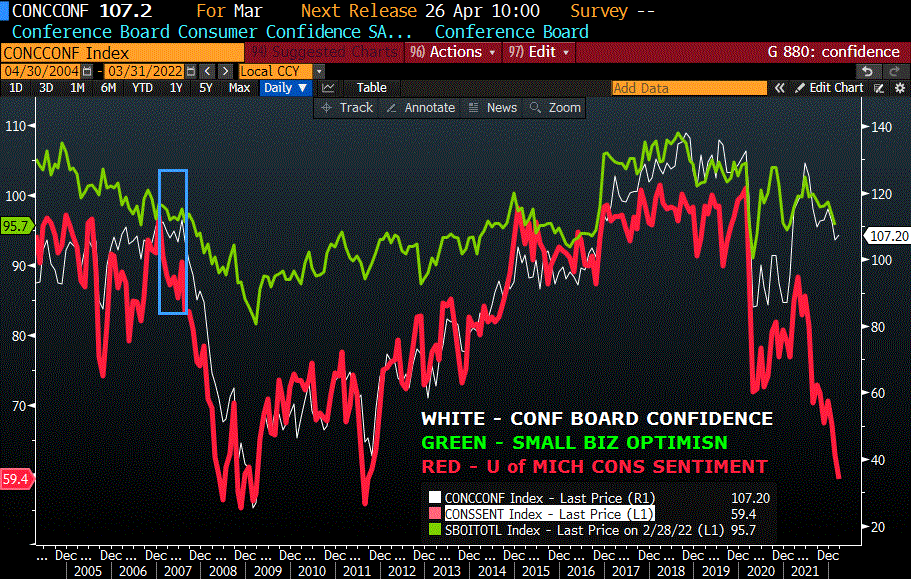
How can we tell if confidence is starting to fray? Consumer confidence surveys. Presidential approval ratings. Spreads on riskier securities. Borrowings. The chart below shows University of Mich Consumer Sentiment (red), the Conference Board’s Confidence measure (white) and the NFIBs Small Business Optimism (green). All have turned down. UofM is close to the GFC low, and it appears from the experience in 2007 that UofM leads the others.
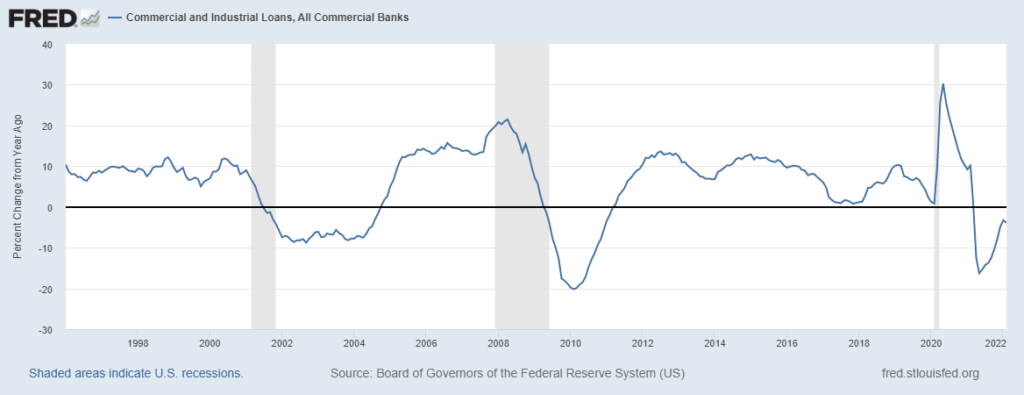
I have also included a chart of the yoy percent change in Commercial and Industrial Loans, last at -3.9% (Feb). Obviously there was a surge in 2020 as companies drew down credit lines. It’s only natural that these emergency loans are paid back or forgiven. But it’s still a net reversal of economic liquidity at the same time as a shift in the Fed’s stance. In a speech yesterday, NY Fed’s Williams said a reduction in the Fed’s balance sheet could begin as soon as the next FOMC in May. I suspect the withdrawal of liquidity will negatively impact confidence in the system.
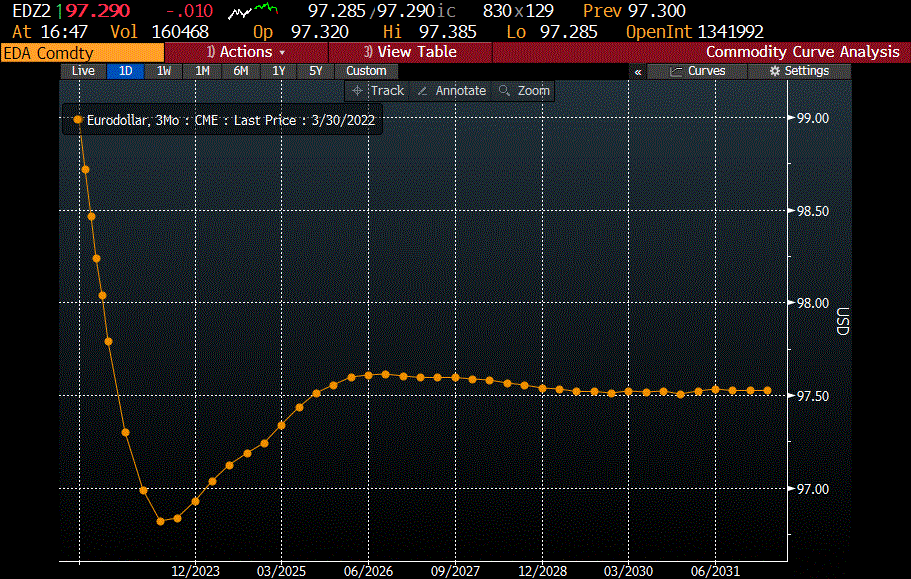
In my opinion, there is one more measure of confidence that impacts asset values: the yield curve. This week the most popular measure, 2/10 spread, flipped from positive 19.3 to negative 5.5 (partially impacted by new 2yr). Even the 2y to 30y ended the week slightly inverted. And of course, the red Eurodollar pack (2nd year forward) to greens, blues and golds (3rd, 4th and 5th years forward) hit historic new lows. The reds ended with a yield of approx. 3.24%, greens at 2.89%, blues 2.52% and golds 2.36%.
What does this mean? It’s clear why the reds have plummeted in price to new high yields, the Fed is expected to aggressively raise short term rates. Why are yields on more deferred years lower? Because the market doesn’t think the economy can withstand the shock of higher funding costs. Funding costs will overwhelm returns on longer dated assets. It is a measure of forward confidence. That’s why the curve is a recession indicator. I don’t know why the press continues to quote people that say it’s debatable as to whether an inverted curve signals recession. It does. I’m not saying that market pricing can’t change, and with it, the signal. For example, the Ukraine conflict could end, China’s property slump could magically abate, and the supply chain could revert to smooth functioning.
The capitalistic monetary system borrows short and lends long. That’s the financial transformation through which savers fund enterprises leading to increases in standards of living. Emergency government injections of funds saved a lot of jobs and businesses, but subsequently led to a lot of bad decisions based on hope. The reaction is here. If funds can’t be borrowed profitably, growth declines.
OTHER MARKET THOUGHTS/ TRADES
EDM’22/EDM’23 calendar settled at a new high for any one-yr during this cycle at 174.5 bps. Peak rates on the curve are EDM’23 at 9668.5 or 3.315%. SFRM3 at 9694.5 or 3.055%. FFU3 at 9689.5 or 3.105%. Therefore, highs for the rate cycle continue to project the middle of next year at a bit over 3%. However, prices were so weak and liquidity so bad on Friday, with reds -18.5 bps, and the 5yr up 12.7 bps to 2.545% that it’s impossible to say where ultimate highs might be on a true washout.
| 3/25/2022 | 4/1/2022 | chg | ||
| UST 2Y | 233.5 | 242.8 | 9.3 | |
| UST 5Y | 257.2 | 254.5 | -2.7 | |
| UST 10Y | 249.0 | 237.3 | -11.7 | |
| UST 30Y | 260.2 | 242.1 | -18.1 | |
| GERM 2Y | -13.5 | -6.8 | 6.7 | |
| GERM 10Y | 58.7 | 55.5 | -3.2 | |
| JPN 30Y | 96.8 | 94.8 | -2.0 | |
| CHINA 10Y | 280.0 | 277.7 | -2.3 | |
| EURO$ M2/M3 | 154.5 | 174.5 | 20.0 | |
| EURO$ M3/M4 | -24.0 | -30.5 | -6.5 | |
| EURO$ M4/M5 | -18.0 | -36.5 | -18.5 | |
| EUR | 109.82 | 110.46 | 0.64 | |
| CRUDE (active) | 113.90 | 99.27 | -14.63 | |
| SPX | 4543.06 | 4545.86 | 2.80 | 0.1% |
| VIX | 20.81 | 19.63 | -1.18 | |
https://www.federalreserve.gov/boarddocs/speeches/1996/19961205.htm
https://www.federalreserve.gov/boarddocs/speeches/1999/19990827.htm
April Fools
April 1, 2022
–PCE prices came out about as expected, 6.4% yoy with Core 5.4%. Today the employment data is released, with NFP expected 490k vs 678k last. Unemployment rate expected 3.7 from 3.8 and yoy Avg Hourly Earnings expected +5.5% from 5.1% last. Since the year 1970, there has only been one year with readings at 3.7% or lower and that was in 2019, before covid. From April 2019 to Feb 2020 the rate stayed between 3.7% and the historic low of 3.5%.
–End of the day/month/qtr was a tough one in stocks. A BBG article says that “Losing 5% in stocks and bonds was the best you could do in Q1” and further notes that around $3 trillion of wealth disappeared. Is there a reverse wealth effect? We’re about to find out. As Ralph Kramden said, “It came easy and went just as fast.” It’s not just stocks, higher mortgage rates are likely to chew into real estate values. At least there’s a little relief on energy prices, as CLK2 settled -7.54 at 100.28 on the Biden admin’s ingenious plan to burn the furniture to heat the house...oops, I mean to sell oil from the SPR.
— Eurodollar curve made new lows from reds back. Picture attached. When the recession starts, refer back to this. Atlanta Fed’s new estimate puts Q1 GDP at 1.3%, but the comps are going to start getting harder.
–Planting estimates show that increased fertilizer costs are causing a shift to beans from corn. From Reuters’ Karen Braun “Chicago-traded Dec corn futures surged more than 4% on the data, reaching a contract high of $6.91 per bushel, easily a record for the date among past new-crop contracts.” I’m not a political strategist, but if I were advising the Biden admin I would suggest selling whatever corn the US gov’t has stashed away. You’re welcome.
–Implied vol continues to come out of the market. Here are some week over week comparisons:
3/24 settles on top with 3/31 below
EDM2 9843.75^ 32.75
EDM2 9850.00^ 27.5
0EM2 9700.0^ 51.5
0EM2 9687.5^ 48.0
2EM2 9737.5^ 52.0
2EM2 9712.5^ 48.0
TYM2 123^ 2’61
Now TYM 123^ 2’36…if same vol as 24th it would be 2’48
However, long dated straddles in reds and greens expanded over the week.EDM3 9700.0^ 119.5
EDM3 9687.5^ 124.0
EDM4 9737.5^ 145.0
EDM4 9712.5^ 157.0
RESOLVE
March 31, 2022
–It’s the last day of the first quarter and today the Fed’s preferred measure of inflation is released: PCE prices expected 6.4 yoy vs 6.1 last month, with Core expected 5.5 vs 5.2. At the last FOMC, just two weeks ago, the SEP projection for 2022 for PCE prices was 4.3% with Core 4.1%. If today’s price estimates are correct, it would take a serious slowdown for the Fed to be in the ballpark regarding its collective projection. Perhaps that will occur, as the Atlanta Fed’s GDP Now estimate is updated today for Q1, currently expected at just +0.9%. A noteworthy earnings call was flagged by BBG yesterday: the CEO of RH (previously Restoration Hardware) warning that sales are slowing rapidly and conditions are extremely challenging for all businesses.
–Yields fell across the board yesterday, with tens down 5.6 bps to 2.35%. 2/10 still hovering around zero, yesterday ending at 3. Red/gold euro$ pack spread (2nd to 5th year) again made a new historic low at -70.25. In the front end of the curve, EDM2/EDM3 one-year calendar made a new high at 164.5 bps, the highest of the cycle. The market’s perception of an aggressively tightening Fed that will lead to a severe slowdown is being hammered home every day by the euro$ curve. At the same time, the Biden admin is considering an oil release from the SPR, causing a sell-off in WTI , which is down over 5% this morning just below $102/bbl (CLK).
–Against this backdrop was a rather interesting speech by Esther George of the KC Fed. Here are couple of excerpts with my comments.
“Given the state of the economy, with inflation at a 40-year high and the unemployment rate near record lows, it is clear that removing accommodation is required. How much and how aggressively accommodation should be removed is far more uncertain.” [some of your colleagues appear quite certain that getting to neutral VERY quickly is required]
“Recognizing these risks is not an argument for stalling the removal of accommodation, but it does suggest a steady, deliberate approach for the path of policy could provide space to monitor developments as they unfold.
While many factors influence longer-term yields, including the growth outlook, foreign demand for Treasuries, and the quantity and maturity of Treasury debt issuance, the Fed’s asset holdings also play a role. These purchases aimed to depress long-term rates, and the roll-off of these assets is likely to put some upward pressure on those rates, possibly steepening the yield curve.”
[steady and deliberate is NOT what other officials are espousing, and NOT what the market is pricing]
“My concern about an inverted yield curve does not reflect its intensely debated value as a predictor of recession. Rather, my view is that an inverted curve has implications for financial stability with incentives for reach-for-yield behavior. An inverted yield curve also pressures traditional bank lending models that rely on net interest margins, or the spread between borrowing short and lending long.” [everything in finance depends on this, and the US economy is dependent on financial engineering. An inverted curve predicting recession is NOT hotly debated, it IS a predictor]
Finally,
“In the event high inflation persists while demand turns down, and the labor market falters, policymaker resolve could be tested.” The outlook demands “equal doses of flexibility and resolve”.
So there it is. RESOLVE. In 2018, policymaker resolve was tested by faltering stocks, and resolve dissolved. Resolve will now likely be tested by a stalling economy. US policymakers always want to cushion any negative events. Hence, the belief in the Fed put. Hence, considerations of the SPR release. Half the Ukrainian population has been displaced and the US response is to make sure that prices don’t go up for US consumers. Newsflash, interest rates are a price. The pithy line “equal doses of flexibility and resolve” means this: as soon as our policy is tested, our resolve will collapse.
A lot’s priced in
March 30, 2022
–Another day, another day of flattening. 2/10 treasury spread briefly inverted but was +5 at the end of the day, with 5/30 just under 4 bps. However, the eurodollar curve from reds back, (starting with EDM’23) slopes ever higher in price and lower in yield. EDM3 still the lowest price/highest yield on the strip at 9679.0 or 3.21%. EDM4 is 9708 or 2.92% and EDM5 is 9739.0 or 2.61%. The red/gold pack spread is -66.75.
–The average of the first 4 SOFR contract prices starting with SFRM2 is 9782.5 or 2.175%. However, starting with SFRU2 the average is 9742.75 or 2.5725% which is above every treasury yield; 10s ended yesterday at 2.405% down 6.6 on the day. The exact level of 2/10 is rather inconsequential; the curve is inverted and will become more so over time until/unless stocks crater.
–Implied vol came out of the market, weighed by heavy call selling in FV and TY shortly after the pit opening. Here are three example of calls sold, each with an increase of open interest of 25k (new position sales): TYK2 122.5c from 30 to 35/64, settled 54. TYM2 124c also sold in the 30’s, settled 43 vs 122.10+. And FVM 114.75c sold initially at 37.5 to 38, settled 47.5 vs 114-12.25. Price action across rate products indicates a short term bottom unless tomorrow’s data is horrendous: The Fed’s preferred inflation measure is released tomorrow, Core PCE Prices yoy expected 5.5 to 5.6% vs 5.2 last.
–May June and July all have FOMC meetings (4th, 15th, 27th) so the next ‘clean’ FF contract is August, which settled 9841.5 vs the current Fed Effective rate of 33 bps. A contract yield of 1.585% minus 33 bps is 125.5 bps of cumulative tightening priced for the next three FOMC meetings. Some might say that if this pricing is reflected in the interest rate curve already, it has been thoroughly digested by stocks and housing and other asset classes. I don’t think so; you know what happens after digestion. I have a feeling markets will look very different by late summer.
Clues
March 29, 2022
–5/30 treasury spread briefly inverted yesterday and closed just above zero, with 5s 2.56% and 30s 2.569. It’s worth mention that the lowest contract on the SOFR curve is EDM’23 at 9703.5 and lowest Fed Fund contract is FFU’23 at 9698.5. These forward financing yields at 2.965 and 3.015 are 40+ bps above the longer dated paper on the treasury curve (which is financed by SOFR). With the continued sell-off in the front end, near ED calendar spreads settled at new highs, with EDM2/U2 at 69, +1.5 and EDM2/EDM3 159.5, up 5 on the day. While there’s a bit of hand-wringing in the financial press about the recessionary signal associated with treasury inversion, the eurodollar curve is quietly imploding, with red/gold pack spread (2nd year to 5th year) settling below negative 57, a new historic low. The lowest the 2/10 treasury spread has traded since the early 1990’s is -56; 2/10 is currently +13, a new low for this cycle. (Net ED changes, whites -4.875, reds -6.375, greens -1.125, blues +4.375 and golds +5.125). It’s like a seesaw with the big fat Fed sitting on one end while the helpless skinny (bond) kid is up in the air flailing on the other side. In the meantime stocks frolic on the jungle gym and oil has taken the slide (CLK2 down nearly $8/bbl to 105.96s).
–Also sliding yesterday was the yen, as the BOJ stepped in to cap JGB yields; it worked for Australia, right? USD strength in general helping to moderate the price of commodities.
–Carnage in the front end of the curve is causing an inversion of sorts in straddle levels. Consider levels on EDH’23, 0EH, 2EH and 3EH. The midcurves expire on the Friday prior to the quarterly EDH3, which is to say they all expire at essentially the same time (10-March 2023). Here are underlying futures prices and atm straddles: EDH’23 9692.0 with the straddle 123.0, EDH’24 9696.0 with the 0EH 9700^ 114.5, EDH’25 9722, 2EH straddle 107.0, EDH’26 9729.0, 3EH straddle 99.5. Nominal straddle levels are almost NEVER highest in the front. These are huge premium levels given underlying yields.
–The Fed previously prided itself on careful forward guidance; the market is saying that possible stresses are building which may require a much wider and more diffuse response. To be fair, the Ukraine war and lingering covid issues are large contributors of uncertainty, but the Fed seems to be missing a lot of market clues.
Regime Change
March 27, 2022 – Weekly comment
On Friday, Citi modified its rake hike forecast for 2022 to 275 bps. January 2023 FF fell 14.5 on Friday to 9759.5 or 2.405%, so the market is getting fairly close to pricing that outcome. With the current FF target 0.25 to 0.50 bps and six FOMC meetings left in the year, it implies that a majority of the meetings will feature 50 bp moves. A BBG article removes the implication and specifically states “Citigroup economists now seeing four straight half-point moves amid persistent inflation.” The NY Fed’s chief John Williams on Friday allowed that the Fed will hike 50 if it needs to. The Fed has become a completely reactive institution.
The ‘Regime Change’ title refers to a Fed that is now “…in inflation fighting mode” not to Biden’s adlibbed statement that Putin must be removed. Of course, the latter utterance may ultimately have more importance on the fate of the world. Speaking of fate, It was exactly 19 months ago on August 27, 2020 that the Fed formally adopted a different FAIT, or Flexible Average Inflation Targeting. This, as the country was being flooded with stimulus. Now the average inflation data has somewhat, well, overshot the target, leading to a story like this one from BBG, ‘A World That’s More Expensive is Starting to Destroy Demand’.
Let’s take housing as an example. In the beginning of 2022 the 30 yr mortgage rate was around 3.25%. According to a CNBC article by Diana Olick it’s now 4.95%. A mortgage loan of $350,000 started the year at just under $1525 per month. (Median home price at the end of the year was $408k). That same $350,000 mortgage at 4.95% is $1868 or over 22% higher. At the new higher rate of 4.95%, to keep the mortgage monthly payment at $1525 would mean a mortgage loan of just $286k rather than $350k. What impact does that have on the price of homes? The Fed’s Waller recently let it slip that the Fed would like to see home prices decline; I think he’s about to get his wish. The Homebuilder ETF, symbol XHB, is getting the message. Friday’s close is 23% lower than the price on Dec 31. However, the major stock indices appear oblivious to the inverse relationship between asset values and rates. I’ll always recall a friend of mine saying in 1999 that rising rates didn’t matter for the new dotcom tech companies, because they didn’t borrow, and therefore had no debt servicing costs. But what if the guy buying the shares DID borrow? Worse, what if he actually needs a stream of income rather than losses to service the debt? Mortgage applications were -8.1% last and the next release is Wednesday.
This week, there are treasury auctions of 2s, 5s and 7s on Monday and Tuesday. (WI yields Friday 2.31%, 2.545% and 2.55%). These yield levels are now the highest they have been since early 2019. Great news for savers, right? Finally! A shift favoring savers rather than spenders. Not so fast. The real 5y yield as approximated by the TIP is -1.15%, and the breakeven is a new record high 368 bps. Higher interest income more than vanishes when compared to inflation. Might as well keep spending. On Thursday, we’ll get the Fed’s preferred measure of inflation, Core PCE Prices, expected at a yoy rate of 5.5% vs 5.2 last. The last time it was 5.5% is when it was on its way down, 39 years ago in 1983. (In 1983 a severe drought took corn from 235 to 375, and beans from $6/bshl to $9.50. The first commercial mobile cellular phone call was made. Michael Jackson’s Thriller is the number one album. Monty Python’s The Meaning of Life is released). And then there’s this little tidbit:
September 26, 1983:
Stanislav Yevgrafovich Petrov (Russian: Станисла́в Евгра́фович Петро́в; 7 September 1939 – 19 May 2017) was a lieutenant colonel of the Soviet Air Defence Forces who played a key role in the 1983 Soviet nuclear false alarm incident.[1] On 26 September 1983, three weeks after the Soviet military had shot down Korean Air Lines Flight 007, Petrov was the duty officer at the command center for the Oko nuclear early-warning system when the system reported that a missile had been launched from the United States, followed by up to five more. Petrov judged the reports to be a false alarm.[2] His subsequent decision to disobey orders, against Soviet military protocol,[3] is credited with having prevented an erroneous retaliatory nuclear attack on the United States and its NATO allies that could have resulted in a large-scale nuclear war which could have wiped out half of the population of the countries involved. An investigation later confirmed that the Soviet satellite warning system had indeed malfunctioned. Because of his decision not to launch a retaliatory nuclear strike amid this incident, Petrov is often credited as having “saved the world”.
We’re completely reliant on technology these days. Let’s hope there’s a new Stanislav Petrov around to override both the technology and those who would unleash it.
https://en.wikipedia.org/wiki/Stanislav_Petrov
*******************************************
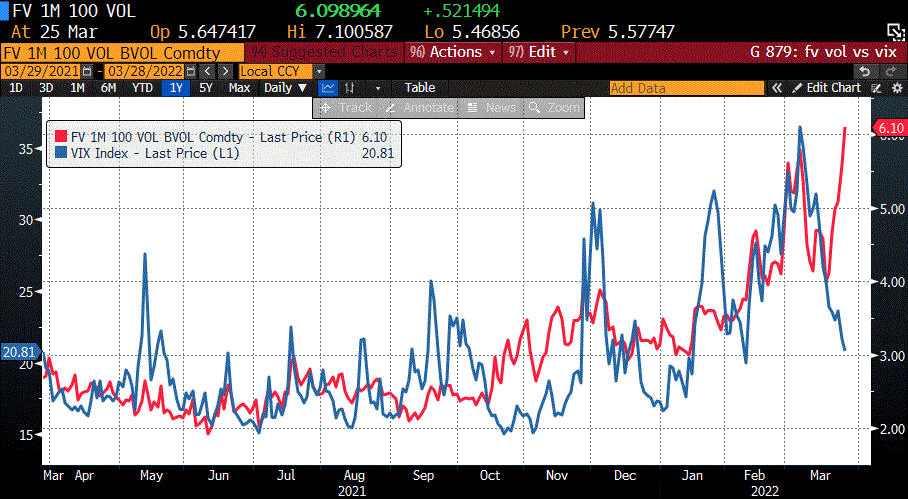
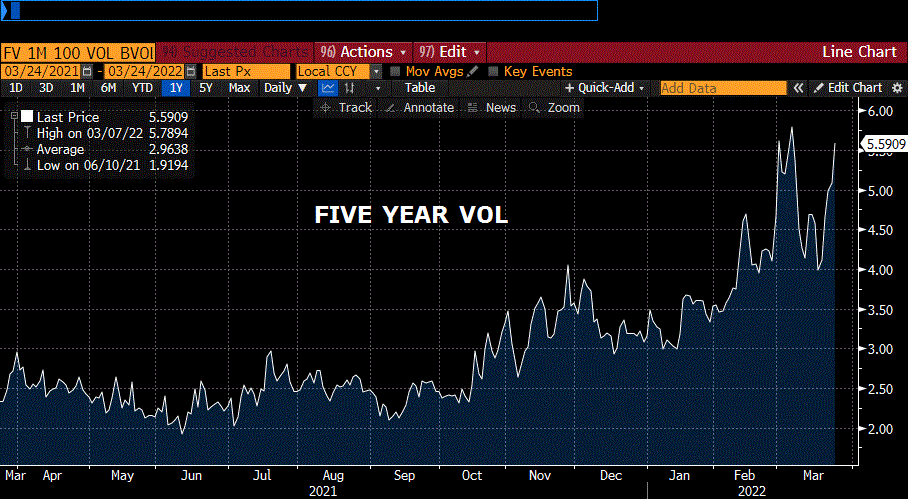
Implied vol in interest rate products is exploding higher. Below is a graph of FV vol vs VIX. Both measures made highs on March 7, FV at 5.8 and VIX at 36.5. FV vol made a new high Friday. VIX has plummeted to 20.8 as stocks ripped higher post-FOMC. One of these is wrong.
As mentioned during the week, July 2023 Fed Funds and January 2024 Fed Funds are settling at exactly the same price, which was 9709.5 on Friday or 2.905%. The lowest contract on the FF curve is Sept 2023 at 9705.5. On the Eurodollar curve, the lowest contract is June’23 at 9684 or 3.16%, and on the SOFR curve it’s also June’23 at 9710.5. The market is therefore forecasting a peak FF target of 2.75-3.00% by the middle of next year, with no more hikes beyond that period (indeed, eases are priced thereafter).
| 3/18/2022 | 3/25/2022 | chg | ||
| UST 2Y | 195.3 | 229.7 | 34.4 | WI 233.5 |
| UST 5Y | 214.1 | 257.2 | 43.1 | WI 257.2 |
| UST 10Y | 214.4 | 249.0 | 34.6 | |
| UST 30Y | 241.5 | 260.2 | 18.7 | |
| GERM 2Y | -33.8 | -13.5 | 20.3 | |
| GERM 10Y | 37.3 | 58.7 | 21.4 | |
| JPN 30Y | 89.1 | 96.8 | 7.7 | |
| CHINA 10Y | 281.0 | 280.0 | -1.0 | |
| EURO$ M2/M3 | 131.5 | 154.5 | 23.0 | |
| EURO$ M3/M4 | -27.0 | -24.0 | 3.0 | |
| EURO$ M4/M5 | -22.5 | -18.0 | 4.5 | |
| EUR | 110.51 | 109.82 | -0.69 | |
| CRUDE (active) | 109.33 | 113.90 | 4.57 | |
| SPX | 4463.12 | 4543.06 | 79.94 | 1.8% |
| VIX | 23.87 | 20.81 | -3.06 |
Treasury vol bid
March 25, 2022
–Treasury vol closed very strong. As attached chart shows, FV is near the high. The chart looks like oil or gold…spikes on initial Ukraine aggression, then a pullback mid-month. Oil and gold rebounded off the retracement lower, but are not near the highs from the early part of the month; in fact oil was down $3.50 late yesterday. The bid in treasury vol might be a signal of stress in financial markets in general, but stocks were strong, continuing the post-FOMC surge. Market makers pointed to a midday block of +30k FVK2 116.25c for 16 covered 114-305 with 22 delta (settle 15.5 ref 114-3125), and noted that trading conditions are rather thin, but it feels like it could be more than that. The ten-year yield was up 2.4 on the day to 2.34%, but the 5/30 treasury spread made a new low at 13.7 bps with the 5y yield +3.6 to 2.371% and 30’s down -0.8 bp to 2.508%.
–One other item worth mention. Yesterday I looked at a couple of near FF spreads regarding market expectations of (front-loaded) tightening. As of Thursday’s close, note that FFN’23/FFF’24 settled zero. Both contracts at 9728.5 or 2.715%. I.e. NO TIGHTENING expected in the last half of next year with rates expected around 2.75%.
–Of course the back end of the euro$ curve is heavily inverted, while EDM2/EDU2 made a new high at 59.5, EDM2 9843.5, -2.5 and EDU2 9784.0, -6.0.
Tell him the good part
March 24, 2022
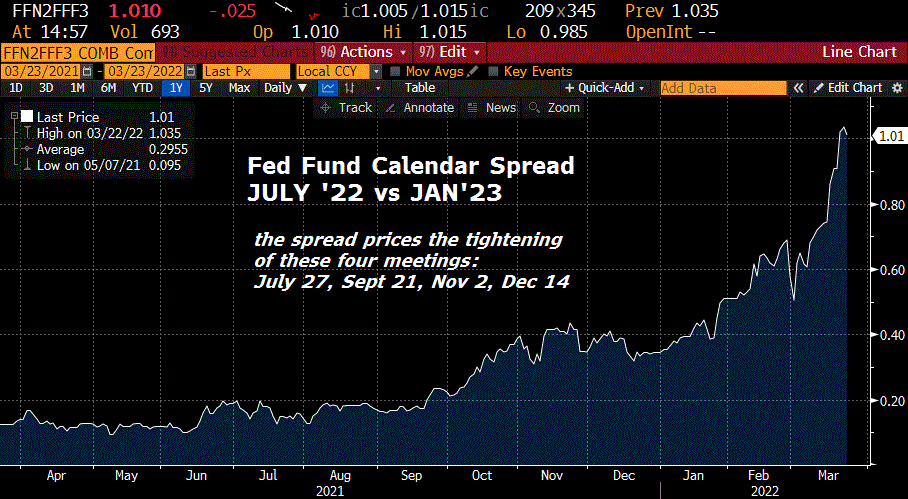
–In terms of the market’s perception of Fed tightening, perhaps there is nothing cleaner and clearer than a couple of FF calendar spreads. The attached image shows the six-month calendar July’22 to Jan’23 Fed Fund spread. It settled at 101, nearly 4 twenty-five bp hikes exactly, as it prices the four FOMC meetings on July 27, Sept 21, Nov 2 and Dec 14. The January’23/January’24 calendar spread prices the year of 2023. That spread settled 50.5 bps, or 2 twenty-five bp hikes….for the entire year. Obviously the market believes in the front-loading rhetoric of Bullard and Mester etc, but by next year, the market perceives serious slowing. The relevant prices are FFN2 9880.5, FFF3 9779.5 and FFF4 9729.0. Note the FFF4 contract is priced at a rate of 2.71%….WAY below current inflation readings. Does that make it an easy sale? Or does it tell you that the Fed’s hiking into an already slowing economy, which will REALLY put the brakes on?
“Some of our clients are speculating that the price of January 2024 Fend Funds will rise in the future, and we have other clients who are speculating that the price is going to fall.”
–New low in 5/30 spread which I marked at 18 bps at the CST 2:00pm futures settle, but it was printing 15.5 about an hour later. Some people, including Fed officials, are looking back to 1994 as a model for the current hiking cycle. I will simply note for now that in 1993 the FF target was 3% for over a year, from late 1992 thru ’93. By the end of that period there was a lot of pent-up demand. In the current environment, demand was artificially unleashed with stimulus checks and gov’t spending. The ten year yield started 1993 around 6.4% and ended the year around 5.85% so there was a lot of positive carry throughout the period. In 1994 total debt (z.1 report) was $13.7tr. Of that 33% was households, 29% businesses, and 28% the Federal Govt [doesn’t sum to 100% due to some other categories]. As of the end of 2021, total debt is $65 tr, HH balance sheets look good at 27%, businesses holding steady at 28% and the Fed Gov’t at 39%. Clearly the Federal govt has amassed debt to support the economy, and the Fed accommodated by buying that debt. Now the process is reversing, and a Republican Congress in November should somewhat stifle Fed Govt spending. It’s not 1994.
Is the end of forbearance another hike?
March 23, 2022
–Powell speaks today at a panel on Emerging Challenges for CBs in a Digital World, 8 am.
–Yields continued to rise to new highs with tens +6.5 bps to 2.373%, and twos up just 3 bps to 2.15%. One interesting note from yesterday’s action is that the curve steepened slightly on the move. On the eurodollar curve the first five year packs: whites, -1.25, reds -0.875, greens -4.625, blues -6.0 and golds -6.50. The eurodollar (and SOFR) curve is still inverted from EDM’23 (price 9702.5) forward, but slightly less so. June’23 SOFR is also the lowest contract on that strip (tied with SFRU3) at a price of 9728.5 or 2.715%. That forward funding rate is higher than every treasury yield except for the peak, which is the 20 yr, yielding 2.72% late in the day.
–New high in the front one-year euro$ calendar spread EDM2/EDM3 at 142 bps, up one on the day and signaling approximately six 25 bp hikes over that time frame.
–In the world of debt, I hadn’t considered student loans as a particularly large slice, but there’s a NY Fed piece of research that expects borrowers to have trouble making payments as forbearance ends. Link at bottom. To put it into context, the Fed’s last Z.1 report showed outstanding Consumer Credit for Q4 2021 at $4.434 TR. The NY Fed paper says that direct student loan debt outstanding (to the federal gov’t) is $1.3 TR, and that essentially none of that has been repaid, by 37 million borrowers, since forbearance started in 2020. So that amount is over 1/4 of total HH debt. The paper says that many of these borrowers will likely have trouble making payments once forbearance ends. My first thought was that in an extremely tight labor mkt with wages showing strong increases, how could that be true? My second thought is that many expect that $1.3 TR to be shifted from the column of outstanding Consumer (household debt) to the Federal Gov’t debt column as loans are forgiven. In any case, an end to forbearance would be another restraining headwind facing the economy as rates increase and energy prices rise.

