
No cigar
March 22, 2022
–It has been an amazing March so far. On March 1, EDM3 settled 9818.0, At yesterday’s settle it was 9702.5, down 115.5 bps in three weeks. The 2 yr note yield has gone from 1.34% to 2.12%. FFF’23 settled yesterday at 9778.5 or 2.215%, which prices 188.5 bps of tightening over the next six meetings (avg 31.4). The next four meetings are even more aggressively priced, with October FF (clean month, no meeting) 9822.5 or 1.775%, down 17.5 on the day, averaging 36 bps per meeting. Powell said yesterday the Fed could be more aggressive if needed.
–The lowest priced contract on the euro$ strip has now moved forward to EDM’23 at 9702.5 or 2.975%. That is, every contract out further than a year and a quarter has a successively lower yield. On the SOFR curve M’23 and U’23 are essentially the same price, with June at 9731 or 2.69%, higher than all treasury yields with the thirty year bond, for example, at 2.527% (up 11.2 on the day). The curve, of course, flattened to new lows by many measures. 2/10 closed at 18.8 and 5/30 at 19.6. The eurodollar curve plunged to historic lows with the red/green pack spread (2nd to 3rd year) at -30.875 and red/gold (2nd to 5th years forward) at -52.25. The US 2yr note is clearly the recipient of safety flows, while the eurodollar curve is likely pricing some near term credit stress.
–EDZ2 settled 9745.0, and a put condor bracketing this level was bought 60k: EDZ2 9787.5/9762.5/9737.5/9712.5 p condor bought for 6 and settled 5.25. Ultimately worth 25 with a settle between the middle strikes, which would be consistent with a FF target of ~2.25.
–Euro$ vol is exploding as Powell puts a lampshade on his head and says that anything can happen. In 2020 he was the anti-Volcker begging for inflation. Now he’s got it and all of a sudden he wants people to believe that he’s an ardent inflation fighter. No cigar. As an example of the vol surge, EDZ’23 atm 9725 straddle settled 123.5 on Friday. Yesterday the atm 9712.5 straddle settled 136.0
–The last time Powell tried to ‘normalize’ rates he was beaten into submission by a big slide in stocks in Q4 2018, and of course Trump was a vocal critic as well. No Trump this time, and stocks are signaling a free pass so far, but my guess is that equities will eventually deliver a bitch-slap that the Fed won’t be able to ignore.
Spring, or a global replay of Arab Spring
March 21, 2022
–Friday featured a continued rip in stocks on the quarterly option expiration, with SPX gaining over 7% from Monday’s low to Friday’s close. In rates the curve flattened further, with 2/10 at a new low of 19 bps, down 6 on the day. In euro$’s reds (2nd year) to all deferred contracts made new lows on spreads. Red/green settled negative 30.125 and red/gold negative 47.375. The difference between the two-yr note yield (1.953%) and thirties (2.415%) is just (positive) 46.2. The high yielding contract on the SOFR curve is EDU’23 at 9749, which is nearly 10 bps higher than the yield on the thirty year bond.
–Fed effective set at 33 on Thursday after the hike and April FF settled Friday at 9966.0 or 34 bps. The next two FOMC meetings are May 4 and June 15, so the next clean FF contract is July, which settled 9798.5, a spread of 67.5 to April. In other words, odds of hikes of 50 bps at a given meeting are being priced. Of course, last week Bullard said he would like to see 3% by year-end, with additional hawkish comments by Barkin, Waller and even Kashkari. Nothing in the market comes close to pricing Bullard’s blather.
–Meanwhile in Egypt, bread price controls: “It is worth noting that President Abdel Fattah El-Sisi directed the government to control prices in the markets and set specific prices for bread to prevent monopolistic practices and exaggerated increases in the prices of bread not subsidized by the state.” More and more articles are forecasting food shortages and famine.
2016 Rate Hike Cycle Compared to Now
March 20, 2022 – Weekly Comment
In the last hiking cycle, the initial quarter percent hike occurred in December 2015. The next didn’t occur until December of 2016, which was the beginning of a series of hikes which lasted two years and culminated in December 2018 at a top rate of 2.25 to 2.50%. In this note I consider December 2016 as the start of the hiking cycle.
Currently, the lowest contract on the Eurodollar curve is September 2023 which settled 9723.5 or 2.765%. On the SOFR curve, SFRU3 is likewise the lowest contract at 9749.0 or 2.51%. (ED/SOFR spread of 25.5). Though volumes are much more modest and open interest is quite small, the forward FF curve tells the same story, with a low price of 9740.5 for the November 2023 contract. In other words, as of this past week which contained the first FF hike of the new cycle, the market is forecasting a peak at the same level as occurred in 2018, that is, 2.5%. However, this peak is only one and a half years away, and in 2016 the cycle took two years.
The curve was different in 2016. At that time, the Eurodollar curve was positive through five years. On Dec 21, 2016 the golds (five years forward) were the cheap part. For example, EDH’21 at that time was 9727 and EDM’21 9722. These prices ultimately weren’t all that far off from forecasting the peak FF rate, although the timing was off. As the market began to price the Fed’s withdrawal of accommodation, the ten year popped above 2% in the beginning of November 2016, and hit 2.60% on December 15, 2016, just prior to the actual ‘first’ hike on Dec 19. The high yield in the ten year for 2017 was 2.63% set in March. The actual peak for the ten-year, which has marked the top since 2012, was 3.24% in November 2018, about a month before the final hike. Currently the yield is 2.15%.
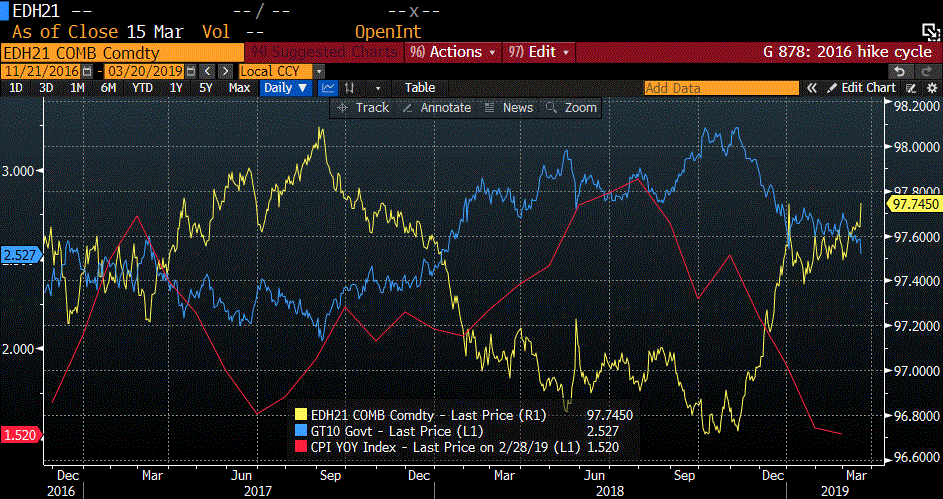
Of course, CPI was much lower in 2016. It was 2.1% in Dec 2016, then had an intermediate peak at 2.7% in February 2017 and fell back a bit, ultimately peaking at 2.95% in July 2018. On the chart above, which covers Dec 2016 through Q1 2019, the blue line is the ten year treasury yield and CPI is red. The yellow line is EDH’21 in price, which was Gold March at the time of the chart’s inception. The first thing I would mention about the last cycle is that CPI is below the ten year yield for the entire period except briefly in the middle of 2018. That is, real yields were positive. That’s a glaring difference from today, with CPI at 7.9% and tens at 2.15%. That’s the real conundrum between 2016 and now. Interest rate pricing and the ‘forecast’ of the futures curve isn’t all that different, but the inflation situation is wildly divergent.
In fact, last week Mnpls Fed President Kashkari posted a ‘mea culpa’ paper outlining his change of stance regarding both inflation and the appropriate path for short term rates (link at bottom, well worth review). He specifies his SEP changes. As recently as September, he thought year-end 2022 FF should be 0 to 0.25%. At the last meeting, just six months later, he thinks FF should be 1.75 to 2.0%. In September he thought 2022 inflation would be 1.8%. At the March meeting: “Actual inflation for 2021 ended up being 5.8% and I just increased my forecast this week to 4.5% for 2022.” He now believes it is plausible that we’re in a “high-pressure, high-inflation equilibrium”. Even with that being the case, his SEP projections still leave real rates highly negative through 2022.
Perhaps what the market considers more important going forward is not the FF target or neutral rate, but rather the size and rate-of-change of the Fed’s balance sheet.
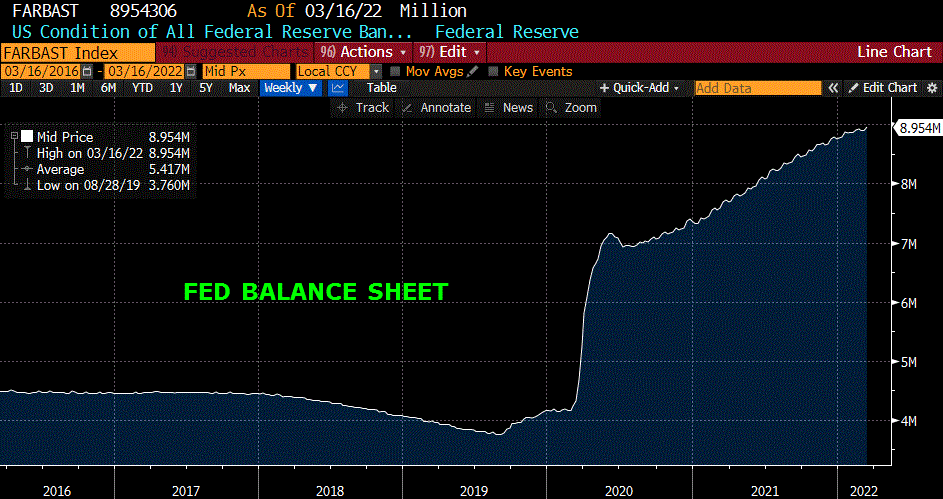
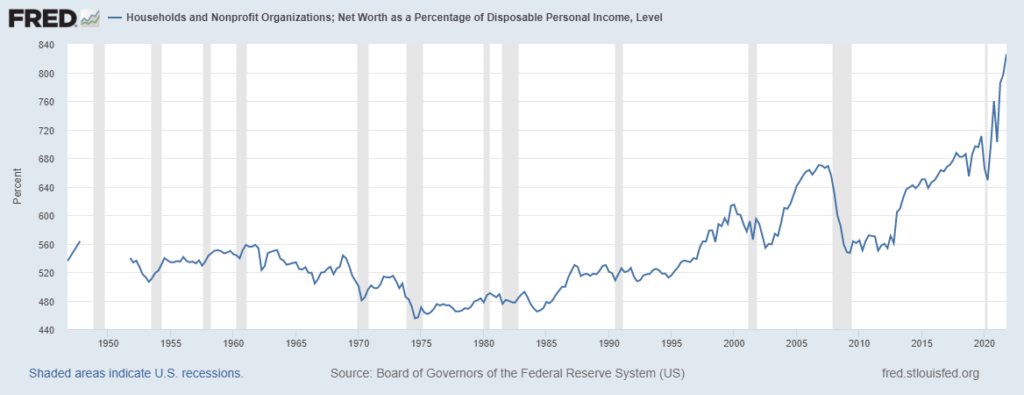
The picture above shows the Fed’s balance sheet. From Q4 2017, the Fed actually trimmed its size, decreasing it by $10 billion per month increments every quarter, ending with $50 billion per month starting in October 2018. As a small reminder, also at the start of October 2018, Powell said “we’re no where close to neutral”. That marked the top for stocks, which slid right into the end of the year, compelling Mnuchin to call the heads of the banks for a meeting to ensure everyone that there would be adequate liquidity. The Fed is now on the cusp of making the same mistake of deflating asset prices too quickly. The balance sheet exploded during the covid period, with the Fed buying $120 billion of securities per month, juicing the stock market, housing and nominal GDP. Household Net Worth is at an all-time high of $150 trillion which is an astonishing 825% of disposable income, versus a 40-year average going into 2010 of around 550%. Is it the size of the balance sheet that matters or the change? Just the halting of Fed purchases should be enough to slow things down, but now many Fed members actually want to start to decrease the size of the balance sheet concurrently with hikes at every meeting. Add to that the fact that Federal Gov’t Spending is decelerating from the torrid covid pace, and that midterm elections will likely result in even more fiscal restraint. Again from Kashkari: “We knew HH balance sheets were much stronger than before the pandemic, because the COVID-19 relief packages were so much larger than the income that was lost due to the pandemic.”
Quantitative easing compels investors to search for yield in riskier assets. Quantitative tightening shifts investor preference from more risky to less risky. This is likely a key dynamic which is flattening the curve and keeping long-end rates relatively contained. It’s all about asset prices.
| 3/11/2022 | 3/18/2022 | chg | ||
| UST 2Y | 174.6 | 195.3 | 20.7 | |
| UST 5Y | 195.6 | 214.1 | 18.5 | |
| UST 10Y | 200.0 | 214.4 | 14.4 | |
| UST 30Y | 236.0 | 241.5 | 5.5 | |
| GERM 2Y | -40.7 | -33.8 | 6.9 | |
| GERM 10Y | 24.9 | 37.3 | 12.4 | |
| JPN 30Y | 87.3 | 89.1 | 1.8 | |
| CHINA 10Y | 279.5 | 281.0 | 1.5 | |
| EURO$ M2/M3 | 100.5 | 131.5 | 31.0 | |
| EURO$ M3/M4 | -20.0 | -27.0 | -7.0 | |
| EURO$ M4/M5 | -8.5 | -22.5 | -14.0 | |
| EUR | 109.15 | 110.51 | 1.36 | |
| CRUDE (active) | 106.30 | 109.33 | 3.03 | |
| SPX | 4204.31 | 4463.12 | 258.81 | 6.2% |
| VIX | 30.75 | 23.87 | -6.88 | |
https://www.minneapolisfed.org/article/2022/update-on-inflation-and-monetary-policy
More certainty in rates?
March 18, 2022
–5/10 treasury spread came back to positive after inverting Wednesday, with fives -2.2 to 2.17% and tens +1 to 2.192%. However, on the eurodollar curve reds to deferred sank to new inverted lows. Red pack +0.875, greens +3.75, blues, +5.875 and golds +4.25. (Red/green settled -26.25 and red/gold -38.875). EDM’22 jumped 8.5 on the day to 98.565 and implied vol in rates continued to decline, now that some of the uncertainty about the Fed’s game plan has been reduced. As an example, a week ago Thursday EDU2 9825^ settled 71.5 and EDZ2 9800^ at 87.5. Yesterday, at-the-money EDU2 9812.5^ settled 54.0 and EDZ2 9775 at 71.0. So Dec is now where Sept was a week ago. There are six FOMC meetings left this year. A 25 bp hike at each would take the target to 1.75-2.00%; January ’23 FF is right at the upper end of that target at 9802.5 or 1.975%.
–Stocks have had an amazing post-Fed rally, but pulled back from highs late yesterday, perhaps due to a warning that Putin may become more vocal in terms of a nuclear threat. Big option expiration today. Long end of the treasury market had a terrible close yesterday with yields at new highs. Ten year ended at 2.19% which is exactly the 61.8 retrace from the 2018 high of 3.23% to the 2020 low of 51 bps. It wouldn’t be surprising for bonds to see temporary support here and indeed there is a minor bounce this morning with TYM +9.5 to 124-200.
–I received a text from a friend yesterday with an unsolicited but interesting quote on CLZ’23 500 calls, which were 0.30/0.80 (thanks PMV). I later looked at CLZ’22 300 calls and saw a market of 0.50/0.57. Front oil contracts are bouncing around just above 100. CLZ2 settled 88.12 and CLZ3 79.36. I guess this is the glass half-empty or full: The forward curve is saying oil prices are coming back down, but option markets reflect fear of an upward explosion.
–Existing Homes and Leading Indicators today.
Inversion leads to submersion
March 17, 2023
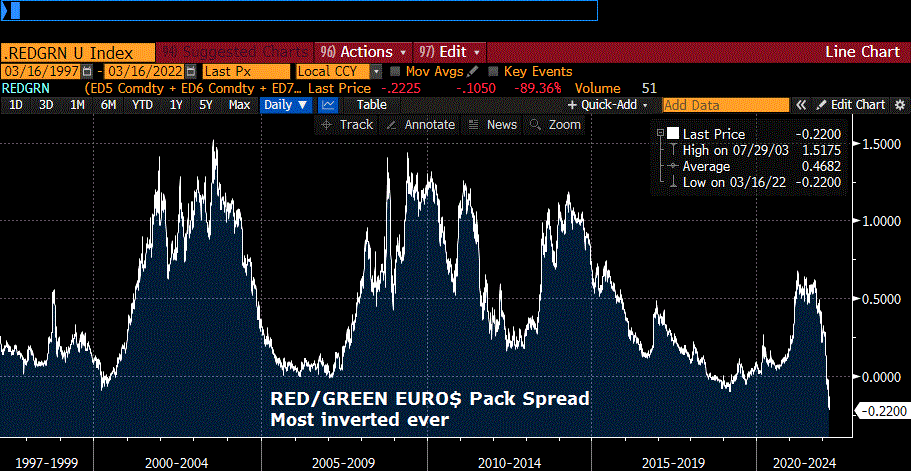
–The FOMC meeting resulted in a 25 bp rate hike and inversion in the 5yr to 10yr which ended at -1. (2.191% in 5s, +7.9 on the day and 2.181 in 10s, +2.3). As the attached chart shows, the red/green (2nd year to 3rd year) euro$ pack spread went to an historic inversion of -23.375 bps. Same with red/gold at -35.5. The red pack (EDM3, U3, Z3, H4) ended -14.125 at a price of 9730 or 2.7%. Apparently FOMC members have felt such incredible pressure from constituents on inflation, that the FF projection for the end of 2022 leapt from 0.9% in December to 1.9% yesterday. January 2023 FF contract accepted that message, falling an incredible 16 bps to 9802 or 1.98%. Rather than being forward looking, our central bank is now being pushed around by news headlines. The yield curve is telling you something that news headlines aren’t.
–A couple of days ago I noted that Sept’23 SOFR contract had a slightly higher yield than the ten year treasury. That has now moved forward in time, with SFRH3 (March’23) at 9767 or 2.33% while 10y is 2.18%. The financial machine is going to have an awfully hard time making money as funding rates exceed the yield on longer dated assets. My guess is that it’s all going to rhyme with Q4 2018, when SPX fell 20% and Mnuchin called the heads of banks to reassure the public that liquidity would be adequate. However, for now, SPX jumped 2.24% yesterday. Remember, that’s how it was at the start of October 2018, when Powell said we’re nowhere near neutral and QT ratcheted up to $50b per month – stocks were at new highs at the end of Sept’18. Of course, at that time we didn’t have the financial dislocations related to sanctions, and it was pre-covid.
–The thirty year bond yield FELL 4.5% yesterday and USM is up another 1-12 this morning at 153-06 with gold up $35/oz to 1945. Silver’s up 79 cents to 25.50. That’s going to much more useful for transactions (like buying a corned beef sandwich and beer) when cyber attacks cripple the grid.
–Happy St Pat’s!
FOMC day
March 16, 2022
–FOMC today with 25 bps expected. FFJ2 settled 9964.0 or 36 bps, 28 above the current EFFR. January ’23 FF contract settled 9818.0 or 1.82%, indicating 25 bps at every meeting through the end of the year, just like the 2004/2006 cycle which featured hikes at every FOMC meeting for 2 years.
–Main feature yesterday was the implosion of front end straddles. EDU2 9825^ settled 62.0 vs 68.0 on Monday with futures unch’d at 9820.5. EDZ2 9825^ declined from 86.5 to 81.5 with EDZ2 +0.5 at 9786.0. The 9800/9750/9700p tree which was sold 50k last week at -2 (paid 2 to buy the two legs) settled 6.25 yesterday with the 9800 put over. While near dated straddles declined, long green premium remained unchanged on the day.
–The oil spike associated with Putin’s invasion was completely erased yesterday with CLJ -6.57 to 96.44. There are increasing signs that a compromise agreement is drawing closer, but PPI still posted a 10% yoy increase. Retail Sales today expected +0.7 from a 3.8% gain last month.
–From December’s SEP or projection darts, PCE prices for 2021 were raised to 5.3% from September’s 4.2. That number likely has to rise again. For 2022, Dec was 2.6 up from September’s 2.2. Core PCE in Dec was only raised to 4.1% from 3.7 in Sept. For 2022, 2.7 from 2.2 and in 2023, 2.3 from 2.2. Somewhat interesting that GDP was revised DOWN from 5.9 in Sept to 5.5 in Dec. For 2022 the it went up a bit to 4.0 from 3.8 , and in 2023 down again from 2.5 to 2.2. The NY Fed long ago suspended their GDP Nowcast, citing COVID uncertainty as an excuse, the FOMC should have done the same thing with the dot plot.
Unpaid debts and Turning points
March 15, 2022
–“The Ides of March is the 74th day in the Roman calendar corresponding to 15 March. It was marked by several religious observances and was notable for the Romans as a deadline for settling debts. In 44 BC it became notorious as the date of the assassination of Julius Caesar which made the ides of March a turning point in Roman history.”
–It feels like the debts have now come due and it’s time to pay the piper. There are many signs of stress, but perhaps a crystallization is Barclay’s halting new units of oil and volatility ETNs:
“Barclays announced that it has indefinitely suspended issuance of new units of its oil and volatility ETFs. The oil product has the ticker OIL and the volatility product is VXX, which is a cousin to the infamous XIV ETN.
https://www.forexlive.com/news/barclays-suspends-issuance-of-oil-and-vix-etns-20220314/
–Banks are choking on their own derivatives. In 2007 the bell-ringer was the implosion of Bear Stearns sub-prime mortgage funds in June, they were marked to zero by early July. The markets took this news in stride, and the main indexes didn’t top until over a year later. Apart from today’s Barclays tidbit is, of course, the nickel market fiasco, the plunge in China’s stocks which continued today, freezing of Russian assets. Longer dated eurodollar straddles continue to expand in value, a clear, if obscure, sign of stress. While some of the premium expansion is undoubtedly related to uncertainty regarding the Fed’s rate path and can be explained by the move to higher yield strikes, I believe it’s more than that. On March 7 the EDZ4 long green 9812^ was 134. Yesterday EDZ4 9762^ is 158 and a year closer in, the EDZ3 9750^ is 140. Yesterday it seemed as if treasuries should have found more solid footing as risk assets sold off. However, tens rose 13 bps to 2.137%. Investors are selling what they CAN to raise liquidity and pay for what they CAN’T.
–The attached chart is one-year forward March’23 SOFR future which was 9784.5 at 3:00pm, or 2.155% vs the 10y treasury yield, 2.137%. The SOFR rate represents a funding rate for treasuries, and according to this futures contract, has now exceeded the 10y yield. In a year, there will be no positive carry. This date of reckoning has moved forward in time. Jim Bianco noted that the treasury curve has never inverted at the start of a Fed hiking cycle. Um, the red/green eurodollar pack spread is NEGATIVE 19.25. It feels as if the foundations of finance have become quite shaky. We’re probably not far from various groups screaming for a gov’t bailout: “What’s happening now is every bit as bad as covid, doesn’t it merit the same gov’t response?”
Removing the Security Blanket
March 13, 2022 – Weekly Comment
From a BBG article:
“Asset purchases have been used as a blanket to smother the sparks of uncertainty in Europe for the last decade,” said Oliver Blackbourn, a fund manager at Janus Henderson Investors. “With a geopolitical shock of unknown length and intensity still on-going, markets have clearly been surprised by the ECB’s decision to start reducing this safety net.”
Bonds have been battered in a week that saw the ECB unexpectedly accelerate its wind-down of stimulus programs as well as reports of plans for massive debt sales by the bloc to fund energy and defense spending in the wake of Russia’s attack on Ukraine.
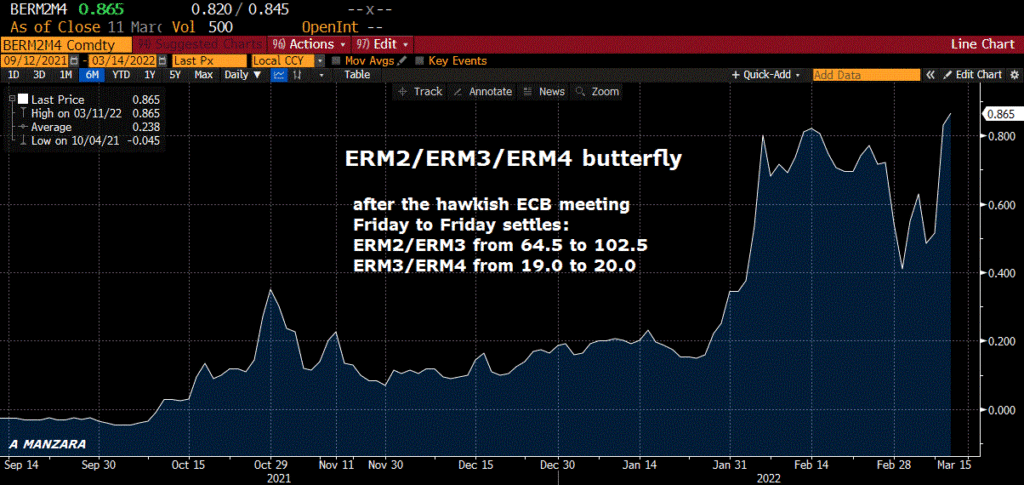
The ECB took a hawkish turn this past week with the German Schatz and bund both up about 32 bps; the bund ended the week yielding just under 25 bps. Italy 10s went from a high of 1.97% on Feb 14, to a low of 1.40 on March 1, back up to 1.90 after the ECB meeting. As can be seen on the ERM2/ERM3/ERM4 butterfly chart (82.5s), the near spread (ERM2/M3) exploded 38 bps on the week as the ECB shifted the market’s expectations to near-term tightening, echoing the US market with relative steepness in front followed by flatness or inversion in back. In the US, EDM2/M3/M4 is 120.5 (100.5 in EDM2/M3 vs -20.0 in EDM3/M4).
The Fed Effective Rate has been 8 bps every day of this year. April FF settled at 9966.0 or 34 bps, indicating a high degree of confidence that the FOMC will hike by 25 on Wednesday.
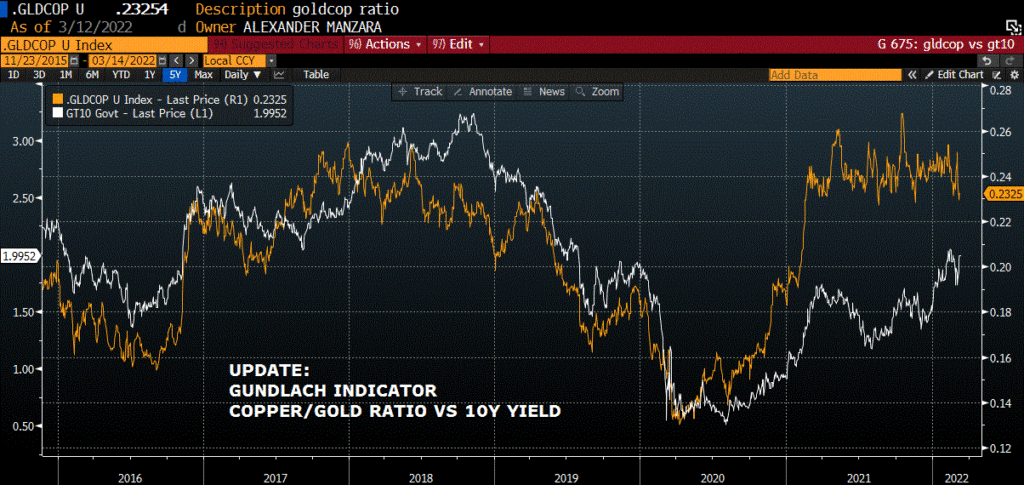
In the US, treasury yields went up similar magnitudes to Germany as the security blanket here is also being removed. 2s up 25 bps to 1.748, 5s up 32 to 1.958 and 10s up 28 to end at 2.00%. TYM2 posted an outside range week, making a high of 129-04 on Sunday night, and closing at the week’s low 125-30. The 10y 2% yield is once again just over the late 2019 pre-covid high. The copper/gold ratio appears a bit vulnerable to the downside, but if it holds the bottom of the past year’s range, would suggest a further leg up in the ten-year yield. The picture on yields remains bearish.
At the December FOMC, the SEP (Summary of Economic Projections) estimated 2022 GDP at 4.0% and PCE inflation at 2.7%. Clearly the latter will have to be raised, and the former, whether officially trimmed in the SEP or not, is too high. The Atlanta Fed GDP Now estimate for Q1 is just 0.5. According to Curinos (via twitter) “Feb 2022 mortgage rate-lock volume was down 41% yoy and 8% mom across all channels… The average 30-yr conforming retail funded rate in February was 3.63%, 24 bps higher than in January and 72 bps higher than the same month last year. Refi rates were 22 bps higher mom and 68 bps higher yoy.” The housing market and other interest-rate sensitive sectors are going to decelerate.

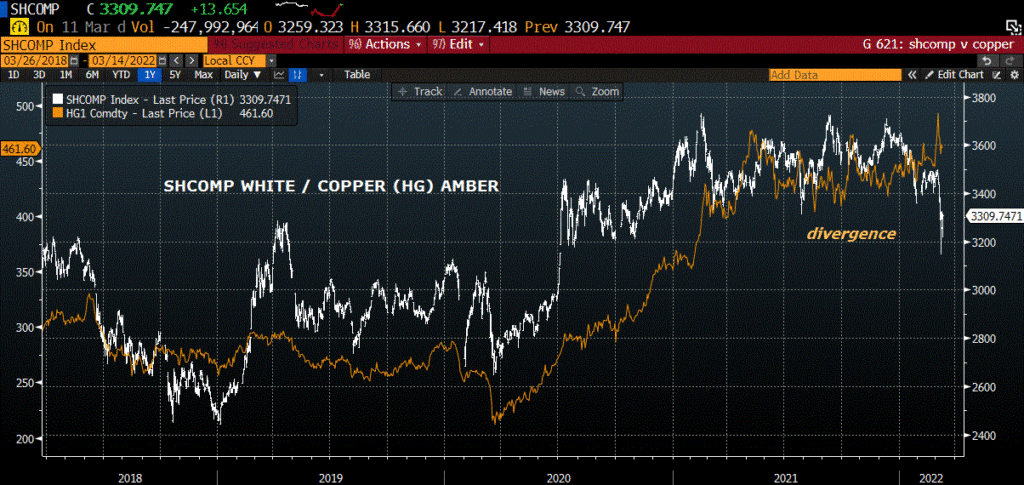
China continues to slow as well, with the Li Index at its lowest level since the pandemic as of the end of the year. Shanghai Comp is down 9% since the start of the year and Shenzhen Comp is down 14%. The increase in food and input prices is crimping the economy, along with the property sector implosion. No confirmation on this, but I have heard China is only manufacturing certain products three days a week due to rolling blackouts.
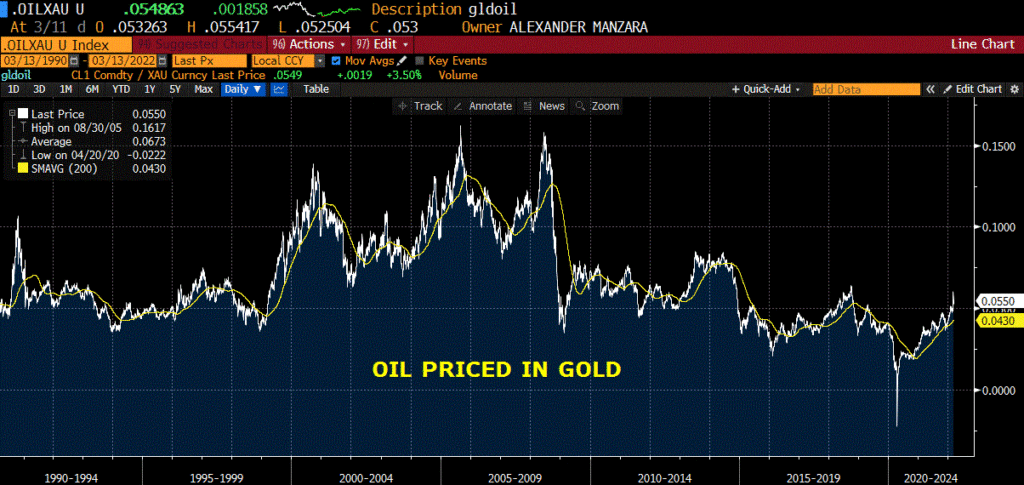
It’s somewhat interesting to note that crude oil (WTI) priced in gold is pretty much where it was through the middle 1990’s. I guess that’s another way of saying that the purchasing power of USD, even though DXY has been rallying, is under a cloud of suspicion, with gold more-or-less retaining its purchasing power. Gold is money.
One could substitute “stocks” for “Europe” in the first line of this note. That is, “Asset purchases [and monetary policy in general] have been used as a blanket to smother the sparks of uncertainty in the US stock market for the last decade.” The Z.1 quarterly report from the Fed revealed that Household Net Worth ended 2021 at a record $150.29 trillion. The St Louis Fed website includes a chart on HH net worth divided by GDP, but data ends in 2014. However, a similar idea is this one: HH Net Worth as a percent of Disposable Personal Income. Chart below. The average from the 1950s to 1995 was about 550%. Last reading is a record 825%. If there’s such a thing as reversion to the mean, or even reversion to trend since 1995, US asset values are in for a large retrenchment.
OTHER MARKET THOUGHTS/TRADES
On Tuesday, there was a large new seller of EDZ2 9800/9750/9700 put tree for -2.0. That is, the 9800 puts were sold, and the 9750 and 9700 puts bought. Settled -1, or 45.0, 28.25, 17.75 vs 9804.5. That trade appears to have marked the peak reach for skew/downside. By Friday, EDZ2 settled 9794.0 and the put tree settled +3.75, or 45.75, 26.50. 15.50.
| 3/4/2022 | 3/11/2022 | chg | ||
| UST 2Y | 149.0 | 174.6 | 25.6 | |
| UST 5Y | 163.2 | 195.6 | 32.4 | |
| UST 10Y | 172.2 | 200.0 | 27.8 | |
| UST 30Y | 214.7 | 236.0 | 21.3 | |
| GERM 2Y | -73.0 | -40.7 | 32.3 | |
| GERM 10Y | -6.9 | 24.9 | 31.8 | |
| JPN 30Y | 84.2 | 87.3 | 3.1 | |
| CHINA 10Y | 282.4 | 279.5 | -2.9 | |
| EURO$ M2/M3 | 87.5 | 100.5 | 13.0 | |
| EURO$ M3/M4 | -26.5 | -20.0 | 6.5 | |
| EURO$ M4/M5 | -7.5 | -8.5 | -1.0 | |
| EUR | 109.35 | 109.15 | -0.20 | |
| CRUDE (active) | 115.68 | 109.33 | -6.35 | |
| SPX | 4328.87 | 4204.31 | -124.56 | -2.9% |
| VIX | 31.98 | 30.75 | -1.23 |
STFR
March 11, 2022
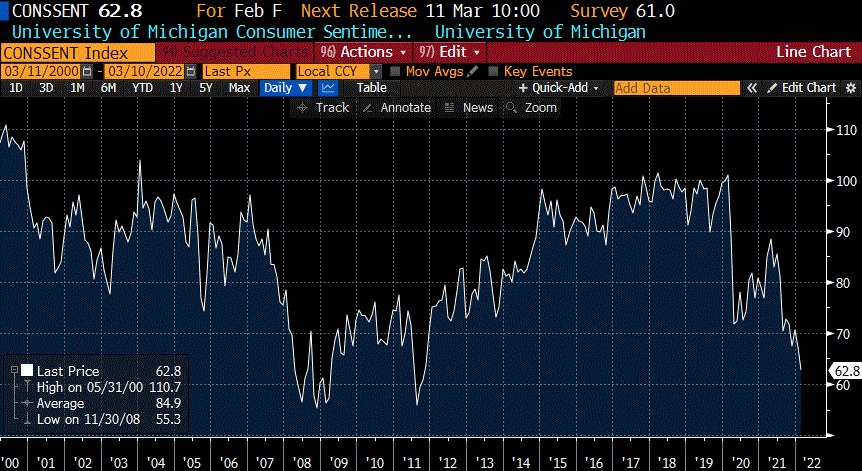
–As advertised, yoy CPI was 7.9% and absorbed by the market without mishap. The thirty year auction was well-received as yields are finally moving toward a respectable level with the 30y ending 2.394%, though certainly not on an inflation-adjusted basis. Today we get University of Michigan’s Consumer Sentiment number, shown on the attached chart. The last 20 years have seen a range of 103.8 to 55.3, the low related to the GFC in October 2008. Last was 62.8 with an expectation today of 61.0. Imagine if unemployment were high and mortgage rates were on the rise.
–Yesterday EDZ2 9800/9750/9700 put tree settled 2.5, 45.0, 26.5 and 16.0. Tuesday, it traded -2, with paper selling the 9800p at a discount to the lower legs. The extreme bid for downside in dollars has likely peaked.
–Atlanta Fed GDPNow estimate is 0.5% for Q1 (From 3/8). FOMC projection for GDP in 2022 is 4.0% (from December). Yellen warning inflation to get worse. STFR
–March midcurve eurodollars expire today.
CPI and the Z.1 report
March 10, 2022
–Today features CPI, expected 7.8 to 8.0% yoy. Job Claims as well. Wednesday was the last gasp QE buying, as the Treasury auctions the thirty-year bond today. Also released today is the Fed’s quarterly Z.1 for Q4. The financial press mostly focuses on the Household Net Worth feature of this report, which will surely post a new record high. In my opinion, this will prove to be the high for some time, perhaps years, as the Fed withdraws accommodation and fiscal stimulus from the Federal Gov’t has now gone into reverse. Also contained in the Z.1 report are debt levels for Households, Business, and Gov’t. I would simply note that pre-covid in Q3 2019 the amount of Fed’l Govt debt was listed at $18.844T, and two years later, Q3 2021 it was $24.648T an increase of 31%. Without the Fed buying a lot of this debt, and with inflation around 8%, it’s pretty tough to see who buys long dated treasuries which are sporting a yield of 2.3%.
–On a technical basis, this has been a bearish week so far for the long end. Both TY and US contracts have featured ranges that engulf the previous week. For example USM on Monday marked a high of 160-12, late yesterday it was more than 5 points lower, with a low print of 155-08. In TYM2 the high was 129-04 and yesterday’s low was 126-165. This suggests that impulsive longs are getting shaken out.
–Implied vol took a tumble yesterday. EDZ2 9800 straddle settled 94.5 on Tuesday and 88.5 yesterday with futures -3 to 9801.5. TYJ atm 127.25 straddle on Tuesday was 1’59, but as we slid to lower vol strikes, yesterday’s 126.5^ settled 1’33. Yesterday there was a new seller of 35k EDU2 9837/9762/9712p tree at 13.5. Settled 37.75/23.0/8.5 or 14.5 vs 9833.5 as demand for downside strikes continues. March ED midcurves expire tomorrow.
–This morning April WTI (CLJ2) has rebounded over $4/bbl to 113.00 as Senator Warren helpfully suggests a windfall tax on oil companies.

