
Federal debt has a ceiling. Crude oil calls don’t
Sept 29, 2021
–Yields jumped as energy costs continue to surge, with the debt ceiling process adding drama. Tens up 5.4 bps to 1.536%. Once again the eurodollar curve steepened, with many one-yr calendars edging to new highs. Peak EDU’22/EDU’23 settled 72.5, up 1 at a new high. Red/gold pack spread settled over 120 bps, also a new recent high, while 2/10 ended at 123, the high since June when the FOMC meeting sparked a broad flattening move. On the June FOMC day EDZ’22/EDZ’23 traded 118.5; yesterday it settled 113.5 and printed 115, almost a complete recovery.
–Yellen warned the Treasury may not be able to make all commitments after October 18. Jamie Dimon said he is positioning JPM for a “potentially catastrophic” outcome. SPX fell 2% but Nasdaq led the way, closing -2.8%. Treasury implied vol rose, but there is no panicked put buying. TYZ 131.5^ settled 1’56, 4.5 vol.
–Lagarde said a challenge is to look past “transitory shocks”, without mentioning that Central Banks are partially responsible for creating bottleneck conditions. Ditto for Powell, who Senator Warren is calling “dangerous”.
–In yesterday’s note I led off with a comment on CLZ’21 100 calls. During the day, Dec’22 200c in WTI opened up with a trade at 8 cents and settled 6 against a futures settle of $67.82 in CLZ’22. CLZ’22 150 calls settled 19 cents.
In: Eurodollar Options
100 calls
Sept 28, 2021
–December 100 calls. You’re probably thinking, no, it was EDM2 100 calls that trade 1 yesterday, not December. I’m not talking euro$’s, but rather WTI. CLZ1 100 calls have about 18k in open interest and settled 15 cents yesterday. This morning Nov WTI is at a new high, up 95 cents to 76.40, as the press becomes more comfortable in referring to the current energy crunch as a CRISIS. In terms of inflationary impact, CNBC blares this headline: ‘Fed Chair Powell to warn Congress that inflation pressures could last longer than expected.’ That’s a bit of a stretch from the Chairman’s comments to be delivered to Congress today, which are posted on the Fed’s website. Here’s the relevant excerpt: “Inflation is elevated and will likely remain so in coming months before moderating. As the economy continues to reopen and spending rebounds, we are seeing upward pressure on prices, particularly due to supply bottlenecks in some sectors. These effects have been larger and longer lasting than anticipated, but they will abate…”
–Yields rose yesterday and are up again this morning as 1) tapering is expected, 2) oil jitters feed inflationary expectations and 3) the debt ceiling circus moves to center stage. Tens up 2.4 bps to 1.482%. Seven year auction today. On the eurodollar curve, once again all near one-year calendars posted new highs. Worth mention is EDZ1/EDZ2 which was hanging around 25 bps before the FOMC, and settled 34 yesterday. More than one hike by the end of next year is starting to seep into pricing. The peak 1-yr calendar remains EDU2/EDU3 which settled at a new high of 71.5 yesterday, up 0.5 on the day.
–Back to EDZ’22: it settled 9947.5, down 0.5 on the day. There was a large 0EZ 9962/9950p 1×2 bought for 1.5 covered 9949, 25 delta (sold futures). It’s a vol crush, though further back on the curve vol remained better bid. Settles on the 1×2 were 16.0 and 7.5. The top strike showed a gain of 38k in open interest, the lower strike added 30k, so it appears as though long 9950 calls were turned into a vanilla 1:1 put spread. There does not, as yet, appear to be a scramble for otm puts in the interest rate complex. Which is to say, there’s still a chance to buy now…
–Powell’s term ends early next year, and has yet to be re-nominated by Biden. Fed Presidents Rosengren and Kaplan both resigned yesterday due to the appearance of impropriety related to personal trades. I saw a report, unconfirmed, that Bostic owns shares in banking stocks. The composition of the Fed may be much different next year.
In: Eurodollar Options
Higher yields
September 27, 2021
–EDZ3 trades 9879 this morning, -3.5 from Friday’s settle, and the lowest price since early April. Auctions of 2 and 5 year notes today, followed by 7s tomorrow. We’re seeing a concession for auctions…is it enough? Brainard slated to give a speech on the Economic landscape at 12:50. Williams speaks at noon, also discussing the outlook, but Brainard is more important for policy. I would suspect both will say that conditions for taper either have been or are very close to having been met.
–Friday saw a notable buy of 50k FVZ 121.75p for 11.5 ref 122-27. This morning FVZ has traded a low of 122-20.75. The cash 5y yield is 98 bps, a new high on the year. The WI prints 1.00%. WTI crude CLX1 has traded over $75/bbl today, a new high for the year. NatGas also surging, though below the highs set a couple of weeks ago. News articles abound this weekend about the energy crisis in Europe, and in northern China, where industries such as textiles and steel mfg are said to be subject to power outages. High natural gas and electricity prices have caused suspension of activity at some fertilizer plants. Food and energy. And shelter. Look, if you strip those prices out, it’s really not that bad. Right?
–In eurodollars, red/green (2nd to 3rd year forward) calendar spread made a new high Friday just over 59 bps. The high in red/green in early April was 67.5…worth making a mental note of that level. 2/10 prints 120 this morning. Late march high was 157.6. 2/5 prints 70, high for the year has been 77.5.
–Bundesbank today said German inflation is expected to peak at 4-5% this year and will stay above 2% through mid-2022, exceeding the ECB’s target. Bund yield continues to climb toward 0, now -20.6 as the political shift creates further uncertainty.
In: Eurodollar Options
Weight on Fives
September 26, 2021
We begin with a couple of notes from the NY Fed’s UIG report and Liberty Street Economics blog. First, the Underlying Inflation Gauge “full data set” is 3.8% for August, unch’d from July. The “prices only” measure increased 0.1% to 4.1%.
Second, from Liberty Street; ‘Have Consumer’s Long-Run Inflation Expectations Become Un-Anchored?’ I’ll spare you the suspense: the authors conclude that the answer is no. However, some notes on near term expectations are quite illuminating. Here is just one salient excerpt:
We see an increase in the median one-year ahead inflation expectation between July 2019 and April 2021 (from 2.92 percent to 3.24 percent), followed by a sharp rise (from 3.24 percent to 4.84 percent) in the four months that separated the April and August 2021 surveys. In the special surveys, respondents were also asked for the reason(s) that led to this sharp increase. Overwhelmingly, they mentioned it was driven primarily by their own experience with higher prices during that period.
In sharp contrast, the same table indicates that the median five-year ahead inflation point prediction remained unchanged at 3.00 percent between July 2019 and April 2021, and increased only modestly between April and August 2021 (to 3.16 percent).
For the five year survey, respondents are asked for an expectation over a one-year period, five-years forward, for example, “Over the 12-month period between August 2025 and August 2026.” If I had no knowledge and I were asked that question, I would first ask, “What are other people saying? What did the last survey have?” I might look at the price of my house over the past five years and just figure it’s one-fifth of that gain. The point is, it’s a tough question. On the other hand, over the last year, people are seeing inflation with their own eyes and wallets: “driven primarily by their own experience”. By the way, also from the survey, “…the proportion of respondents who expect inflation a year from now to be between 1% and 3% dropped from 41% in July 2019 to 18% in August 2021. Meanwhile, the proportion of respondents who expect inflation a year from now to be between 5% and 7% more than doubled (from 12% to 28%) during the same period.” Note that the SEP FOMC projection for PCE inflation at the end of 2022 increased by just 0.1 to 2.2%. Rather a large disconnect.
This means that over 80% of the respondents expect near-term inflation to be over 3%. Yet the authors blithely conclude that long term expectations remain anchored. That’s cute.
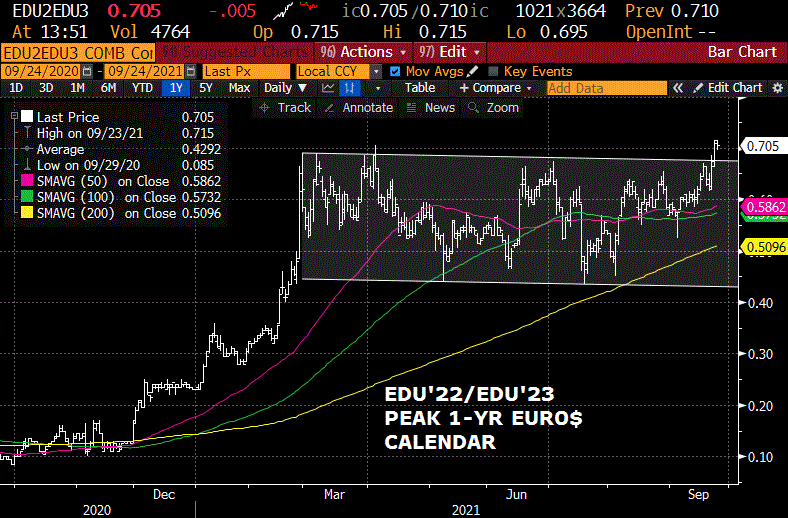
Now just a couple of words about price action. Two charts on the next page: Top is EDU’22/EDU’23 one-year calendar spread, which settled at 71, the high of the year. This is the peak one-year calendar on the strip, artificially high because Sept’22 is before the SOFR transition while Sept’23 is after. The other chart is the US five-yr treasury yield, with a notation about a large put buyer Friday.
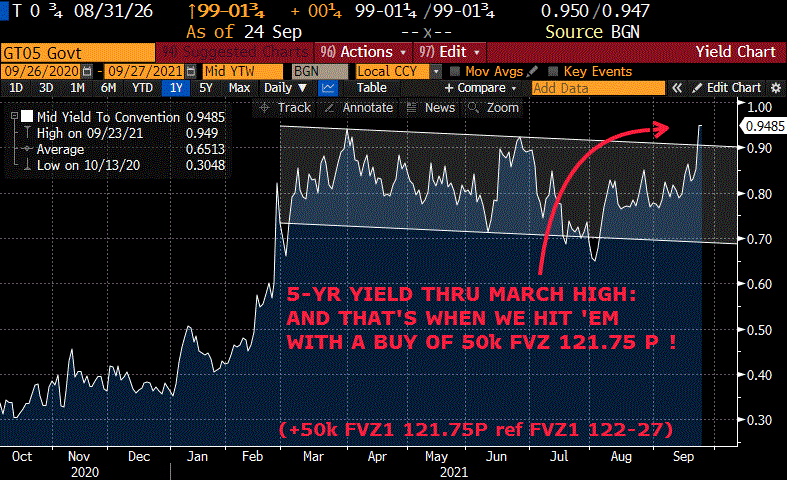
The specific FV trade was a new buyer of 50k FVZ 121.75 puts for 11.5/64’s when FVZ was trading 122-27. Settled 12.5 vs FVZ 122-2625 with -0.22 delta. On the previous Friday, there was a buyer of 50k FVX1 123.0 put for 17.5. These settled 28 on Friday.
In October of 2020, there were a couple of large trades in Blue March midcurves, buying put spreads and selling call spreads. For example a buy of 100k 3EH 9912/9900ps vs 9975/9987cs, 0.25 paid ps. This is what kicked off consistent action and interest in blue March and June midcurve puts. Of course, the real sell-off came in Feb and March. As it turns out, the bearish posture was correct, as was the timing. Now, all of a sudden we have large put buyers on FV options. The benefit of midcurves is that they allow a longer duration…there are only 22 lots open in FVH futures and no options on that underlying month. December options expire Friday, 26-Nov so only have nine weeks until expiry. Whatever the reason for these particular FV put buys, the timing for a change in perception is close.
When the Fed is thought to be on hold in the near term, it makes more sense to buy puts on forward years, like green or blue midcurves, because the first couple of years might be anchored by the zero bound. But consider the following sort of scenario: Taper ends by June and the inflation numbers have rocked higher as shelter costs filter into the data. The Fed could easily be forced into several hikes.
What do we have on the technical picture? The five year yield made a new high on the year, ending Friday at 95.5 bps. EDU22/EDU23 spread also edged to a new high at 71. Now this is NOT the highest a one-year spread has been in this calendar year; as noted last week that high was 78 bps.
In terms of back of the envelope calculations, the 121.75 strike is approx. 20-21 bps away. The option cost is equivalent to about 3.4 bps. For a rough comparison, EDZ3 settled 9882.5, or 1.175%. The November midcurve options on Z3 expire 12-Nov and Dec expire 10-Dec. Settles on the 9862.5p were 3.5 (2EX1P 9862.5) for November and 5.5 (2EZ1P 9862.5) for December. If Fed hikes are “in play” faster than the market currently anticipates, then the FV puts are a better buy.
By the way, total open interest in FV puts is only 213k in November and 175k in December. This compares to 491k and 448k in TYX and TYZ puts. The large recent buys in FV puts have not yet kicked open interest into high gear, as the year ago buys in blue March midcurves did, but I expect more action this week.
Here’s a big headline from Bloomberg on Sunday:
Tapering Doesn’t Mean Tightening for Central Bank Money Printers
That’s the Fed spin. The guy loading up on FV puts isn’t buying it.
OTHER MARKET THOUGHTS/ TRADES
Treasury auctions 2, 5 and 7 year notes this week starting Monday (2s & 5s) and ending Tuesday (7s) in size of $60, 61 and 62 billion.
PCE Core Deflator is Friday, 3.6% last, expected 3.5%.
The Fed’s Z.1 quarterly report was released last week. From Credit Bubble Bulletin:
Meanwhile, Household Financial Asset holdings are inflating wildly. Household Assets jumped $4.552 TN during the quarter to a record $113.149 TN, having more than doubled from 2009 trough $46.780 TN – as well as previous cycle peak $54.377 TN (Q3 ’07). Household Financial Assets to GDP ended Q2 at a record 498%, up from cycle peaks 374% (Q3 ’07) and 354% (Q1 2000).
Household financial assets 5x larger than GDP!! Ever hear of the wealth effect?
| 9/17/2021 | 9/17/2021 | chg | ||
| UST 2Y | 22.4 | 27.2 | 4.8 | w/I 30/29.5 |
| UST 5Y | 86.5 | 95.5 | 9.0 | w/I 97.5/97 |
| UST 10Y | 136.8 | 145.8 | 9.0 | |
| UST 30Y | 190.8 | 198.5 | 7.7 | |
| GERM 2Y | -69.5 | -68.6 | 0.9 | |
| GERM 10Y | -28.0 | -22.8 | 5.2 | |
| JPN 30Y | 65.2 | 67.4 | 2.2 | |
| CHINA 10Y | 287.9 | 286.9 | -1.0 | |
| EURO$ Z1/Z2 | 26.0 | 33.5 | 7.5 | |
| EURO$ Z2/Z3 | 63.5 | 65.5 | 2.0 | |
| EURO$ Z3/Z4 | 41.0 | 41.5 | 0.5 | |
| EUR | 117.29 | 117.21 | -0.08 | |
| CRUDE (active) | 71.82 | 73.98 | 2.16 | |
| SPX | 4432.99 | 4455.48 | 22.49 | 0.5% |
| VIX | 20.81 | 17.75 | -3.06 | |
In: Eurodollar Options
I’ll let my money do the work
September 24, 2021
–Rates took a powerful jump yesterday (as did stock futures), with tens up 8.2 bps to 1.406% as the FOMC was digested and BOE tilted hawkish. The main steepening took place in the front end of the curve where all near euro$ one-yr calendars made new recent highs. EDZ’21/EDZ’22 gained 2.5 to 31, having been hovering right around 1/4% prior to the FOMC. The peak 1-yr spread on the curve is still EDU’22/EDU23 which jumped 3.5 to a new high of 71.0; previously the upper end of the longer term range had been 68. On a side note, short sterling Dec’21/Dec’22 surged 7 bps to 55.5. Even 2/10 treasury spread squeaked to a new (minor) recent high of 115 bps. There was a little bit of buying of front libor puts: new buys of about 20k each EDX1 9975p for 0.75 and EDZ1 9968.75 put for 0.75 (both settled 0.75 vs EDZ1 9981.0). These buys are relics of the past, when credit concerns sparked panicked insurance buys on the front end as libor might violently adjust higher. Now, news that Evergrande isn’t paying its obligations to off-shore creditors is barely met with a shrug. Contagion is contained by our helpful central bankers. For example, the FOMC at this meeting doubled the repo counterparty cap to $160 billion, implemented to smooth money markets as t-bills covering debt-limit limbo are shunned in favor of repo. And where else can we see the Fed’s gentle footprints? Here are a few Z.1 Net Worth highlight for Q2:
U.S. HOUSEHOLD NET WORTH ROSE TO RECORD $141.7 TRLN IN Q2 2021 VS. $135.8 TRLN IN Q1 AND FROM $118.5 TRLN A YEAR EARLIER, FEDERAL RESERVE SAYS IN QUARTERLY REPORT
– STOCK MARKET GAINS ADDED $3.5 TRLN TO U.S. HOUSEHOLD NET WORTH IN Q2; REAL ESTATE ADDED ABOUT $1.2 TRLN, FED SAYS
– HOUSEHOLD DEBT GREW AT 7.9% ANNUALIZED RATE IN Q2 VS. 6.7% IN Q1, FED SAYS
– FEDERAL GOVERNMENT DEBT GREW AT 9.6% ANNUALIZED RATE IN Q2 VS 9.0% IN Q1, FED SAYS
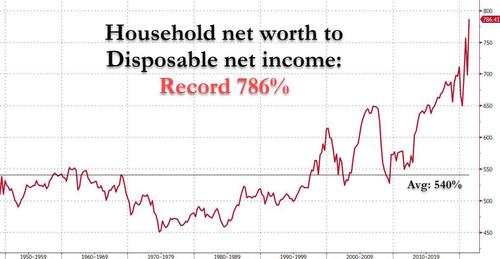
An article on ZH points out that the ratio of Household Net Worth to Disposable Net Income surged to a grotesque 786%. This ratio has averaged 540%. Link below, worth a quick skim.
–So, HH net worth rose $23.2 trillion on the year. That’s GDP. Essentially the same number. (if my investments are making as much as my ‘income’ then why work?) The $3.5 trillion spending package? Why that’s equal to stock market gains for the 2nd quarter. I’m no expert, but Fed’l gov’t debt growth of 9 to 9.6% almost has to be inflationary; if that particular plate stops spinning then “transitory” will have turned out to be exactly correct, because we’ll all be victims of a reverse wealth-effect steamroller.
–Open interest in FV futures rose 39k and in TY up 54k. Fear is returning to the downside, but there was NOT a significant reach for puts…YET. October options expire in treasuries today, so there were clearly some gamma issues, as evidenced by the late day puke in futures from a settlement of 132-12 in TYZ to 132-05 prior to the end of the session. At yesterday’s close TYV 132.5p have 51k open (14s) and 132 puts have 74k open (3s).
https://www.zerohedge.com/markets/has-be-mistake
In: Eurodollar Options
Stretching out transitory
Sept 23, 2021
–Really? PCE Inflation was for 2021 was forced to reflect the realities on the ground in the SEP, moving from 3.4% to 4.2%, up EIGHT tenths. However, the projection for 2022 was only moved up 1 tenth, from 2.1 to 2.2%. This, despite the fact that shelter inflation hasn’t really fed through the data yet. Additionally, during the press conference, Powell said that bottlenecks were lasting longer than expected. Of course the dots moved up. Currently in 2022 there are as many members expecting one hike in 2022 as there are expecting to hold pat. In 2023 it’s more interesting; in June it was for 2 to 3 hikes, but in September there were 6 dots 1.0/1.25% or 100 bps higher than the current target. In any case green eurodollars bore the brunt of the selling (EDZ3, H4, M4 were weakest on the strip at -8 bps), while in treasuries it was the five year which rose a bit over 3 bps to 0.86%. Tens were essentially unchanged at 1.324%. 5/30 posted a new low at 98.5 bps, down just over 4 on the day.
–No matter when taper actually starts, Powell seems rather confident it will end in the middle of next year. He said he does NOT need to see a blockbuster employment report for taper conditions to be met, just a reasonably good report, and noted that many members think that conditions have already been met for taper. However, he is setting a much higher bar for “rate liftoff” conditions.
–Quite a stark contrast between a Powell press conference, where the Chairman easily answers all questions and Biden’s pressers.
In: Eurodollar Options
Fed day
Sept 22, 2021
–Fed announcement and economic projections, followed by press conference. In 2018, the Fed was both hiking and trimming the size of the balance sheet, a state of affairs that eventually resulted in a hard tumble in equities starting in October 2018 and going through the rest of the year. Now, the Fed’s actions have arguably helped push stocks to new highs with stretched valuations. Some think that Evergrande’s problems will keep the Fed from moving ahead with tapering, but remember, this taper is not shrinking the size of the Fed’s balance sheet, only slowing the growth. With respect to Evergrande, it’s worth noting that in 2008, from May to June EEM fell 80% from 51.50 to 19.19. Over that same approx time frame HYG fell 36%. In the brief Feb to March 2020 Covid plunge, EEM fell 33% and HYG 23%. In the current case, when EVERYONE already knows about Evergrande, from the June high EEM is down 10% and HYG around 1%. The market is looking past the problem, even though I think it will have future reverberations. The Fed should go ahead with taper plans now. By the way, in September of 2015 when the Fed delayed the first hike, EEM had traded from 44 to 31, one of the reasons the Fed waited for December to start. But EEM was still in the low 30’s when the Fed DID initiate the first hike in Dec 2015.
–Seller of about 30k EDZ1/EDH2 yesterday just looks like a roll out of Dec longs into March. There had been an exit seller of about 30k 3EV 9850 puts over the last couple of days at 5 to 5.5, but yesterday a buyer of 60k 3EV 9837.5p for 2.5 (appears new) settled 2.75 vs 9857.0. Ten year yield up 1.6 yesterday to 1.323%. 5/30 ended the day just under 103 bps.
In: Eurodollar Options
Forced short-cover in treasuries as equities swoon
Sept 21, 2021
–Concerns about Evergrande contagion and the FOMC caused SPX to decline 1.7% and Nasdaq -2.2%. Interest rate futures rallied and the curve flattened. Tens fell 6 bps to 1.307%. In dollars, whites +0.375, reds +3, greens +5.75, blues +7.125 and golds +7.5. While ED open interest was modestly higher, every treasury future except the two-year saw declines in open interest as shorts were forced to re-evaluate in the face of equity weakness. Most notably, FV open interest declined by 23.5k and TY by 59k. October options expire on Friday, and TYV 133.5/134 call spread which was originally bought for 10, settled at 9 vs 133-085.
–Eurodollar options fairly quiet, though there was an exit sale of 20k 3EV 9850p at 5.0 to 5.5. (Settled 5.5 vs 9858 in EDZ4, options expire 15-Oct). There was also small buying of EDZ1 9975p for 1.0. However, in spite of possible credit issues associated with China, 3m libor is anchored at 12.5 bps, so a buy of puts with a 25 bp strike almost seems misguided…that’s what is has come to.
–New low in 5/30 just under 103 bps. The pressure is apparent in front of FOMC tomorrow. Equities and oil bouncing this morning…
In: Eurodollar Options
Slo-mo contagion
Sept 20, 2021
–Hey! ever hear of Evergrande? Of course it’s been in the news for some time, and I believe well known that it was going to miss payments this week, but the realities have now tumbled into global stocks. Along with the idea of a Fed taper.
–On Friday, SPX and Nasdaq were down 0.9%, but rates also moved higher, with tens up 3.7 bps to 1.368%. The eurodollar curve steepened: whites, unch; reds, -1.5; greens -4.125; blues, -5.25; and golds -6.25. One-year calendars from reds to greens (2nd to third year) made recent new highs. EDU’22/EDU’23 which is the peak one-yr calendar rose 2.5 to 66.5 – attempting to break out to new highs. Alas, those moves have been erased this morning with the wobbles in global equities. For example, Hang Seng down 3.3%. As of now ESZ is down 61.75 or 1.4% to 4360.00. Does a stock rout push the taper out into the future? That’s the bet. The Fed has made the US economy so dependent on the prices of financial assets, that a few percent off of all-time-highs is seen as a disaster. LET’S FIX IT.
–Big trade on Friday was +50k FVX1 123.0p for 17. Settled 16.5 with 38 delta vs 123-09 in FVZ1. Seems like a taper hedge. Powell may want to separate the idea of a taper leading to rate hikes, but the market has a hard time with that.
–Crypto showing cracks as well, with bitcoin down 7% and ether -8%. With natgas and coal off to the moon, the realization that crypto relies on cheap electricity may become more of an issue.
In: Eurodollar Options
FOMC projections
September 19, 2021 -Weekly Comment
A Sunday headline on WSJ.com: Junk-Debt Sales Soar Toward Record Year.
The $3 trillion market for low-rated companies’ debt is having its best year ever, powered by a rebounding economy and investors’ demand for any extra yield.
Real yields on both US and European junk are negative. The obvious incentive is to borrow as much as possible. And they are. It’s obvious to the Fed as members convene for the FOMC. Of course, the reason for negative real yields is because inflation has surged. It’s somewhat interesting to visit the websites of the regional banks and look at their measures of inflation, which I summarize below. First though, a few words on the dots.
In March of this year, 14 participants expected rates to stay 0-0.25 through 2022. Three expected 1 hike and one expected 2 hikes. Median PCE inflation and Core projections were both 2.0%. For the year 2023, eleven members still expected 0-0.25%, and seven members expected at least one hike, with two members looking for a target of 1.00-1.25%. That’s with a median inflation expectation of 2.1%.
At the June Summary of Projections, in 2022, the number of members expecting a hike went from 4 to 7, with two members now at 0.5-0.625%. For 2023, the number expecting no hike went from eleven down to five, with thirteen looking for 1 to 6 hikes of 25 bps. The 2023 inflation expectation was only moved 1/10th higher to 2.2% for 2023, with Core unch’d at 2.1%. A BBG article (Stymied Bond Bears…) notes it will only take three members to raise their unchanged dots for 2022 for a full hike to be the median for next year. That would align perfectly with the Eurodollar curve: EDZ’21/EDZ’22 is 26 bps, unchanged from last week. For 2023, three members expected 2 hikes, three expected 3, three were at 4 and two were at 6. It’s fair to say that the dispersion spooked the market and resulted in a much flatter curve, with 5/30 imploding from 140 to 113.5 in a few days. Going into this week’s FOMC, 5/30 is even lower, at 104. In terms of the 2023 dots, if anything the market is a little bit BEHIND the Fed. EDZ’22/EDZ’23 is 63.5. After adjusting for the libor transition, which occurs at the end of June’23, that’s about 2 hikes. The average of the 18 dots in June for 2023 was 69 bps, slightly over two hikes. At this SEP, the dots will surely move higher again, because inflation estimates will have to be acknowledged higher.
Let’s take a look at some of the regional Fed inflation data:
From NY Fed: Both median year-ahead inflation expectations and the three-year horizon increased by 0.3 in August, to 5.2% and 4%, both series highs. (Sept 13)
Atlanta Fed: Year-ahead Business Inflation Expectations 3.1% [new high]
Sticky Prices +2.6%. “The flexible cut of the CPI-a weighted basket of items that change price relatively frequently- increased 6.3% (annualized) in August and is up 13.7% yoy.”
SanFran Fed: Cyclical Inflation 3.55%. Acyclical inflation 3.71% [this latter series avg’d about 1% from 2014 to 2020]
Cleveland has an interesting Inflation NowCasting chart for Q3 2021: CPI 6.56%, Core 5.47%, PCE 4.87% and Core PCE 4.12%.

Richmond Fed Mfg Survey (Aug 24). Prices paid 11.05 [was 4.91 in Feb]. Prices rec’d 9.25 [was 2.90 in Feb]
Perhaps the most useful (though somewhat stifled) survey comes from the Philly Fed which prints the Aruoba Term Structure of Inflation Expectations from three to 120 months ahead. The August release shows near term expectations at 2.3%, and out to ten years, 2.26%. “The ATSIX is created by using a factor model to optimally combine major surveys – the Survey of Professional Forecasters published by the Philly Fed and the Blue Chip Economic Indicators and Financial Forecasts published by Wolters Kluwer Law & Business – using a methodology in Aruoba (2016).”
The other regional banks don’t offer much different. The point is that Fed Presidents should probably rely heavily on the staffs in their own banks for inflation projections. I didn’t see anything on regional websites that can justify a “longer run” SEP inflation estimate of 2.0% or a 2023 print of less than 2.3%.
Therefore, dots and economic projections must both be set higher. Which of course, argues for getting on with the taper. Even with Friday’s pullback, BBG Commodity Index is up 37% annualized in 2021. The spot Base Metals index is up 42% on an annualized basis. The BBG Energy sub-index Is up 100% annualized. It all makes the annualized 26% gain for SPX look tame.
While the tentative first hike of the last cycle was in 2015, there was a long pause before the more concerted two-year campaign from 2017 to the end of 2018. 5/30 began 2017 right around current levels at 110, but had moved to a low of 21.5 by the middle of 2018. Over this period, the thirty year yield ranged from 2.70% to 3.25%, eventually topping at 3.45%. It’s now 1.91%. Over that period inflation (CPI) ranged from 1.65% to 2.945%. It’s now 5.3%. In 2017/18 the bond yield was always greater than CPI.
I think the Fed will announce the onset of tapering at this meeting, to begin in November with an implementation note. There has been ample preparation. Even though the market believes hiking will quickly follow the taper, the Eurodollar curve is not aggressively priced that way. In fact while the red pack to green pack settled 58.25 on Friday, around 2 hikes, the green to blue pack settled at only 32.375. (Red pack is EDZ’22 thru EDU’23, Green pack EDZ’23 thru EDU’24, Blue pack EDZ’24 thru EDU’25).
My bias is for all rates to adjust higher. I believe the rate market will take taper in stride; that equities will be more likely to reflect the marginal withdrawal of liquidity. I think 5/30 will flatten a bit further, holding in the low 90’s, but that steepening will occur on the dollar curve from EDU’23 back. That is, green/blue pack sub-33 is too low and blue/gold at 20 is also too low. Powell will go to great lengths to counter the idea of hikes immediately following the end of taper, regardless of the dots. The current shape of the curve indicates he has been successful so far in that effort. But he may ultimately be much less successful on the ‘inflation is transitory’ mantra.
The FOMC announcement and press conference is Wednesday. The Fed’s quarterly Z.1 report comes out Friday for Q2, which is a nice punctuation point to indicate how much Household Net Worth (especially at the top) has swelled as a result of Fed and fiscal largesse. In Q2 SPX up 8% or 36% annualized, while the White House notes, “…over the last 12 months, the Case-Shiller US Nat’l Home Price index has risen 18.6%, the strongest year-long growth in the history of the series.”
OTHER MARKET THOUGHTS/ TRADES
There’s some pretty chunky FV put positions, as evidenced by Friday’s purchase of 50k FVX1 123.0p for 17/64’s. This is a 40 delta put; settled 16.5 vs 123-09. Works out to about $1m DV01. Breakeven is 122-23+ which is about 10 bps higher; current 5y cash is 86.5 bps.
October treasury options expire Friday. In TY, the peak call positions are 133.5c and 134c with 76.6k and 85.6k. Open interest In both fell heavily on Friday as the long 133.5/134c spread that had originally been bought for 10 was partially liquidated; call spread settled 3. On the put side peak open interest is TYV 132.5p at 83.8k and TYV 132p at 97k. Settles 13 and 5. Ought to be some gravitational pull to the 132.5 strike.
I know nothing of NatGas production, demand, or storage. However, the March’22/April’22 NatGas calendar spread is quite interesting. A chart is below. Jan/Feb’22 is 0.084, Feb/Mar’22 is 0.342. Then Mar/Apr’22 is 1.199 ! with Apr/May’22 back to 0.127. Dec’21, Jan’22 and Feb’22 contracts are all over 5.25 while April falls back to 3.703. This has been a huge rally in NatGas. Hoping it’s not a cold winter because the cost of home heating is going to really hammer the lower end of the household sector.

| 9/10/2021 | 9/17/2021 | chg | ||
| UST 2Y | 21.5 | 22.4 | 0.9 | |
| UST 5Y | 81.4 | 86.5 | 5.1 | |
| UST 10Y | 133.9 | 136.8 | 2.9 | |
| UST 30Y | 193.2 | 190.8 | -2.4 | |
| GERM 2Y | -70.4 | -69.5 | 0.9 | |
| GERM 10Y | -33.0 | -28.0 | 5.0 | |
| JPN 30Y | 65.6 | 65.2 | -0.4 | |
| CHINA 10Y | 287.1 | 287.9 | 0.8 | |
| EURO$ Z1/Z2 | 26.0 | 26.0 | 0.0 | |
| EURO$ Z2/Z3 | 57.5 | 63.5 | 6.0 | |
| EURO$ Z3/Z4 | 38.5 | 41.0 | 2.5 | |
| EUR | 118.11 | 117.29 | -0.82 | |
| CRUDE (active) | 69.47 | 71.82 | 2.35 | |
| SPX | 4458.58 | 4432.99 | -25.59 | -0.6% |
| VIX | 20.95 | 20.81 | -0.14 | |
In: Eurodollar Options

