
China Schools ‘For-Profit’ Tutors
July 26, 2021
–Today’s newsclips seem to be focused on the regulatory situation in China, where a new crackdown on “for-profit” educational firms is spilling over into broader selling. The larger US universities with massive endowment funds are nervously shifting on their feet… In any case, Hang Seng fell 4% and CSI300 fell 3.2%. China’s previous moves against Ant Group and Didi, along with a clampdown on speculative lending may have just been the start of a broader campaign. China Evergrande Group is down over 7.5% today.
–Unsurprisingly, bitcoin is being bolstered by uncertainty elsewhere and is over 38k, while gold is seeing relatively modest support, GCZ +6.6 at 1812.50. Grains are a bit lower, though an article on ZH outlining unusual weather patterns highlights a risk to global food security: “Things that are happening in one part of the world end up impacting all of us,” said Agnes Kalibata, a United Nations special envoy for the 2021 Food Systems Summit and Rwanda’s former agriculture minister. “We’ve underestimated as a world is just how frequently” weather could seriously disrupt the global food system.
–Yields are lower this morning. Tens ended up 2.2 bps on Friday at 1.285%, and are now nearly 4 lower than Friday’s close, at 1.246%. The event of the week is Wednesday’s FOMC announcement and press conference. Today we have an auction of 2yr notes and TSLA reports. Other major tech results also occur this week, including AAPL, GOOGL and MSFT tomorrow.
Borrow and Invest
July 25, 2021 – Weekly Comment
Coffee prices exploded higher last week on a frost in Brazil. On June 30, KCU1 settled 159.75. On Friday, the high was 209.50, with a settlement at 189.00. I was chatting with a friend in NY about this price action, and he mentioned that his daily afternoon latte was running $6.77 with tax and tip. I don’t know how much of that is the price of coffee beans, but I did mention that at a 30-year mortgage rate of 2.75%, that expenditure of around $140/month would cover $35,000 of a mortgage. Which is enough to buy this 1.3 acre lot in Prairie du Chien, WI, where you can build your dream cabin off the grid. And get a dog. And chat with Floyd down at the barbershop. And Juanita at the coffee shop.
https://www.realtor.com/realestateandhomes-detail/Velvet-Ln_Prairie-Du-Chien_WI_53821_M74635-06979
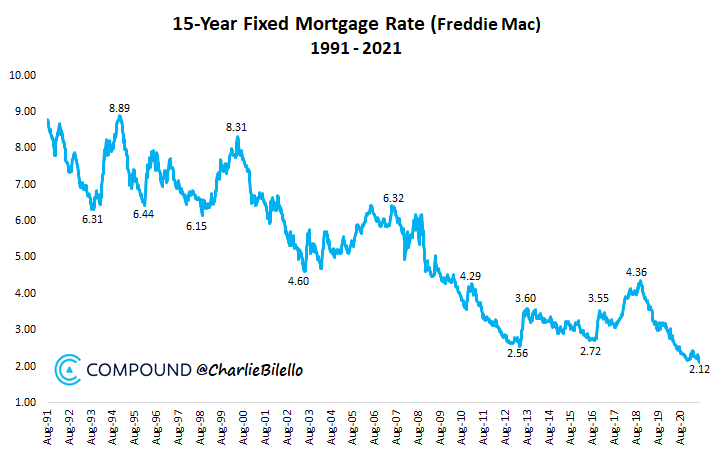
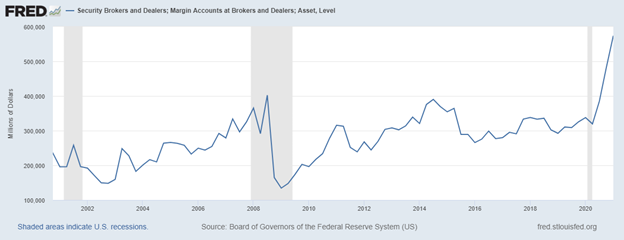
Here’s a chart of the 15 year mortgage rate. It’s difficult to understand why the Fed continues to buy $40 billion per month in MBS, but it’s easy to see why real estate values are levitating. The FOMC meeting this week (announcement and press conference on Wednesday) will consider trimming the pace of asset purchases. Of course, the balance sheet will still be growing, unlike the episode in 2018 when the balance sheet level actually declined until the infamous Q4 2018 stock market sell-off caused an embarrassing re-think. For now, the music is playing, and it is compelling to be a borrower and ‘investor’ of sorts. A headline in the FT says “Combined value of loans made by wealth management units at top US banks in the second quarter exceeds $600bn.” I’m not sure when ‘wealth management’ units rally started proliferating, but I would bet their rise correlates strongly with Fed accommodation. In any case, while the Fed’s stated purpose in keeping funding rates at zero is to regain maximum employment (with an unemployment rate of 3.5%), the subtext is “ADD LEVERAGE”. That message has been clearly embraced by margin investors as the chart below on “Margin Accounts at Brokers and Dealers” shows. In 2018 Margin accounts were about $330 billion. In the aftermath of Covid they have surged to $580 billion.
It’s no wonder that the Fed wants to tiptoe very gently into discussions of removing accommodation, because if their actions have juiced asset values, then the reaction to any sort of restraint could pose problems. Already there are signs of trepidation. While MSFT and FB surged to new highs at the end of last week, a Reuters article notes: “Fewer than half of the stocks in the S&P recently traded above their 50-day moving averages even as the index has been at or near new highs, compared to over 90% in April, a sign that ‘what is happening beneath the surface is at odds with the picture of strength that is portrayed if one just looks at the popular averages,’ according to Willie Delwiche…”
Of course, this week it’s about the titans. Earnings reports:
Monday: TSLA
Tuesday: AAPL, GOOGL, MSFT, V
Wednesday: FB
Thursday: AMZN
Friday: XOM
I would note that Visa (V) also surged at the end of last week to a new all-time high close. It’s also worth mention that AAPL, AMZN, GOOGL, FB and MSFT make up 1/4 of the S&P 500 market cap. FB now sports a market cap above $1 trillion for the first time! Exxon, on the other hand, trades below the 50 and 100 DMAs and, as of Friday, is nearly 12% off the high price set in June.
I do hold the view that commodity prices are indicative of inflation, whether one looks at coffee, oats, natural gas, crude oil, soybean oil, coal, etc. However, I can also accept the transitory argument, in part because the rate of change in the prices of a lot of commodities which have surged will almost inevitably slow. Over the medium term, the data is likely to reflect higher inflation from rents. And, as Mohamed El-Erian said in an interview on Friday, the Fed does not seem to appreciate what is happening at the “company level”, where many companies have raised prices and seen them stick and now intend to boost prices further. On the disconnect with bond prices, he said one must respect the fact that a completely price-insensitive buyer of $120 billion per month is holding yields down.
OTHER MARKET THOUGHTS/TRADES
On the week, the US ten-year yield fell 1.4 bps to 128.5, while fives fell just over 6 bps to 71.7. This week Treasury auctions 2, 5 and 7 year notes on Monday, Tuesday and Thursday, with the FOMC outcome on Wednesday.
Last week I suggested fading the flattening from greens to blues, and looked at an idea like selling 2EZ 9850/9825ps (2.75s) vs buy 3EZ 9825/9800ps (4.25s). This settled 1.5 vs 9909.0 in EDZ3 and 3.75 vs 9871.5 in EDZ4. In fact, EDZ23/EDZ24 spread actually rallied from 33.5 to 37.5 on the week, while the one-year spread in front, EDZ22/EDZ23 declined from 56 to 48.5. On the week there was consistent buying of blue midcurve puts. As an example, 3EZ1 9837.5 puts added 70k in open interest on outright buying from 9.5 to 12.0; settled 10.25 ref 9871.5 in EDZ’24.
While my idea last week of selling EDZ3 at 9898.5 was an instantaneous loser on Monday, the more risk averse way to play for back end steepening by buying midcurve puts remains a valid strategy. Powell is likely to maintain his accommodative rhetoric at the press conference. It was after the June FOMC with it’s surprisingly hawkish dot plot that accentuated flattening from greens back, as the Eurodollar curve moved forward the perception of rate hike prospects by shifting selling pressure to the last reds and greens as opposed to further out blues and golds. There is no do plot this time; that only occurs at quarterly meetings. If Powell doubles down on accommodative talk, back end spreads will likely steepen again.
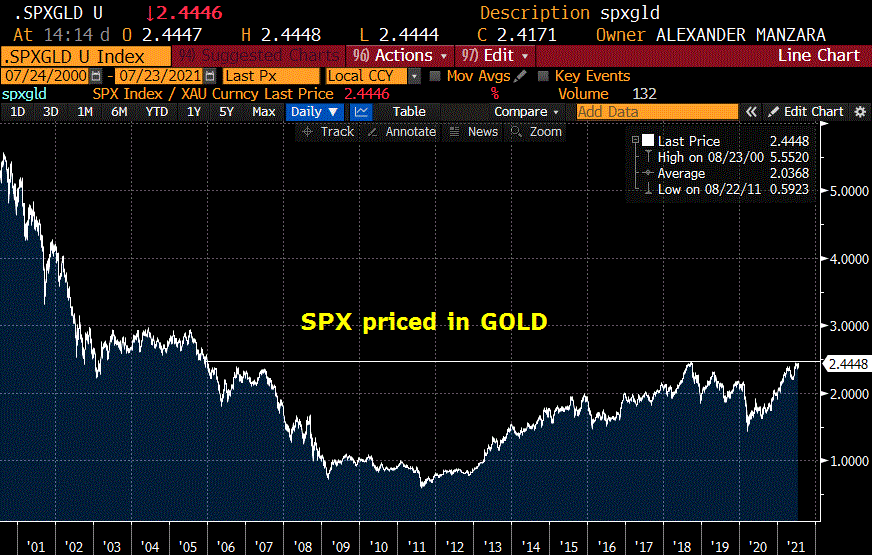
Gold has been rangebound this year and is pretty much at the midpoint between 1700 and 1900. It seems to have lost its safety bid. The chart above shows SPX priced in gold, with this area being important in terms of a possible upside breakout. A failure in stocks, perhaps due to earnings disappointments, may restore relative luster to gold.
| 7/16/2021 | 7/23/2021 | chg | ||
| UST 2Y | 22.4 | 19.8 | -2.6 | w/I 21.7 |
| UST 5Y | 77.8 | 71.7 | -6.1 | w/I 73.2 |
| UST 10Y | 129.9 | 128.5 | -1.4 | |
| UST 30Y | 193.1 | 192.4 | -0.7 | |
| GERM 2Y | -68.4 | -72.5 | -4.1 | |
| GERM 10Y | -35.3 | -42.0 | -6.7 | |
| JPN 30Y | 64.0 | 65.4 | 1.4 | |
| CHINA 10Y | 294.8 | 291.2 | -3.6 | |
| EURO$ U1/U2 | 20.0 | 16.5 | -3.5 | |
| EURO$ U2/U3 | 59.5 | 51.0 | -8.5 | |
| EURO$ U3/U4 | 37.5 | 39.0 | 1.5 | |
| EUR | 118.06 | 117.73 | -0.33 | |
| CRUDE (active) | 71.56 | 72.07 | 0.51 | |
| SPX | 4327.16 | 4411.79 | 84.63 | 2.0% |
| VIX | 18.45 | 17.20 | -1.25 | |
Flippers
July 23, 2021
–Yields edged slightly lower on a quiet day with tens ending at 1.263%, down 1.7. Eurodollar strip +0.5 to +1.5 out to golds. There continues to be large midcurve put buying. Yesterday, a block of 40k 2EZ 9850 puts for 3.0 covered 9910.5 was notable, though it appears to be an exit and part of a larger shift of strikes occurring in 2EZ puts. In any case, underlying EDZ’23 was the volume leader on the strip at 137k. The 3EZ put buys earlier in the week were more clearly bearish for the longer end of the curve.
–August treasury options expire today. TYQ 132.25 straddle settled exactly at 16/64’s with futures currently printing 134-02, or 14/64 intrinsic. With August expiring, more open interest should begin to build in Oct and Dec options.
–Wednesday brings the FOMC and tapering discussions. The Fed’s goal of putting everyone back to work is laudable, but it’s hard to understand how continuing to buy MBS helps. The more direct effect seems to be pricing buyers out of the market. This from ZH: “Those looking for signs of a new housing bubble need look no further than today’s existing home sales report which showed that median prices of existing homes in the US soared 24% to a record $363,300.” From an NBC news story: “My wife and I have been looking for a house for roughly the past year,” he said, adding that they have made multiple offers. “On each of those, we had contractors or investment groups outbidding us on the properties.” The title of that piece…”Who’s outbidding you on the home of your dreams? A hedge fund.”
–We’re all aware of the spectacular rise and fall of lumber, but I had never looked at coal until it was mentioned in the same article as coffee (which has exploded higher on frost in Brazil) by Cameron Crise of BBG. According to a chart on Trading Economics, Coal (XAL1) has gone from 50 in September to 150 this month. Burning coal produces electricity, which of course, provides power for green electric cars. Maybe it’s all related to the Fed PUMPING OUT TOO MUCH MONEY, which makes a lot of dumb ideas look pretty smart until the tide goes out.
Risk on
July 22, 2021
–Much of Monday’s extreme yield plunge and flattening reversed yesterday with the 10y yield up just over 6 bps to 1.28%. Red/gold euro$ pack spread rose over 6 bps to 1.04625. Downside in Eurodollar options dominated. Example, buyer added to 3EZ 9837.5 puts from 11 to 12 with EDZ4 trading down to 9871 (80k in two days, settled 10.5 vs 9872 in EDZ4). Also a buyer of 25k 3EZ 9812.5p/ 9925c risk rev for 2.0. Settled 2.5 for put. In treasury options, +10k TYU 133.5/132.5/131.5p fly for 9/64. Settled 9 vs 134-03+. There were more, but these represent shorts on longer maturities.
–Rumors about China property developer Evergrande swirled in the morning and are now on every news outlet as both its stock and bond prices have plunged. Total debt said to be greater than $200 billion, with ramifications on China’s broader property market. If it was the US, the financial authorities would make the maternalistic decision to inject more liquidity into the system to save the company and make sure that property investors don’t suffer any type of a drawdown. China may take a more capitalistic approach as they have tried to tamp down on excessive speculation.
–There are also articles about Powell having widespread political support within Biden’s team for a new term.
–Yesterday was risk-on in stocks and crypto, with stock index futures continuing to press higher, more than erasing the sharp drop from Friday-Monday. Covid variants may mean a return to masks, and that means more monetary accommodation. ECB this morning, already having articulated “forceful or persistent” support for the economy.
Long yields edge back up
July 21, 2021
–Early heavy selling in EDU1 (over 100k down to 9984.5; settled 85.5) helped front calendars settle at new recent lows. EDU21/EDU22 fell 2.5 to just 14.0, while EDZ21/EDZ22 dropped 3 to just 20.5. The reds were further supported by the exit of about 70k 0EU 9975/9962/9950 put flies sold at 2.5. However, longer end yields rose somewhat, rebounding from Monday’s plunge. Tens up 3.8 bps to 1.218% and bonds +6.3 to 1.878%. Today features a 20-yr bond auction by the treasury, which faces a hurdle given shrinking yields. The last 30-year auction went off at 2.00% and tailed about 2.3 bps which sparked a broader sell-off into the end of that day’s session. Bidding for 20’s might be a bit tentative today.
–On the dollar curve there was some notable midcurve put buying. 2EQ 9912.5p 5 paid for about 40k (settled 5 ref 9925 in EDU3). 2EU 9912.5/9900ps (3.25s) with 3EU 9875/9862ps (3.50s) 6.5 was paid in a roll-up of strikes about 40k. Later in the day, over 50k 3EZ 9837.5p bought for 9.5 (settled 9.0 vs 9881.5 in EDZ4). Net result was a bit of steepening from greens on back: greens (U3 to M4) +2.5, blues (U4 to M5) +0.75 and golds (U5 to M6) -1.75.
–I’ve attached a chart of Oats (thanks Pat Rooney for pointing out). While the July 4 BBQ might have been 16 cents cheaper on the year, breakfast seems to be a little more expensive. Coffee also surging. We lost the Mr Coffee brand but the Quaker Oats guy seems to be holding his own for now.


Yield implosion
July 20, 2021
–Yields plummeted as stocks wobbled, tens and thirties fell 12 bps to 1.18% and 1.815% respectively. This, as SPX eased 1.6% with Nasdaq down just slightly over 1%. I guess it’s due to the delta variant. All curve trades were obliterated, making new recent lows. 2/10 down 10.4 bps to 97. Red/gold eurodollar pack spread down just over 10.5 bps to 94.25. EDZ2/EDZ3 spread hit a recent high of 33.5, but closed down 6 at 23.5 (less than one hike). Financials were clobbered relative to the broader market as the curve flattened. XLF fell 2.8%. On the opposite end of the spectrum, Peloton rose 7% as the next covid inspired stimulus bill will have a provision paying for all indoor exercise programs. Of course that’s a joke. But really… PTON up 7% ?!?! We’ll only see later if Nancy Pelosi’s husband is long calls…
–Implied vol jumped to new recent highs, though it will probably deflate on this morning’s stock rebound. I marked TYU at 4.8. Not really panic levels, but certainly firm. New buyer of 60k 3EQ 9862.5p for 4.0 indicates that there are still some willing to fade the move (or perhaps trying to protect gains from longs). Settled 3.5 against underlying EDU’24 9888.0.
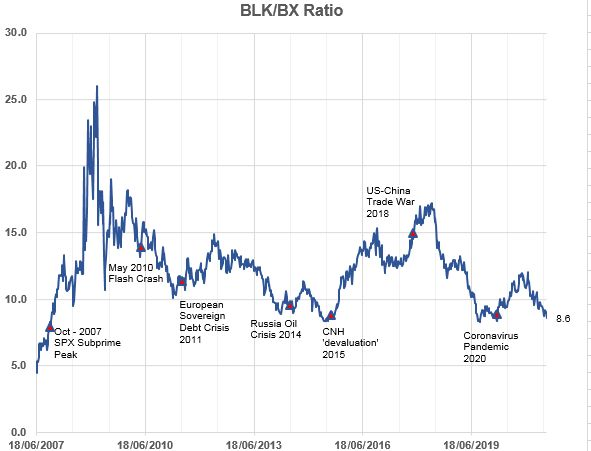
–I saw a rather interesting idea/chart on LinkedIn from Buena Patria, a ratio of BlackRock to Blackstone, the chart of which is attached. The idea is that BLK underperforms in times of financial stress; that with $9 T aum, and its deep ties to the Fed and administration, it is systemically important. Yesterday BLK was down 3.4%. BX was down 2.4%.
Another interesting clip (thanks YZ) shows the incredible consolidation in US banking. Which I suppose is another way of saying concentrated positions in credit markets that can overwhelm other factors. Flood these guys with reserves and leave funding rates at zero and I guess a bond rally is inevitable no matter where inflation prints. (I’m a little dismayed that one of my former employers, Manufacturers Hanover, didn’t even make the list). Russell Napier’s recent interview where he says the gov’t will force banks to hold down long rates and that the Fed becomes less relevant going forward makes sense in this context.
https://5minforecast-uploads.s3.amazonaws.com/wp-content/uploads/2021/07/Visual-Capalist-FULL.jpg

Starting the week risk-off
July 19, 2021
–SPX fell 75 bps Friday and Nasdaq down 80 bps, with follow through this morning. Rate futures are higher, with TYU above 134-00 with the cash yield nearing 1.25%, the lowest since mid-Feb. Then ten year yield moved from 50 bps in August (the low set just before the Fed changed its operating framework to FAIT) to 1.74% on March 31. It is now right around the 0.382 retracement (1.27%) with 0.50 being 1.125. It took eight months from low to high, and appears that it will be four months to retract half the move.
–Quiet week for news, mostly dominated by housing data. VIX options expire Wednesday, and July VIX has popped from 17.5 on Thursday’s close to nearly 20 this morning. Hi print in June is 22.25. Heavy pressure on Crude, with CLU1 down just over $2/bbl nearing 69.50.
–EDZ2/EDZ4 is down another 5 bps this morning to 84.5 with the red pack up only 2.5, but blues and golds printing +7.5 and +8.25.
Inflation and Interest Rates. Unrelated
July 18, 2021 – weekly comment
Here’s a nice summary of recent inflation data by CreditBubbleBulletin:
Consumer Prices (CPI) jumped 0.9% in June, versus expectations of a 0.5% increase. Year-over-year CPI was up 5.4% (expectations 4.9%), the strongest jump since 2008. And for analysts with issues with year-over-year “base-effects”, consumer inflation was up 3.3% in only five months. Core CPI also gained 0.9% for the month, with a 4.5% y-o-y increase. Producer Prices rose a data series record 7.3% y-o-y. Import Prices jumped 1% for the month and 11.2% y-o-y. University of Michigan one-year Inflation Expectations rose to 4.8%, the high since the summer of 2008. Also, at 4.8%, the New York Fed’s survey of one-year inflation expectations jumped to the highest level in data back to 2013.
Against this data we have the market’s reaction in rates: US tens down nearly 6 bps on the week to 1.30%. Bunds down 6 on the week to -35.3. EDZ’23/EDZ’24 one-year calendar down 6.5 bps on the week to 33.5. EDZ’22/EDZ’24 two-year calendar fell 5 bps to 89.5, the lowest settle since early February. The high was 137, set on the last day of Q1. This Z2/Z4 spread is interesting in that it has seen relatively heavy volume. Immediately after the FOMC in June it traded 118. Two weeks later on June 28, there was large new buying at 106.5 to 107. I had seen this bit of commentary at that time recommending the trade:
The EDZ2Z4 steepeners offer some asymmetry, in that there is limited scope to price in more hikes in 2022 given the compressed timelines. If economic data comes in strong, the Z2Z4 curve will steepen, led by EDZ4, as the market prices in faster pace of hikes in 2023 and 2024. On the other hand, if economic data is weak, EDZ2 can rally strongly, as the first order for the market will be to price out the aggressive path from tapering through to the first rate hike. EDZ2Z4 also offers an attractive entry level, as well as ~7bp rolldown over three months.
Steepeners have not worked. The highs in nearly all curve trades were on the last day of March. Since then it has been a grinding flattener, exacerbated on the back end of the curve by the hawkish dot plot of the June FOMC. On June 16, the date of the meeting, EDZ’23/EDZ’24 settled 55.5. It’s down nearly ¼ percent currently at 33.5. Similarly, 5/10 treasury spread was 80 on June 1 and is now 52. In spite of huge inflation prints, EDZ’24 has rallied from its low settle of 9807.5 on April 2, to 9863.0 as of Friday.
Obviously, the easy explanation is that the market has accepted Powell’s idea that inflation is most evident in sectors related to re-opening, and is therefore temporary, and that growth has likely peaked, especially as formidable fiscal spending tails off. Against this argument, one can easily point to factors in favor of more permanent inflation, including huge growth in monetary aggregates (which operate with a lag), investment in green energy which is likely to be more expensive than fossil fuels, redundant supply chains, and an increase in inflation expectations, a topic which Powell has repeatedly stressed in terms of holding down inflation.
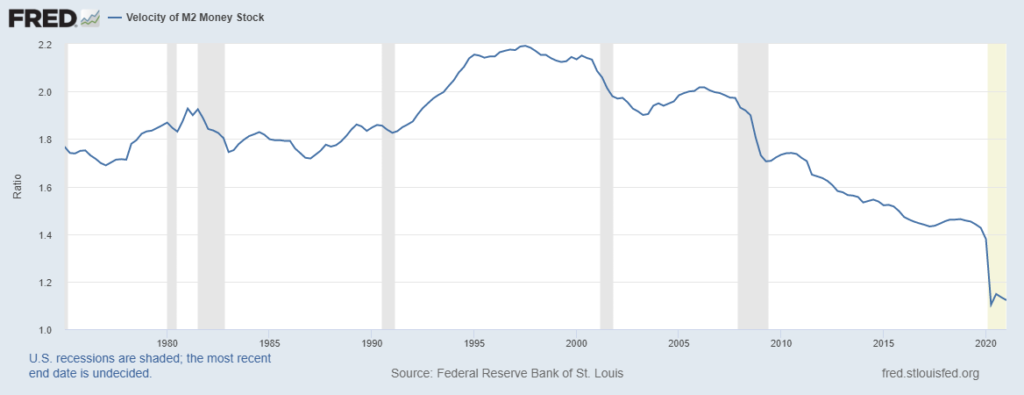
There’s a fascinating interview with Russell Napier in which he argues that governments are now in the business of financial repression, a slow transfer of wealth from savers to debtors. I have linked it below; his thesis is almost an exact counter to Lacy Hunt’s assertions that yields will always be forced down, in part because the velocity of money continues to trend lower.
https://themarket.ch/interview/russell-napier-we-are-entering-a-time-of-financial-repression-ld.4628
Here’s a small excerpt:
Velocity has been on a structural downward shift since 2009. Why?
If you look at US financial history, velocity was in a rather stable range above 1.6 from 1959 to 2009. The downward shift after 2009 was, in my view, the result of the Fed’s quantitative easing policy. With QE, the Fed bought financial assets in the market, and it basically bought them from savings institutions. The only thing these institutions could do with the newly created liquidity was to buy more savings assets. So the QE policy never reached the real economy, it never created broad money growth, it just pushed up asset prices. But now, with broad money created by the banking system, it will hit the real economy, therefore velocity will normalize.
I think the great surprise over the coming years will be when velocity goes back up towards 1.6. But forecasting velocity is fiendishly difficult. It’s like trying to juggle an incontinent squid: Something you really don’t want to do, and you’re very unlikely to be successful. The change in velocity downward after 2009 fooled everybody. Many people at the time said that QE must create inflation. But because velocity collapsed, there was no inflation. I think it will surprise on the upside this time. So while we can’t forecast velocity, we can put a risk to it, and I think the risk of velocity shooting up is higher than any time since the 1970s.
What will cause velocity to take off?
When people decide their savings can’t be sustained and do something with it. This will happen when the government starts to cap bond yields at a level permanently below inflation.
The interview continues [note that the US 10y TIP is negative 105 bps, closing in on the historic low this year of -111]:
Many people think yields will shoot up once central banks stop buying bonds.
Won’t they?
No, because then the government will force savings institutions to buy bonds. That’s stage two of bond yield control. Mind you, the transition from stage one to stage two won’t be smooth. Legislation will have to be passed to allow governments to in effect allocate private sector savings through greater control over regulated financial institutions. So there could be a period where bond yields rise too quickly and markets will panic. But ultimately governments will cap interest rates by using the savings system. Just like they did after World War II.
While there hasn’t been legislation to force banks to buy long duration assets, the extreme levels of excess reserves coupled with waning loan growth has banks upping their bid for long assets. Powell’s steadfast support of unprecedented accommodation in the face of rising inflation and asset price speculation is a form of repression. As tax revenues rise and government spending slows into the coming year, bond SUPPLY will actually begin to taper. At that point reduced buys by the Fed won’t make a difference.
Below is a chart of M2 Velocity, followed by yoy growth in Commercial and Industrial Loans. Loan growth exploded when COVID hit, as companies drew lines of credit. Now growth has fallen hard, probably due in part to forgiveness of government loans, another factor which creates a bid for long dated assets.

OTHER THOUGHTS
The week ahead will likely be a quiet one. Not much out in the way of news, and the Fed’s blackout period prior to the July 28 FOMC has commenced. On Wednesday, 20 year bonds are auctioned. On July 13, a sloppy 30 yr auction sparked a sell-off in USU from 162-24 to 161-06. However, that episode of questionable demand immediately faded as bonds rallied the rest of the week, with USU closing 163-26. The twenty-year auction could be an important test.
Dramatic flattening from greens to blue and greens to golds in the wake of the June FOMC is of interest as we draw nearer to the July FOMC. There are no economic projections at the July meeting, but there is clearly dissent between the board and several Fed Presidents. The most compelling trade in my opinion is a fade of the flattening. The question is one of timing. A more hawkish tone will likely enforce the trend of flattening which started at the beginning of Q2. However, we could easily see a capitulation trade, “buy the rumor sell the fact” where the curve re-steepens coming out of the meeting. Will add specific trade ideas next week.
In some ways, since the Fed’s risks to the economy and reason for continued accommodation were centered around COVID, they NEED the delta variant now to justify continued balance sheet expansion (even at a slower pace) and zero rate policies. If I know my Greek alphabet, variant epsilon and/or zeta are on the way.
| 7/9/2021 | 7/16/2021 | chg | ||
| UST 2Y | 21.3 | 22.4 | 1.1 | |
| UST 5Y | 78.6 | 77.8 | -0.8 | |
| UST 10Y | 135.8 | 129.9 | -5.9 | |
| UST 30Y | 198.3 | 193.1 | -5.2 | |
| GERM 2Y | -67.6 | -68.4 | -0.8 | |
| GERM 10Y | -29.3 | -35.3 | -6.0 | |
| JPN 30Y | 66.9 | 64.0 | -2.9 | |
| CHINA 10Y | 299.7 | 294.8 | -4.9 | |
| EURO$ U1/U2 | 19.5 | 20.0 | 0.5 | |
| EURO$ U2/U3 | 56.5 | 59.5 | 3.0 | |
| EURO$ U3/U4 | 42.5 | 37.5 | -5.0 | |
| EUR | 118.80 | 118.06 | -0.74 | |
| CRUDE (active) | 73.81 | 71.56 | -2.25 | |
| SPX | 4369.55 | 4327.16 | -42.39 | -1.0% |
| VIX | 16.18 | 18.45 | 2.27 | |
Flattening of back end continues
July 16, 2021
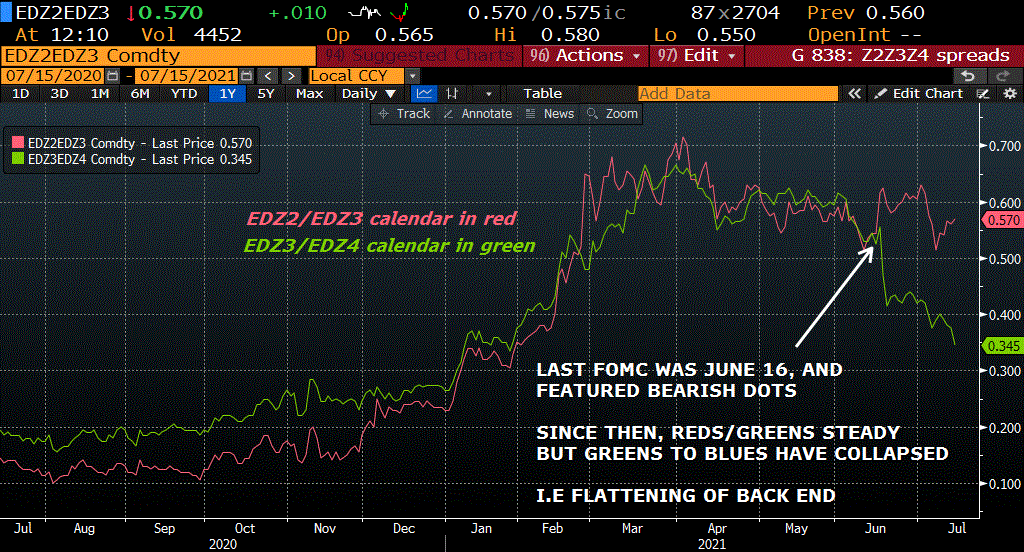
–Empire Mfg yesterday was 43.0, the highest ever. Import Prices were +11.2%, near the highest, although the oil surge in 2008 saw a print of +21.4. Though data isn’t uniformly strong, it is still surprising that yields were crushed yesterday, with tens down 5.7 bps to 1.297%. The curve flattened, with many measures making new recent lows. For example, 2/10 fell over 5 bps to 117.5. Red to gold euro$ pack spread (2nd to 5th year forward) imploded by 7 bps to settle at 104.25. As the attached chart shows, the June 16 FOMC with its hawkish dot plot was the unmistakable catalyst for back end flattening. On June 15, EDZ2/EDZ3 was 54.5. It settled 56.0 yesterday, essentially sideways. Further back, EDZ3/EDZ4 was 52.5 on June 15, it has now collapsed to a new low of 33.5. If rates were at a much higher base, I could understand the flattening, but not from these absolute levels given actual inflation. However, an interesting (brief) thread on twitter from Dave provides a bit of insight, noting that GSIB’s continue to buy longer dated assets to manage reserves and compensate for weak loan growth.
https://twitter.com/djr8519/status/1415809556618354699
In any case, while there are no projection materials at the July 28 FOMC, it’s completely plausible that there will be dissent. Will back end flattening have run its course by then?
–Today’s news includes Retail Sales, expected -0.3 (ex-auto and gas expected +0.6). All I can tell you for sure is that gasoline is taking a bigger bite out of the budget. U of Mich inflation expectations also released, but it’s clear that for now the data on prices is meaningless to the market.
–July option expiration in equities, carrying a small possibility that yesterday’s relative weakness in Nasdaq will be exacerbated.
Real yields deeply negative
July 15, 2021
–Powell remains all-in to bring employment level to “full”. He noted in testimony that official data underestimate unemployment. The dual mandate of low inflation and full employment with a backdrop of financial stability has been replaced by one goal, based on data that the Fed Chairman calls faulty. PPI yoy of 7.3% was ignored. There is a price-insensitive buyer of the long end, bringing the thirty year yield below its level before Tuesday’s auction. The auction yield was 2%; just prior the yield was 1.98% and yesterday at futures close it was 1.987, down 4.6 on the day and lower yet this morning, as China’s Q2 numbers were soft. I would put full employment in the 4 to 4.5% range, but I think the Chairman is shooting for 3.5. Full throttle accommodation will surely get push-back at the next FOMC, but that’s still two weeks away!
–On Tuesday there was a large seller of TYU 132.5/134.5 strangle at 49, which settled at 54 as bonds slid post-auction. However, vol was hit yesterday as higher yields were rejected, with the strangle settling 46 vs TYU settled very near the exact midpoint at 133-145. TYU vol at 4.0, the low end of the recent range. Prior to Powell, there was a buyer of 20k TYU 133/132p 1×2 for -1 to flat. Settled flat (36 and 18). Flows suggest a lull in activity for the next month and a half.
–As expected, Bank of Canada trimmed bond buying to C$2 billion per week. BA’s rallied. There was a new buyer of 50k EDM2 9975.5 which is where the contract settled, +3 on the day. If libor stays about where it is, just under 13 bps, then EDM2 should rally approx 1 bp per month. Gold is getting a boost, with GCQ 1833, having bounced about $70/oz from the low at the end of last month. I have attached a chart of the US ten-yr inflation indexed note yield, which closed below negative 100 bps for the first time since February. The St Louis Fed website has the low at -108 last year, though I recall seeing -112 last summer.

