
Transitory Intermediation*
Weekly comment – June 27, 2021
On Tuesday, Cleveland Fed President Loretta Mester gave a speech on monetary policy and financial stability. On Thursday, the Fed released its report that the banking system had passed stress tests without a problem. Here is a quote from Mester:
There are several avenues through which the use of nonconventional monetary policy might create or contribute to financial system vulnerabilities. A commitment to a protracted period of very low interest rates could encourage risk-taking as investors search for yield; it could lead to a build-up in leverage; and it could lead lenders to lower their credit standards and promote increased borrowing. While all of these are avenues through which monetary policy typically affects the economy, the concern is that these effects could be excessive and create or contribute to financial vulnerabilities.
We have record high stocks, a booming housing market, shortages of skilled labor, the lowest junk bond yields ever and a ten year yield that can’t seem to hold much above 1.5%. A BBG article notes a record amount of IPOs in the first half of 2021 of $350 billion, exceeding the previous record of $282b in the second half of last year. Any excesses here? You just might be on to something Loretta. From Thursday’s green light for bank buybacks: “The Federal Reserve Board on Thursday released the results of its annual bank stress tests, which showed that large banks continue to have strong capital levels and could continue lending to households and businesses during a severe recession.” I suppose that’s why the Fed had to create at least eight emergency lending facilities and Special Purpose Vehicles for COVID.
The Fed is so confident about the resiliency of the banking system and the US economy that they’re afraid to taper and move rates from zero. Of course, they would still have to check with Larry Fink first.
Later in her speech Mester mentions, “Nonbank financial intermediation, through investment funds, insurance companies, pension funds…has risen over time. These entities now hold almost half of global financial assets up from 42 pct in 2008. This means that credit risk is increasingly being intermediated and held outside the banking sector.”
It’s pretty easy to conclude there’s froth in markets. BBG has another weekend piece discussing a pivot from “Peak Central Bank Support” and notes Bank of Mexico’s surprise rate hike last week and China’s continuing efforts to control debt. Obviously the Fed is making some small steps in that direction, and the market has responded by moving up the timing of rate hikes. As an example, the peak one-year Eurodollar calendar spread is now EDU’22/EDU’23 at 64 bps. The highest one-yr spread settlement of this cycle has been EDM’23/EDM’24 which settled 78 on April 5. It’s not really the case that this latter spread reflected an expectation of three 25 bp hikes, and that’s because of the libor cessation at the end of June 2023. Spreads that encompass that event are higher due to the transition to SOFR. However, for this rough analysis, it doesn’t matter. The point is that since the April 5 high of 78, EDM’23/EDM’24 has tailed off to 59, while EDU’22/EDU’23 is only 4.5 bps off its high settle of 68.5 on April 2. Let’s look at a few spreads since the beginning of April, when they were at the highs. I’ll use December contracts, since the Fed’s FOMC projections are end-of-year. (Table below)
Near one-year spreads aren’t at the peak, but they are at new highs for the year. EDZ’21/Z’22 is now 33.5, having started the year at 5.0. The next spread is EDZ2/Z3 which again, covers the libor transition, but it’s down 10 from the high of 71.5 in April. EDZ3/Z4 has tumbled 21.5 bps, with about ten of that coming after the FOMC meeting.
| EDZ1/Z2 | EDZ2/Z3 | EDZ3/Z4 | EDZ4/Z5 | |
| 2-Apr-21 | 28.0 | 71.5 | 65.0 | 40.5 |
| 25-Jun-21 | 33.5 | 61.5 | 43.5 | 25.5 |
| change | 5.5 | -10.0 | -21.5 | -15.0 |
One could make the argument that these spreads paint the case for Powell’s transitory inflation argument, in that the flattening of the back half of the curve is because expected inflation by that time will be lower than now. However, the corollary is that the market perceives lower future inflation because the Fed will be tightening sooner. For example, Rosengren said conditions for a hike by the end of next year could be in place soon, echoing other officials. Now it’s all about data and a slow-play by the Fed.
These spreads tell you about market perceptions of hikes both by levels and direction. New highs in near spreads suggest the end of next year is lift-off. I had thought the market might be more forceful in making the point that the Fed was ‘behind the curve’, and that’s why I’ve favored buying short Dec midcurve put spreads with EDZ’22 as the underlying. Example, 0EZ 9937.5/9912.5ps settled 5.25 Friday but was around 3 the previous week. Because of the dynamics between inflation and possible Fed actions, I have leaned more towards simply buying back month puts rather than forecast timing with futures spreads. I like blue midcurve puts (on EDU’24, EDZ’24, EDH’25) because I think inflation data will continue to worsen over the next few months, but that Powell will continue to play it down.
*And what does transitory intermediation mean? Nothing. Just sounds good.
Now for a detour into current affairs. A huge fossilized skull was found in China, possibly representing a new branch of the family tree. He’s been dubbed ‘Dragon Man’. From The Guardian: “The skull, which is 23cm long and more than 15cm wide, is substantially larger than a modern human’s and has ample room… for a modern human brain. Beneath the thick brow ridge, the face has large square eye sockets, but is delicate despite its size. “This guy had a huge head” said Stringer.
There was a broker on the trading floor, (and anyone who worked on the floor knows what’s coming next) who had a substantial head. The question, which was somewhat more worthy of serious consideration than other hypotheticals, was, “Would you rather have this guy’s head full of nickels, or a million dollars?” If Dragon Man had been discovered in those days, a broker would have sent a runner out to go buy a taper measure… “and make sure it has centimeters on it.”
OTHER MARKET THOUGHTS/TRADES
On Wednesday we have ADP, on Thursday ISM Mfg and on Friday, the employment report. Nonfarms are expected 700k which would be the highest level of the year excluding the March release of 785k. The CME has a full electronic session and a half day on Monday. Given a somewhat bearish response to Friday’s PCE price data, I think robust payroll numbers could really stick a fork in the bond market, especially in a thinly traded afternoon when most people leave early for holiday plans. I would consider buying week-2 (July 9th) US 155p for 5/64’s, which is where they settled vs 158-54. The low in the contract in May was 153-29, though the front June contract low at the time was 155-14. There is a minor trendline that come in around 156-00. This isn’t about targeting a particular level, it’s about the chance of a higher than expected number blowing up the market in thin conditions.
| 6/18/2021 | 6/25/2021 | chg | ||
| UST 2Y | 25.8 | 26.8 | 1.0 | |
| UST 5Y | 88.9 | 92.9 | 4.0 | |
| UST 10Y | 145.3 | 153.4 | 8.1 | |
| UST 30Y | 202.5 | 217.0 | 14.5 | |
| GERM 2Y | -66.6 | -64.7 | 1.9 | |
| GERM 10Y | -20.0 | -15.5 | 4.5 | |
| JPN 30Y | 67.4 | 67.4 | 0.0 | |
| CHINA 10Y | 314.2 | 309.8 | -4.4 | |
| EURO$ U1/U2 | 24.0 | 24.5 | 0.5 | |
| EURO$ U2/U3 | 61.5 | 64.0 | 2.5 | |
| EURO$ U3/U4 | 44.0 | 47.5 | 3.5 | |
| EUR | 118.64 | 119.38 | 0.74 | |
| CRUDE (active) | 71.29 | 74.05 | 2.76 | |
| SPX | 4166.45 | 4280.70 | 114.25 | 2.7% |
| VIX | 20.70 | 15.62 | -5.08 | |
Market already prices Bostic’s thoughts
June 25, 2021
–Today PCE deflator is released, the Fed’s preferred inflation measure. Year over year expected +3.9% from 3.6% last. YOY Core expected 3.4 from 3.1 last, levels which haven’t been seen since 1992.
–The infrastructure bill moved closer to reality and banks easily passed the Fed’s stress test; bank share buybacks are coming, along with more gov’t stimulus. Bostic said he now expects the Fed’s initial hike at the end of 2022. The EDZ21/EDZ22 calendar which I mentioned yesterday, made another new high for the year, up 0.5 to 32.5. January ’22 to Jan’23 FF spread settled 26.5 (just above one 25 bp hike). The market already reflects Bostic’s thoughts. Continuing Wednesday’s theme, green eurodollars are seeing the most selling pressure on the curve. Yesterday the ten year yield was unch’d at 1.485 while the green eurodollar pack (EDU’23 thru EDM’24) settled -1.375 at an average price just over 98.81 (a yield of 1.19%). Four hikes by December of 2023? Someone thinks so… There was a buyer of 35k 2EV 9875/9850 put spread at 6.5, which is where it settled with EDZ23, the underlying contract, at 9886.0. The options settle October 15 of this year, so it’s all about market expectations over the next 3.5 months. Another large trade of note was a roll down: -50k 0EU 9975p vs +25k 0EZ 9937.5p at 19 to 19.5 credit. Settles 14.25 vs 9961.5 in EDU2 and 9.0 vs 9946 in EDZ2. Roll down to a longer dated out-of-money put and take cash off the table.
–July treasury options expire today. TYU settled 132-05+ with TYN 132.25c settling 5/64 and the 132p at 4/64. Option open interest suggests a pull to the downside.
RIP McAfee and XBox
June 24, 2021
–Rates rose yesterday with green eurodollars, EDU23, Z23 and H24 settling -4.5, weakest on the curve. Tens rose just 1.5 bps to 1.485%. Selling pressure in dollars likely related to hedging for the 5-year auction and today’s 7-year. One new high to point out: EDZ21/EDZ22 plus 3 yesterday to 32.0. This is not the highest print of the year, but it is the highest settle. I have attached a chart of the constant maturity 2nd contract vs 6th contract, and technically it looks like Z1/Z2 could test highs from 2018 which were around 50. It was sometime in 2018 that I recall Brainard making an interesting comment noting that r*, the neutral rate, was actually going up with growth and somewhat higher levels of inflation.
–Jobless claims and Durables today, with the former expected 380k.
–Tomorrow brings the Fed’s preferred measure of inflation, PCE yoy Core prices, expected 3.4% from 3.1 last. That 3.1reading was the highest print since the early 1990’s. Of course, back then the ten year yield was around 7%, slightly higher than today’s 1.5%. July treasury options expire tomorrow, as of yesterday settles FVU 123-11, TYU 132-06 and USU 159-25, just otm puts: FVN 123.25p 3, TYN 132p 6, and USN 159.5p 18.
–Fannie and Freddie stock crushed yesterday as a court case ruled against them in a quest to have profits returned from FHFA. Lock in that mortgage NOW.
·The US believes I have hidden crypto. I wish I did but it has dissolved through the many hands of Team McAfee (your belief is not required), and my remaining assets are all seized. My friends evaporated through fear of association. I have nothing. Yet, I regret nothing.
…
Nonchalant
–Powell doubles down on inflation being transient at yesterday’s testimony, knocking down interest rate vol. The ten year yield eased 1.4 bps to 1.47%. New high in Nasdaq as Powell’s comments again drive demand for long dated “safe” assets. He said the Fed would not be pre-emptive in tightening. Sounds as if any concerns about low rates driving malinvestment and future instability have been reduced to stifled grumbles from the cheap seats. Certainly that’s what VIX is reflecting, having been pounded back down to 16.45 from a high near 22 on Monday. Before the Fed meeting, Paul Tudor Jones was concerned that the Fed might treat the inflation numbers with “nonchalance”, paving the way for renewed inflation trades. While the dots revealed internal discord on the path of rates, one could reasonably use the term nonchalant about Powell yesterday. The end of Powell’s term as Chair in February may take on added significance in this environment. Whatever else one might say about Powell, he is steady. If the dots indicate a much wider swath of opinion, it may be difficult for a new Fed chair to portray the same degree of control. My guess is that Brainard will be the new Fed Chair, but it’s hard to discount the omnipresent quest for social justice leading to a wildcard. On the other hand, what might happen? A new Fed chair that lets inflation run wild and helps monetize unrestrained government spending? We’ve got that now!
–Markit PMI for Europe hit a new high of 59.2 from 57.1 last, the highest reading since 2006. –A large seller of EDH1 at 9980 which appears new (OI +42k) helped to cause a couple of the near eurodollar calendars to squeak to new highs: EDU1/EDZ1 +0.5 to 7.5 and EDZ1/EDH2 +0.5 to settle at 0. EDU1 settled 9987 or 13 bps, just slightly under the current libor fix.
Powell today. Rinse. Repeat.
June 22, 2021
–Yields moved higher at the long end, indicating stabilization after curve flattening in the wake of the FOMC. Tens ended at 1.484%. On the eurodollar curve, reds +1.125, greens +1.75, blues +0.375 and golds -2.25. It appears as if short cover buying in golds has run its course. There were also new positions added in blue Dec puts, for example 20k 3EZ 9800/9762p 2×3 paid 6 to 6.5, settled 9.5 and 4.25 so 6.25 in the 2×3, and a buyer of 25k 3EZ 9750p/9887.5c risk reversal covered 9846 for -3.5 (bought put, put settled 3.25 and call at 7.0). In all, open interest in blue Dec midcurve puts rose 147k. Implied vol fell in treasuries.
–Powell speaks this afternoon in Congressional testimony. Prior to that is the 2 yr note auction. The market appears to have absorbed the Fed’s message from last week; there probably won’t be a large reaction to Powell this afternoon. I would expect questioning on Bullard’s suggestion that MBS be tapered first.
The Weekly
Weekly comment – June 20, 2021
I am starting with a couple of quotes from the week:
“I will be watching the Fed on Wednesday. If they treat these [inflation] numbers (which are material events)….if they treat them with nonchalance, then I think it’s just a green light to bet heavily on every inflation trade.” Paul Tudor Jones, just prior to the Fed meeting
“I will not be a party to this bullsh-t. …And I only mention that because it’s the insidious movement of them to take over absolutely everything.” Roger Waters of Pink Floyd
* I have stolen this week’s title from George Coyle who changed his newsletter title from ‘The Weekly’ to ‘Raw Materials’. His piece is a compendium of financial news quotes from the previous week, and from interesting books. See here to subscribe: https://twitter.com/gfc4/status/1405917104499576835
The Fed moved up the timing of the tapering/tightening schedule. In his rant, Roger Waters was talking about Facebook, but could have been talking about the Fed, with its insidious monetization of the Federal deficit and explosion of its balance sheet. Powell is now trying to take a baby step back from the bullsh-t of trying to control everything, while making sure the party continues. The chairman was upbeat on the economy, and relegated risks from covid to the background. It wasn’t just Powell, the dot plot ratcheted quite a bit higher. In March, three members looked for 1 hike and one for 2 hikes by the end of 2022. By Wednesday, five members saw 1 hike and two saw 2 hikes. Seven out of 18 suggests that a swing to a majority in favor of hiking in 2022 by the September meeting isn’t much of a stretch. The press focused mostly on 2023, where the median shows two hikes, but the distribution was much more hawkish, with 8 of 18 members seeing 3 hikes or more. The top two dots were 1.625%. Compare that to the EDZ23 eurodollar price of 98.88 or 1.12%. Bullard punctuated the week by saying “Fed Chair Powell has opened the taper discussion this week.” He also suggested that MBS purchases could be tapered first, due to the strong housing market. Many market participants had opined that a taper hint could be dropped at the Jackson Hole Symposium in August. In treasuries, implied vol had been relatively stronger for Sept options that expire on August 27. However, near vol exploded at the end of the week. As an example, TYN atm straddle was 50/64’s on June 11 with two weeks to go, and TYU was 2’00. On Friday, the straddle with 2 weeks left was July week-1 132.25^ which settled 64/64’s. TYN atm had only fallen to 44/64’s with one week left, and TYU rose to 2’08. The wide dispersion in Fed dots should cause increased volatility this summer. Additionally, the Fed doesn’t hedge its MBS portfolio. The private market does. If the Fed cuts its buying of MBS, there will likely be more demand for premium. One other note, near eurodollar calendar spreads all made new recent highs as a hike was put into play. EDZ’21/EDZ’22 jumped 13 on the week to a new high 31.5. FFF’22/FFF’23 settled 24.5, indicating exactly one hike in 2022. EDZ’22/EDZ’23 rose 6 bps to 59.5, just under 2.5 hikes.
The quote from PTJ reveals that large investors were already heavily involved in inflation trades, and leaning for a full court press on a dovish Fed. Chair Powell hadn’t disappointed on that score, always stressing the need to get back to full employment above anything else. The shift in tone caused a massive unwind in all inflation related trades; the Costanza of PTJ’s thesis. The dollar soared, precious and base metals were hammered, grains fell, the curve flattened. Most notably, 5/30 treasury spread dropped 26 bps on the week to 113.5. This is well through the trendline that started with the Fed’s framework change in August of 2020, retracing about 75% of the move. The long end rally has been breathtaking, with the 30yr falling 11 bps on the week to 2.025%. This, with the Fed’s Core PCE projection for 2021 at 3.0 percent, falling to 2.1% in 2022 and 2023.
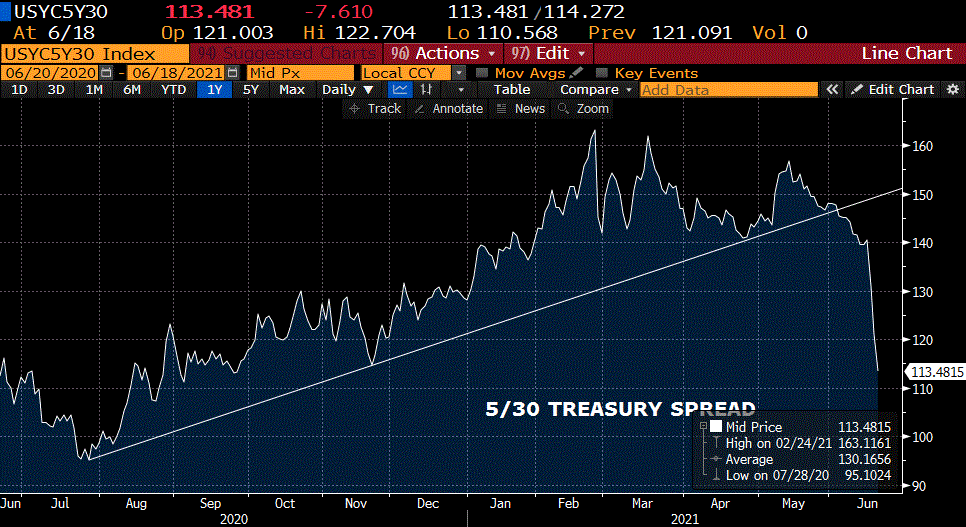
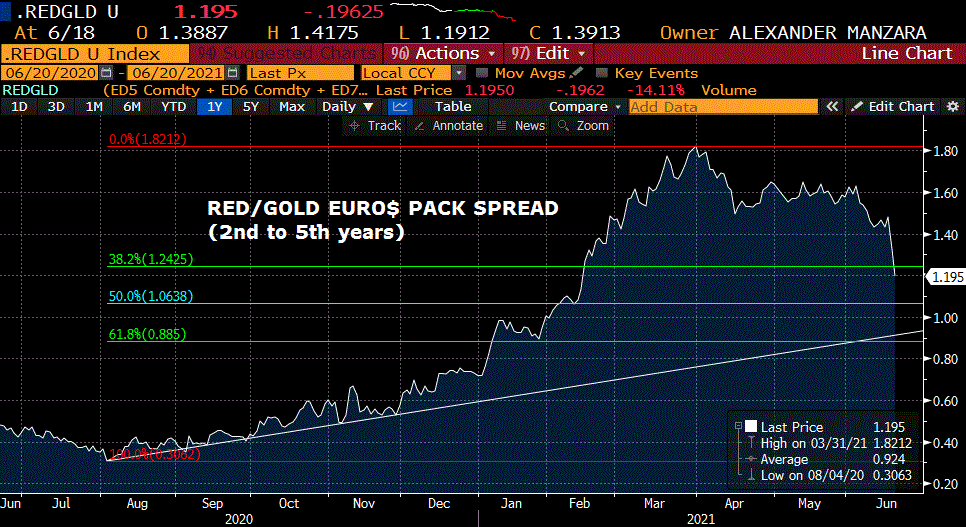
However, the 2/10 treasury spread hasn’t retraced even to the 38% level of the August to March move of 40 to 158. Both the trendline and the 38% retrace come in about 112.5 to 113 versus Friday’s close of 119. The red/gold euro$ pack spread is slightly through the 38% retrace, at 124 bps vs Friday settle of 121.75. The trendline doesn’t come in until 92.
Zoltan Pozsar of Credit Suisse said in a note last week that the Fed’s increase in the RRP rate to 5 bps is too much, and will likely cause libor/ois to rise. Futures markets gave a small nod to this idea, for example EDM22 to FFN22 rose 3 bps on the week to 11.5. However, the three-month libor setting was up only 1.6 on the week to 13.49 bps from all-time record lows; it seems to me that front contracts could come under additional pressure this coming week. The two year treasury yield nearly doubled since June 11, from 14.7 to 25.8. This week features auctions of 2, 5 and 7 year notes. Bullard and Kaplan team up for the bearish Fed case on Monday at 9:45. Powell will hone the Fed’s message in front of Congress on Tuesday. Core PCE prices (Fed’s preferred measure) released on Friday, expected 3.9 from 3.6% last.
OTHER MARKET THOUGHTS/TRADES
From last week: The 2yr/5yr treasury spread topped at 77.5 in March. This week it made a low of 56.2 and ended at 59. The two-year note under 15 bps indicates not much of a hike chance over the period, though EDH’22/EDH’23 at a settlement of 26 forecasts at least one hike over that period. I continue to believe that the Fed will be forced into a hike in late 2022, as high inflation persists and financial stability is imperiled. I do not think Biden will retain Powell next year, and instead will move to Brainard, who may not bring as strong of a hand to the table in terms of Fed board allies. [New comment: 2/5 ended the week a bit higher at 63 as the 5yr note had the biggest bp surge in yield, up 15 to 88.9]
From last week: Red/green/blue Eurodollar butterflies have firmed since mid-May. These should rally on an ‘earlier hike than the market currently thinks’ theme. Example, EDZ2/EDZ3/EDZ4 fly settled 0.5. I would like to buy at -2.5, stop on close below -5.5. Objective +8 to +10. This is buying EDZ2/EDZ3 spread which settled 53.5 vs selling EDZ3/EDZ4 which settled 53.0. Might get a buying opportunity post-FOMC. [Never got the chance to buy my level, but these flies exploded and Z2/Z3/Z4 settled 18, up 17.5 on the week. Should be exited]
My thesis had been that Powell would continue to indicate that the Fed was on hold, which is why I thought the curve would steepen, forcing earlier than expected Fed hikes. That was wrong, though I continue to think the curve bounces from here (perhaps from a bit lower levels early in the week). Gold eurodollars, the fifth year forward, made new highs for the year on short covering. For example, EDZ’25 peaked in open interest at 207k just prior to the Fed meeting, by Friday 25% of those (short) positions had been closed out with OI down to 157k. At a price of 9824 or 1.76%, this contract is still well below inflation. In March, the low price was 9768.
China last week said it would begin to sell major industrial metals from state stockpiles in an effort to squelch factory gate price increases. I can’t help but think that’s going to work out about as well as “Brown’s bottom”. In 1999, the UK’s then Chancellor of the Exchequer, Gordon Brown, decided to sell off Britain’s gold reserves. The BOE were not for it. Between 1999 and 2002 the UK’s sales averaged $275 an ounce. The beat low. Ten years later the price was about $1000/oz higher.
https://www.bbc.com/news/business-48177767
| 6/11/2021 | 6/18/2021 | chg | ||
| UST 2Y | 14.7 | 25.8 | 11.1 | |
| UST 5Y | 73.9 | 88.9 | 15.0 | |
| UST 10Y | 145.2 | 145.3 | 0.1 | |
| UST 30Y | 213.8 | 202.5 | -11.3 | |
| GERM 2Y | -68.3 | -66.6 | 1.7 | |
| GERM 10Y | -27.3 | -20.0 | 7.3 | |
| JPN 30Y | 65.1 | 67.4 | 2.3 | |
| CHINA 10Y | 315.0 | 314.2 | -0.8 | |
| EURO$ U1/U2 | 14.0 | 24.0 | 10.0 | |
| EURO$ U2/U3 | 50.0 | 61.5 | 11.5 | |
| EURO$ U3/U4 | 53.5 | 44.0 | -9.5 | |
| EUR | 121.11 | 118.64 | -2.47 | |
| CRUDE (active) | 70.60 | 71.29 | 0.69 | |
| SPX | 4247.44 | 4166.45 | -80.99 | -1.9% |
| VIX | 15.65 | 20.70 | 5.05 | |
Rate hike chance moves up
June 18. 2021
–Spectacular moves in many markets yesterday as players try to digest Powell’s upbeat economic summary and more hawkish outlook for monetary policy. (I think “players” may be a more appropriate word than “investors” for this type of volatility). Interest rate curves were one of the most visible reflections of changing positions, where 5/30 fell another 9.8 bps yesterday to a recent low of 122; down 19 in two days. Commodities and precious metals hit hard, USD bid, curves crushed like falling timber. In some ways, the curve moves represent a mini-taper-tantrum. On the eurodollar strip, prospects for tightening were jolted forward. As an example, I have attached a chart of the EDU2/EDU3/EDU4 butterfly (thanks DK). Yesterday, EDU2/EDU3 one-year calendar ROSE 4 bps to 63.0, while EDU3/EDU4 FELL 7.5 bps to a new recent low of 50.5. The fly rose 11.5 on the day to 12.5. As is evident on the chart, a swing from -13 to +13 in a month is rather unusual. I suppose these wild moves are partially explained by all the loose money sloshing around, as reflected by the RRP operation which totaled a record $756 billion as the rate was raised to 5 bps. Today’s equity option expiration could also drive some volatile trades, and Powell is slated to further explain the Fed’s thinking in front of Congress on Tuesday, as we approach quarter end.
–The peak one-year eurodollar calendar is now EDH23/EDH24 at 64.5, but the nearer spreads are catching up as an actual hike could move forward and news sources report that many on the Fed are getting restless with the new framework. What has appeared to be stability has been orchestrated by relentless Fed stimulus– even a change at the margin can have unintended consequences. After the Fed there were two large block buys, 20k each EDU2/U4 and EDZ2/Z4 at 121.5 and 118. Yesterday these settled 113.5 and 109.5, but there was another 20k block selling EDU3 and buying EDZ4, so perhaps rolling the short EDZ4 leg forward to U23.
–I’m not sure how much to trust (or interpret) the prelim open interest figures, but the big changes were in EDH23, down 45.7k contracts (ending price 9942, -4.5), EDZ23 down 49.3k contracts (ending price 9890, -4.0) and EDZ25 down 38.5k contracts (ending price 9816.5, UP 12 bps). The guy with the long EDZ23/EDZ25 spread did NOT have a good day. On the EDZ25 contract, the decline in open interest represented nearly 19% of total positions. I guess we can roughly say that every 10k exit of a green/gold calendar can move the spread around 4 bps. Follow the science, right?

Steepness shifts to front end in wake of FOMC
June 17, 2021
–The five year note was crushed as the Fed indicated a couple of rate hikes by the end of 2023. Five-year (at futures settlement) was up 9.2 bps to 0.876%, while tens rose 6.1 bps to 1.558% and thirties actually fell a fraction of a bp. 5/30 spread easily made a new recent low, plunging 9.4 to 132 bps. Steepness shifted to the front end of the curve as all near euro$ one-year calendars made new recent highs. As an example, EDZ’21/EDZ’22 rose 4 to 24.5, while EDZ’22/EDZ’23 jumped 7 to 61.5. While Fed dots indicate 2 hikes, the market is looking for more. On the eurodollar curve, the blue pack (4th year) was the weakest, closing down 15 on the day at an average price just below 98.35, or a yield of 1.65%. Prior to the announcement there was a buyer of 3EN 9850 puts for 3.5 bps, these closed at 9.75 as the underlying EDU’24 settled at the money at 9851 (-15) and traded as low as 9846.5. Powell said that even though growth in 2022 was forecast to be very strong at 3 to 3.5%, the Fed would remain highly accommodative and intimated the central bank would lag the curve. While IOER was raised 5 bps. near ED contracts only fell 1.5 on the day.
–Post-Fed there were a couple of 20k block trades which appear new from this morning’s open interest report. EDU’22/EDU’24 bought for 121 bps and EDZ’22/EDZ’24 bought for 118.5. Both of these two-year calendars settled 117. Five or more 1/4 percent hikes over two years? Seems reasonable. I suppose that in a broader context, trades like these signal a change in sentiment from large asset managers: the Fed has shifted its stance. The dollar jumped and precious metals have been shellacked. Stocks are showing early weakness this morning, which could accelerate due to Friday’s option expiration.
–Powell will be testifying before Congress on Tuesday to further massage his message and quell undue volatility.
Current Conditions
June 16, 2021
–Former NY Fed President Dudley often spoke about financial conditions. In a speech from March 2017, he mentioned 5 key inputs, short term treasury rates, long term treasury rates, credit spreads, the value of the dollar, equity prices. Going into today’s Fed meeting, 3-month libor is at a record low and bill rates are zero. Then ten year yield is 1.5%. Excluding the COVID plunge of 2020 it’s at the lowest level in five years. Credit spreads are record lows. DXY is near the year’s low. Stocks are record highs. Housing is on fire with mortgage rates extremely low. Federal deficits are at a record. The financial press continues to talk about the dot plot. My question is whether current financial conditions represent stability, or could be silently breeding instability.
–Regarding the dots, in March, 4 members saw one hike and one saw 2 hikes in 2022. In 2023 there is 1 dot at 0.375, 1 at 0.625, 3 at 0.875, and 4 at 1.125. Because these are end of year forecasts, it’s worth looking at Dec/Dec eurodollar spreads for comparison. EDZ21/EDZ22 is 20.5 bps, not quite indicating one hike. Jan’22/Jan’23 FF spread is 14.5, about a 50/50 chance for one hike in 2022. So those spreads are more or less consistent with the plot. EDZ’22/EDZ’23 is 54.5, about 2 hikes over that year which I would also terms as consistent with the plot. Of course, “longer term”, the Fed expects the FF target to be around 2.5%, and nothing in the rate market is consistent with that. Nothing. If we compare that target to long term inflation expectations as represented by the ten year note to tip spread, which is 240 bps, then we might conclude that the Fed expects slightly negative real rates for the next ten years. If we look at an average of the 4 euro$ contracts in year 2025, the avg price is 98.3075, which would be reasonable in the context of a FF target of 1.50. About 100 bps BELOW the Fed’s longer term projections.
–In the March projections, the Fed looks for Core PCE Inflation at 2.2 in 2021, 2.0 in 2022 and 2.1 in 2023. I’ll take the over, but the market has easily absorbed shockingly high prints. The market trades as if Powell can gracefully transition to an initial conversation about tapering and eventual tightening. I suppose the Fed should take that as a merit badge for guidance. Enjoy it while it lasts.
Bats*** crazy
June 15, 2021
–Curve bounced with the ten year yield rising 4.5 bps to 1.497% and 2/10 up 3.3 to 133.8. On Monday, 3-month libor set at a new record low of 11.8 bps, leading to the highest ever final settle of a euro$ contract, EDM1 at 99.8820. Coincidentally, Nasdaq made a new all-time high. And the Fed’s RRP was a record high $584 billion. I don’t know if any of these factors will filter into a discussion of financial stability at tomorrow’s FOMC, but it would seem as if tapering should be high on the agenda (again, it would only be slowing the growth of the Fed’s balance sheet, not reversing it).
On Monday Paul Tudor Jones was interviewed by Andrew Ross Sorkin and PTJ said the world is bat-s crazy. His comments were centered around the Fed but for a concrete example of crazy consider that the Greek Five Year note printed a negative yield on Monday, having been 20% just six years ago.

Summarizing PTJ, he said that this FOMC might be the most important in the past four or five years in terms of how they react to the data. He says the Fed is now operating with a single mandate, that of full employment. So, this Fed has a different reaction function [which of course was articulated by the Fed in August of 2020 with the announced change of framework]. He cites the extraordinary fiscal and monetary accommodation as being outside the bounds of orthodoxy, and said it all started with Trump’s 2017 tax cut that resulted in a 5% peacetime deficit. Mohamed el-Erian made similar comments yesterday, saying that even with the economic car rolling downhill, the authorities have the “pedal to the metal”. The Fed has said several times that tapering will precede rate hikes, and it seems as though the tapering discussion must occur now, as the next FOMC is in late July.
One interesting thing about PTJ talk was about commodities: He said that Asset Managers have about $88 trillion under management, and of that about $670 billion is committed to commodities, or about 0.75%, with inflation at 4.9%. He compared that to 3% inflation of 2011, when asset managers had about 1.2% of assets in commodities. To bring the percentages back would cause a flow of about $400 billion into commodities, which he says could double or triple commodity indexes. Elucidating further he says, “They’re SHORT”.

