
Inflated Household Net Worth
June 13, 2022
The ten year yield dropped 11 bps on the week to 1.45%, with CPI clocking in at 5% yoy. JOLTS data last week was off the charts at 9286k, indicating powerful demand to fill job openings.
This week features the June FOMC meeting. The Fed has apparently won the “inflation is transitory” argument, because a ten year yield below 1.5% simply does not make sense with inflation at 5% (or at 3% or at 2% for that matter). Nor does a new record low in hi-yield at 4.08%. The G7 meeting found common ground in the need to continue shoveling fiscal support. Certainly, the conversation to begin tapering should occur, but any action will occur at a later date. An adjustment to IOER higher by 5 bps is likely to be the only tangible outcome of the meeting.
The Fed’s Z.1 flow of funds report was released last week. Focus is typically on the Household Net Worth number, which of course hit a new record high of $137 trillion, up $5T on the quarter. Yes, we’re all getting “richer”, (isn’t that simply fantastic?) What I would note is that the “getting richer” slope over the past four or five quarters is quite a bit steeper than the trend from 2011 to 2018.
The Credit Bubble Bulletin has these comments relating to Z.1: “Household Assets inflated $5.184 TN, or almost 14% annualized during Q1 to a record $154.2TN… Household Assets-to-GDP ended the quarter at a record 699% of GDP – up 100 percentage points in 14 quarters.” Further, “HH Net Worth surged $4.997 T during Q1 to a record $136.9T. For perspective, growth in Net Worth averaged $830 billion quarterly over the 20-yr period prior to 2019. Net Worth inflated $31.4T over five quarters. HH Net Worth ended March at a record 621% of GDP. This was up from previous cycle peaks 491% (Q1 2007) and 445% (Q1 2000).”

I would put this data in the inflation category. Moreover, I would also have to characterize these ratios as transitory. While growth has clearly come roaring back, my opinion is that Net Worth to GDP is at an unsustainable level. What I haven’t read much about recently, (though I have personally observed it) is the wealth effect on consumption. I believe it operates with a lag and is likely to be a large support for consumption over the next several quarters. My thesis is that the Fed, in concert with fiscal spending, has over-inflated the value of financial assets relative to GDP. What is comforting, at least on the household side, is that total liabilities (the red bars on the above chart) have barely increased at all. In fact, on the quarter, liabilities increased less than $200 billion to $17.24T. These assets are being blown up by someone’s debt, but it’s not that of the HH sector, it’s the government. I suppose one might surmise that a moderating influence on consumption would be future tax liabilities on households, but that’s been pushed to the back burner by Modern Monetary Theory.

The chart above has bearing on household net worth, yield levels, and the taper discussion. Note that in 2013, when yields surged in response to Bernanke’s suggestion of taper, the balance sheet was, in fact, growing the entire time. Another fun fact is that while the FF target was exactly the same then as it is now, the starting point for the tantrum surge in tens was the exact same level as it is now.
There is, of course, a lot of focus on the tapering schedule, but current concerns seem rather overblown because in this case, the Fed won’t actually be decreasing the balance sheet, but merely slowing its growth rate, though of course changes at the margin matter. It was in 2018 when the Fed was both hiking AND actually cutting the size of the balance sheet that proved too much for financial markets, as stocks tanked in Q4 2018 and bond yields followed suit. On the chart above, yields would appear to have significant room to the upside even with a slight decrease in the trajectory of balance sheet growth. Of course, the narrative is that without the Fed buying every bond, yields have to increase. I think a taper at this point will have a more significant effect on equities than bonds.
A couple of words about commodities and the inflation debate. Some have pointed to the hard break in lumber off May’s high, which accelerated this past week, as evidence that high prices are unsustainable. We are not seeing the same sort of price action in grains, and certainly not in oil. Both the near WTI contract and deferred calendar spreads made new highs. CLN1 closed at 70.91, highest since Q4 2018 (when Fed hikes and balance sheet reduction hit oil and stocks simultaneously). CLZ1/CLZ2 ended the week at the highs of 5.53, having started the year at 1.31. CLZ1 100 calls have drawn some attention, and now show nearly 16k in open interest, settling at 27 cents vs 67.84. Dec Corn ended the week at 609 ¾, near the high of the year. Hot and dry weather is underpinning strength in grains. I like to refer back to Sue Martin’s interview on Feb 26 of this year with Iowa PBS, where she forecasts extremely high prices in 2023 as a result of tight stocks: “I think it’s possible that in 2023, we can see, and I’ll pace it, we could see $30 beans. I think corn, maybe 18-19, and wheat goes to 42 to 45.” If she’s correct about $19/bushel corn next year, it will be mighty interesting to see where we are on the broader inflation question.
https://www.iowapbs.org/mtom/story/38230/market-plus-sue-martin
(start around 9 min mark)
OTHER MARKET THOUGHTS/TRADES
The 2yr/5yr treasury spread topped at 77.5 in March. This week it made a low of 56.2 and ended at 59. The two-year note under 15 bps indicates not much of a hike chance over the period, though EDH’22/EDH’23 at a settlement of 26 forecasts at least one hike over that period. I continue to believe that the Fed will be forced into a hike in late 2022, as high inflation persists and financial stability is imperiled. I do not think Biden will retain Powell next year, and instead will move to Brainard, who may not bring as strong of a hand to the table in terms of Fed board allies.
While the long end rally has compressed many spreads, the trend toward steepening remains intact. There might be a bit more of a pull back, but my thought is that the August change in the Fed’s framework sparked a move that will continue, unless trendlines off August lows in spreads are broken. Using 2/5 as an example, the spread began the year at 25, and the August trendline comes in around 40 currently.
| 6/4/2021 | 6/11/2021 | chg | ||
| UST 2Y | 14.9 | 14.7 | -0.2 | |
| UST 5Y | 78.4 | 73.9 | -4.5 | |
| UST 10Y | 156.2 | 145.2 | -11.0 | |
| UST 30Y | 224.2 | 213.8 | -10.4 | |
| GERM 2Y | -67.1 | -68.3 | -1.2 | |
| GERM 10Y | -21.3 | -27.3 | -6.0 | |
| JPN 30Y | 69.0 | 65.1 | -3.9 | |
| CHINA 10Y | 313.0 | 315.0 | 2.0 | |
| EURO$ U1/U2 | 14.0 | 14.0 | 0.0 | |
| EURO$ U2/U3 | 53.0 | 50.0 | -3.0 | |
| EURO$ U3/U4 | 58.5 | 53.5 | -5.0 | |
| EUR | 121.68 | 121.11 | -0.57 | |
| CRUDE (active) | 69.62 | 70.91 | 1.29 | |
| SPX | 4229.89 | 4247.44 | 17.55 | 0.4% |
| VIX | 16.42 | 15.65 | -0.77 | |
https://www.federalreserve.gov/releases/z1/dataviz/z1/balance_sheet/table/
Bureau of Weights and Measures
June 11, 2021
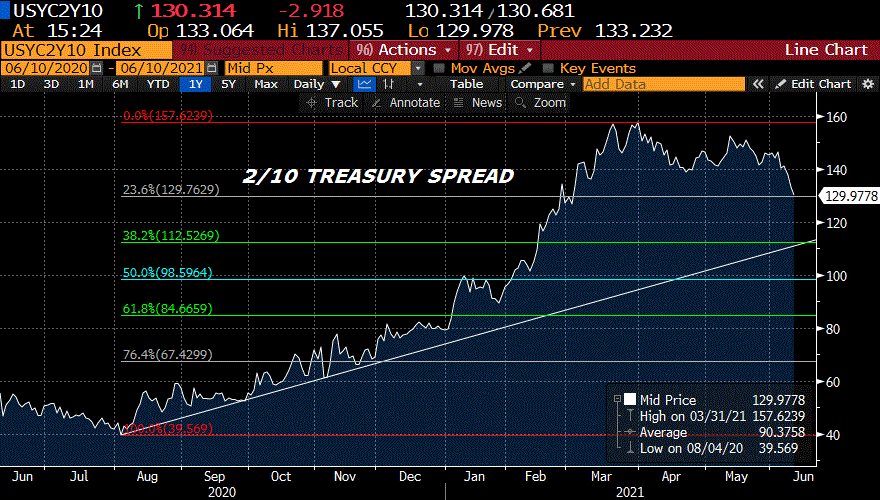
–A blockbuster inflation report was met with a shrug, as 5% yoy CPI caused the curve to make new lows and SPX to hit an all-time high. It’s incorrect to say the report “caused” the curve to make new lows, but that’s what occurred in any case. Core CPI was +3.8% yoy. 2/10 spread fell 2.5 bps to just over 130 bps, with 115-120 as next large support level, which would test the trendline from August, when the Fed changed its framework. The ten year yield fell 2.9 bps to 1.457%. A couple of other related notes: the Fed’s RRP operation set a new record of $535 billion, and Household Net Worth rose $5 trillion in Q1, according to Bloomberg. When I look at the Fed’s Z.1 report, I see an increase in net worth of ‘only’ about $4 trillion (maybe Bloomberg is including NFT’s). Just joking about the NFT’s, but according to this link. I see Total Assets at $154.2T vs $150T in Q4, and Total Liabilities $17.2T vs $17T.
https://www.federalreserve.gov/releases/z1/dataviz/z1/balance_sheet/table/
The chart link is revealing as well, as it shows acceleration in ‘assets’.
https://www.federalreserve.gov/releases/z1/dataviz/z1/balance_sheet/chart/
So, assets are levitating in value, while liabilities edge just a tiny bit higher…for households. Government debt has, of course, soared. To me, the conclusion is that the measuring stick, that being the value of the dollar, is suspect. It reminds me of the Tin Man scam, where the salesman would cut a few inches from the center of the old wooden yardstick, glue it back together, and hold his hand over that part when measuring a job. “No one ever checks to see how long a yardstick is.” The record RRP numbers just sort of confirm the idea of A LOT of excess liquidity. I suppose yield levels tell the same story.
–A couple of trades to note: Seller of ~75k 0EU 9975/9950 p spreads at 3.5, settled 3.0 vs 9975.5. Looks like a roll down in strike as OI rose 72k in the 9950p and fell 63k in 9975p. Open interest in the contract fell just under 28k. In tens, pre-data there was a buyer of TYQ 133/132p 1×2 for -1 to +1, settled 3 (43 and 20) with delta of +0.06 as vol was crushed in treasuries.
Can’t find the yardstick scene, but Life Magazine gives the flavor:
CPI… already in the rearview mirror
June 10, 2021
–Nearly all eurodollar calendar spreads etched out new recent lows as the ten year auction was well received, with tens closing just under 1.5%. 2/10 at a new low of 133.3, down 4 on the day, while 5/30 ended at 142.4. Red/gold pack spread closed -4.375 at 146.25, just below 50 bps per year on average over those three years. That is, red/green (2nd to 3rd year) at 49 bps, green/blue (3rd to 4th) 55.5 bps and blue/gold (4th to 5th) at 41.75. One could conclude that the market is roughly forecasting two hikes per year starting in the second half of 2022.
–The big number today is CPI, with yoy expected 4.7%. Whether it’s lower or higher doesn’t seem to be the issue, the market trades as if inflation simply can’t be sustained. Jobless claims expected 350k, and the treasury issues 30 year bonds as the Fed’s RRP totaled a record $502 billion. My view is that the extraordinary amount of excess reserves reflected by RRP could be somehow linked to what appear to be some pretty dumb investments. Of course, if that’s the case, then one would have to conclude that the Fed is slightly derelict on the whole “financial stability” function. And that conclusion would run counter to another report released today, which is the Fed’s quarterly Z.1 flow of funds report. This report will surely show a new record high in American’s net worth. How could net worth be making record highs if the Fed isn’t doing its job?
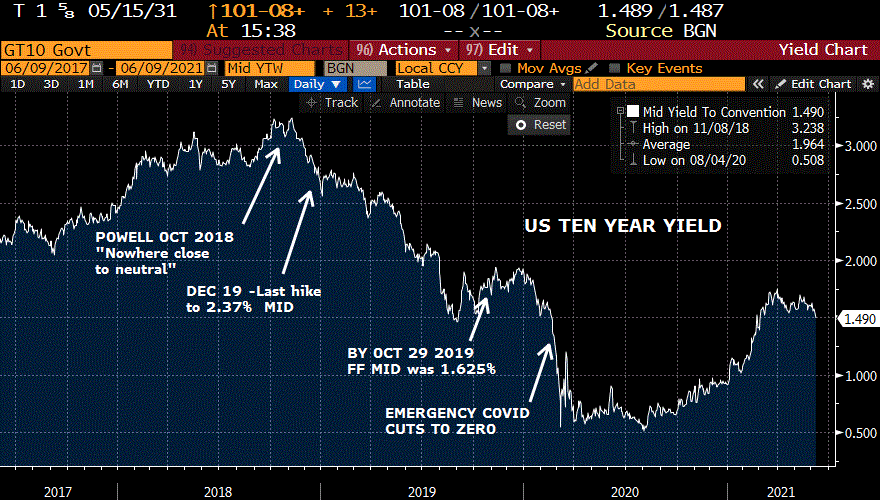
–Even before the last hike in December of 2018 (to 2.50/2.75%), the market had signaled that the Fed was too tight. From Q4 2018 to Q3 of 2019, as the Fed reversed course and began to ease, the ten year went from over 3% to around 1.5%, where it is now. In Q4 as the Fed made its last cut of the year (to 1.5/1.75%) and tens were trading around 1.75 to 1.9%. Now we have drifted back down to the low yield of 2019 again, almost as if bad things are on the horizon…
Risk free rates
June 9, 2021
–The ten year note yield dropped 4 bps to 1.526% yesterday in front of today’s $38 billion auction, and futures are slightly higher yet this morning. Various reasons given for continued strength in bonds. I saw one article surmise that taper bets are receding, while another said that inflation concerns are receding. An article in the FT suggests that the Fed risks “reacting too slowly if inflation keeps rising.” China’s PPI was released at a blistering 9% yoy, while Chipotle is raising prices by about 4% to cover rising labor costs. Perhaps one of the big and simple reasons for continued strength in bonds is reflected by the settlement of the front July eurodollar contract at 99.89, which I believe is a record high ED settlement at just 11 bps. Yesterday’s RRP operation was also a record, at $497 billion. Everything appears to be floating on a sea of endless liquidity with near zero carry costs. They used to warn that the Fed was intentionally pushing people farther out on the risk curve due to low rates. I don’t hear that much any more, now that the “risk curve” has extended past the far horizon with a new crypto every five minutes.
–I didn’t read details, but also saw an article noting angst at the possible end of the student loan moratorium. Let’s say for a minute that the reason bonds are bid is because the rent moratorium will end, unemployment benefits will end, and the government infrastructure plan will be significantly trimmed back. In short, that government support, which has been pumping up the balloon, will be sharply curtailed. If that is the case do stocks belong near record highs? In any event, none of the forward scenarios seem particularly supportive for the dollar, and a weaker dollar is inflationary.
–Yesterday featured new recent lows in many curve measures, with 2/10 at 137.5, down 3.9 bps and 5/30 at 144.3, down 1.3. The red/gold eurodollar pack spread closed down 3.125 bps just over 150. This, in front of a CPI number expected to be north of 4.5%. Buyer yesterday of 2EZ 9912/9900/9887p fly for 1.0, with EDZ3 trading 9909.0. Time until expiration is 184 days; it’s a bit early to be pegging the price of green Dec. On the other hand, midcurve June options expire Friday, with 2EM 99.4375^ settling 4.25. Breakeven 99.48 on the upside and 99.395 on the downside. So 8.5 bps window for profit on the June midcurve straddle in 2 days if sold, with a 23 bp window of profit on the 2EZ fly if bought, with 184 days. Of course, a short straddle has open ended risk (but not with the Fed in charge, right?)
Operation Bitcoin
June 8, 2021
–Little net change in fixed income yesterday as the treasury kicks off with the three year auction. Tens were up less than 1 bp at 1.567%. Implied vol declined, especially in ED’s. June midcurve options expire on Friday. The green midcurve 99.4375 straddle on EDM’23, which settled 9943, settled 4.75 and the blue midcurve 9875 straddle on EDM’24 (9876.5s) closed at 7.0. Reasonably priced, though perhaps slightly on the complacent side give CPI on Thursday.
–The action is in bitcoin, where the CME contract is 33000 this morning, down around 2650. Maybe those guys at the DOJ should be given a bit more credit. They apparently recovered the bitcoin ransom paid by the Colonial Pipeline, and immediately sold it, thereby pressuring all crypto. If bitcoin has become the safe haven alternative relative to USD, and USD has been weakening due to unrestrained gov’t spending and growing Fed balance sheet, then pushing down bitcoin will test the psychology of the market, and perhaps re-engineer confidence in the reserve currency. (DXY sub-90 yesterday). Next phase: make sure that bonds are solidly bid even in the face of a monster CPI number. Brilliant! Now they can let gold reclaim the mantle of safe haven… it’s a lot easier to manipulate.
–All joking aside, a Company called MicroStrategy is seeking to raise $400 million in a debut junk-bond sale at 6.25 to 6.5% yield. The funds will be used to buy more bitcoin. Let’s get this straight: I lend you money to buy bitcoin. Check. You promise to pay me 6.5%. If bitcoin doubles, I get 6.5% on my dollars. If bitcoin drops by 70%, you go out of business and I lose my principal. WHERE DO I SIGN UP? Now I see why it’s called Micro Strategy, because the macro amount of funds borrowed becomes micro. See, in Greek, micro means small. From big, to small, get it? it IS a joke! Maybe the whole DOJ crashing bitcoin idea isn’t so far-fetched.
Plus
June 7, 2021
–Front Soybean oil is at a new all-time high this morning at 72.77. Stocks and bonds have given back some of Friday’s gains which saw tens end at 1.56%, down over 6 bps. as a solid payroll number at 559k was lower than expected and well under whisper numbers. This week brings auctions of 3’s, 10’s and 30’s, which raise $99 billion of new cash. On Thursday, CPI will be released, which is expected +4.7% yoy. In my formative years, if you would have asked me for an over/under on the FF target with yoy CPI over 4% and NFP over 500k, I would have made you 5.5% (and been worried I set it too low). Now, I hear that Janet Yellen said over the weekend that “…a slightly higher interest rate environment would actually be a plus for society’s point of view and the Fed’s point of view.” OK. Got it.
–I was in a brief conversation Friday where I was told that inflation can’t be sustained because labor has no power. This is one of the few times where everyone can see help-wanted signs. Reports that businesses can’t find appropriate workers are widespread. Cheap labor for China’s manufactured goods also seems to be in the rearview mirror, and strength in the yuan is inflationary at the margin for the US. I saw a friend over the weekend who works for a construction firm that does a lot of business with Chicago Public Schools (CPS). He said it’s a requirement that CPS gets three bids for every job, but now oftentimes his firm is the only one that provides a bid, and there is a special designation that now allows for fewer than three bids in order to get work done. Cost management of subcontractors has become a challenge. It’s a plus for society, I guess.
Villains and Heroes
June 6, 2021 -Weekly Comment
“I guess when one’s young, it seems very easy to distinguish between right and wrong. But as one gets older, it becomes more difficult. The villains and the heroes get all mixed up.” Rene Mathis – Quantum of Solace (James Bond)
The bond market is bulletproof. It has absorbed all types of bearish news: high inflation data, increasing government deficits, labor shortages. The ten year yield hasn’t deviated far from 1.60% since March, ending Friday at 1.56%. down 2.6 bps on the week. This, despite the highest ISM Service number ever at 64.0, ADP payroll growth of 978k followed by a “disappointing” NFP of 559k with an unemployment rate of 5.8%. Suzanne Clark, President and CEO of the US Chamber of Commerce said, “The worker shortage is a national economic emergency, and it poses an imminent threat to our fragile recovery and America’s great resurgence.”
The argument that inflation is unsustainable is winning the day, with analysts like David Rosenberg and Lacy Hunt citing high debt levels, etc. Of course, the most powerful voice in favor of continued monetary accommodation in the face of transitory price pressures and slack in the labor market is that of the guy pulling the levers, Chairman Powell.
For the sake of historical curiosity, see the chart below from the mid-1970’s, prior to birth of most of our trading community. Unemployment was over 11% as inflation began to accelerate, from about 5% in late 1976 to a high of 14.7% in March of 1980. Unemployment bottomed at 5.7 in June of 1979. Two takeaways from this chart. First, inflation WAS “transitory”, it only accelerated for three years. Second, inflation was able to increase, even with the unemployment rate well above Friday’s reading of 5.8%. Of course, you wouldn’t have wanted to maintain long positions in fixed income during this particular transitory period, as the ten year yield went from 7% at the start of 1976 to over 13% in 1980.
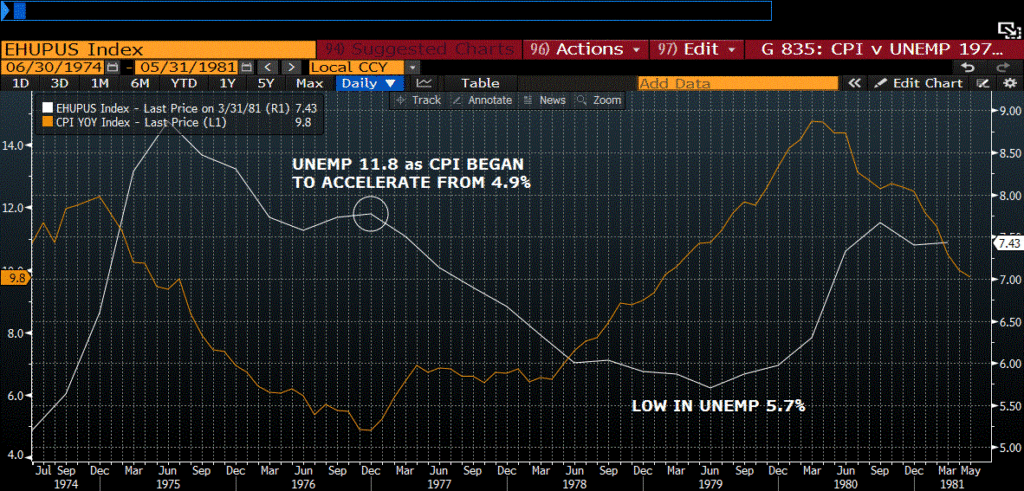
Again. I remind you that the current ten year yield is 1.56%, with a real yield as defined by the ten-year tip of negative 90 bps, and even more negative than that if you use the last CPI data of 4.2%.
David Rosenberg, in making his argument for price increases merely being a one-time shift, often repeats that there is no “regime change”. The election of Obama, which some thought might produce inflation, didn’t. Bernanke’s unorthodox (at the time) QE policies didn’t spark inflation, nor did Trump’s tax cut package.
My personal feeling is that “regime change” indeed occurred, specifically with the change in the Fed’s framework in August of last year. That’s when curves started to steepen. Commodity prices had already bottomed prior to August, but never looked back since September. I’ll note one more thing about regime change which concerns data that will be released this week on the tenth, the Fed’s Z.1 flow of funds report. In 2007, on the cusp of the GFC, total Household debt was $10.577 trillion. Total Business debt was $10.678T and the Federal Gov’t came in at $7.376T. Roughly a third each, with the Federal Gov’t lagging. The last report is from Q4 2020. Household debt nearly unchanged at $10.935T. Total Business debt $17.719T (which the Fed sometimes refers to as being on the high side of historical norms as compared to GDP). And then there’s the Federal Gov’t at $23.621T, about three times higher than 2007. In my opinion, these shifts represent regime change, though not in the sense of being abrupt. If the footprint of the Federal Gov’t were about to become significantly smaller, it would likely have disinflationary consequences. In fact, that’s part of Rosenberg’s thesis, that Biden’s hand will be constrained by a new Congress following the 2022 elections. Maybe so, but sometimes markets operate with lags. One other note, the Fed’s Household Debt and Financial Obligations ratio is last at 14.71%. That is one of the lowest ratios ever, and why Fed officials often say that the Household balance sheet is in good shape, in aggregate.
The next quarterly Z.1 report is released on Thursday. Of more immediate concern to the bond market is CPI, also released on Thursday, expected 4.7% yoy from 4.2% last, with Core expected 3.4%. Again, this is with the ten year yield at just 1.56%. Additionally, the market will need to fund approximately $99 billion above maturing amounts with this week’s auctions of $58b 3-yrs, $38b 10-yrs and $24b 30-yrs.
Tin foil for this last bit. When they say the only choice is to inflate out of debt, it becomes clear that what they’re talking about is a government bailout of government. Oh sure, the government shifted some private debts from business and households to its balance sheet after the GFC. The response due to COVID has been extraordinary. Now the government needs to save itself with inflation. Sure, there’s a concern that if inflation jumps rates will rise, and the interest burden will become onerous. But not if rates can be held artificially down and higher price levels help expand nominal GDP in order to lessen the debt-to-GDP ratio. Perhaps I am being cynical here, mixing up villains and heroes, but if you thought the government’s response to help the public get through covid was heroic, just wait until you see the lengths to which the government will go to help itself.
OTHER MARKET THOUGHTS/TRADES
The popular trade of the week was buying put spreads and selling call spreads. Of note, 2EZ 9900/9787ps was bought vs selling 2EZ 9925/9937ps. 2EZ options have EDZ’23 as the underlying future and expire on 10-Dec-2021. Open interest in the 9900p rose about 160k on the week; the package traded around 100k. Settlements on Friday: 9900/9787.5ps 4.25 and 9925/9937.5cs 4.25, so flat with EDZ3 9906.5. That is, a put spread just 6.5 out of the money settled at the same price as a call spread 18.5 out of the money. This is available due to skew. For example, the 9937.5c settled 4.5, 31 out of the money, while the 9875p settled 8.0, 31.5 out of the money. One might conclude that the demand for puts represents insurance purchases for the case of higher rates, and that since the risk has been adequately addressed and priced, it’s not quite as likely. That’s what the Fed is telling you. Weakness in USD might be telling you something else.
Related to buying of put spreads in greens rather than further out points up another somewhat interesting aspect of the week’s trade: The steepest part of the curve has been greens to blues, or contracts in the year 2023 vs contracts in 2024. The peak one year spread has been EDM23/EDM24 which closed the week at 66.5. These elevated one-year spreads are partially due to the June 2023 end of libor and partially due to the idea of Fed hikes commencing two or so years hence. Consider the September expiration contracts: EDU’21 settled 9988.0, up 0.5 on the week. EDU’22 at 9974.0, up 1.0 on the week, EDU’23, 9921.0 up 1.5 on the week, EDU’24 9862.5 up 4.5 on the week. The one-year spreads are as follow, EDU’21/22 14.0, down 0.5, EDU’22/23 53.0, down 0.5 and EDU’23/24 58.5, down 3.0. All yields declined slightly on the week, but the year 2022/2023 spreads held up better than the year behind. Small moves, but it could be that the market is thinking removal of Fed accommodation could be slightly sooner than previously expected.
Nearing the July 1 date of the 100th year anniversary of the China Communist Party. The yuan eased slightly this week with the increase in FX required reserve ratio, the ten year yield rose just over 4 bps to 3.13%. Things in China will likely be as tightly scripted as a Biden news conference, but there are probably some actors who wish to cause disruption on such a momentous occasion.
| 5/28/2021 | 6/4/2021 | chg | ||
| UST 2Y | 14.1 | 14.9 | 0.8 | |
| UST 5Y | 79.5 | 78.4 | -1.1 | |
| UST 10Y | 158.6 | 155.9 | -2.7 | w/I 156.2 |
| UST 30Y | 226.2 | 223.8 | -2.4 | w/I 224.2 |
| GERM 2Y | -66.2 | -67.1 | -0.9 | |
| GERM 10Y | -18.3 | -21.3 | -3.0 | |
| JPN 30Y | 66.8 | 69.0 | 2.2 | |
| CHINA 10Y | 308.7 | 313.0 | 4.3 | |
| EURO$ U1/U2 | 14.5 | 14.0 | -0.5 | |
| EURO$ U2/U3 | 53.5 | 53.0 | -0.5 | |
| EURO$ U3/U4 | 61.5 | 58.5 | -3.0 | |
| EUR | 121.92 | 121.68 | -0.24 | |
| CRUDE (active) | 66.32 | 69.62 | 3.30 | |
| SPX | 4204.11 | 4229.89 | 25.78 | 0.6% |
| VIX | 16.76 | 16.42 | -0.34 | |
https://www.federalreserve.gov/releases/z1/20210311/html/d3.htm
https://home.treasury.gov/system/files/221/TBACRecommendedFinancingTableQ22021-05052021.pdf
Payroll day
June 4, 2021
–Yields rose modestly in front of today’s employment report. Tens +3.2 bps to 1.623%. Curve steepened with twos up only 1.3 to 15.8. NFP expected 650 to 675k. Yesterday’s ADP was 978k and ISM Services were at a record high 64.0. The bond market has been tremendously resilient in the face of rising commodity prices, pockets of dislocation in stocks, and robust economic data. The 1.60% yield level has been like a magnet. However, as the June 16 FOMC meeting draws nearer, bringing the prospect of a modicum of restraint with respect to policy, I think a move to higher yields is probable. The “risk management” reason for extreme accommodation has been the possibility of a covid variant resurgence, which appears to be less likely as time goes on.
–July WTI (CLN1) is above $69 bbl this morning. Commodities generally remain in strong uptrends. Here’s how you’re going to know that inflation is NOT transitory. When Fed officials start blaming speculators for price increases. (Until then, they can keep discussing core Fed objectives of equality and climate change). Here’s an idea: how about doing something about the incredible pressure on short end rates due to massive excess reserves, a situation which is making some think that the low funding party will never end?
–New recent high in EDU1/EDU2 yesterday at 15.5, up 1 on the day. Also quite a bit of buying of put spreads vs call spreads in dollars, most notably a new buyer of approx 50k 2EZ 9900/9887.5ps vs 9925/9937.5cs for 0.5 to 1.0. Settled 1.25 with the put spread 5.0 and call spread 3.75, but the put spread is at the money, with EDZ2 settling 9900.5. I’m probably guilty of trying to fit these trades into my bias toward higher rates and a faster response by the Fed, but action on the eurodollar curve does seem to be moving slightly forward.
Bulls and bears
June 3, 2021
–Bull market: hacking for ransom. Bear market: NFTs. On the first topic, the FT has a headline, ‘Biden to rebuke Putin over hack of meat processor JBS.’ Oh good, I feel better now. On the second, I provide the link below with this interesting quote, “The NFT market has imploded over the past month, with sales in every single category almost entirely drying up.”
https://protos.com/nft-market-bubble-popped-crypto-collectibles-are-over
Perhaps the hackers are becoming a bit more discriminatory with regards to spending their ransoms. Maybe now they are prudently accumulating Soybean Oil (new highs). Or maybe global liquidity is drying up around the edges. ZH reports that the Fed intends to wind down the Secondary Market Corporate Credit Facility, or SMCCF, which “holds about $13.7 billion in already outstanding corporate bonds.” Given that the Fed is buying $120B in treasuries and MBS per month, shedding $13.7B into a frothy market should be a snap, and I am sure it will be. But even this change at the far margin is a symbol (finally) of some restraint out of the central bank.
–The ten year sees the 1.60% yield as a magnet, falling 2.4 bps yesterday to 1.591%. However, option trades in dollars were slanted to the downside (for higher yields). For example, a new buyer of 20k 2EZ 9900/9875/9862/9837 p condors for 4.75. Max profit on this trade occurs at expiration if EDZ3, which settled 99.055, is between the middle two strikes, i.e below 9875 and above 9862.5. That would be consistent with a FF target of 1.0 to 1.25% by December of 2023, but the options expire at the end of this year.
–This morning there is a buyer of 2EZ 9900/9887ps vs selling 9925/9937cs, paying 0.5 for 17k. This trade makes a max of 12 bps below the bottom strike of 9887.5. (thanks NovaSatus Trading and Pricing Monkey). Same idea as the condor above.
https://twitter.com/G65/status/1400375084930502656
While there have been a lot of put buyers further out the curve in blues and golds, these trades are moving the idea for potential hikes closer in time.
–ADP and Jobless Claims today expected 650k and 387k respectively. ISM Services 63.1. Yesterday 3-month libor finally edged a touch higher at 13.4 bps, but BSBY3m, the BBG bank funding index, sank to a new low of 8.805 bps. No signs of reduced liquidity there. In fact, EDM1/EDU1 three month calendar spread settled negative 0.5, a new recent low.
QE risks vs benefits
June 2, 2021
–The purpose of $120 billion per month in QE is to bring employment back to full capacity, which I suppose means that all service businesses that closed during Covid should be re-opened. At this point, QE appears to be a blunt tool, working against a counterforce of extended unemployment benefits. Yesterday Bullard said the US job market is tighter than it looks. We’ll get more information on Friday, as the employment report is released (NFP expected 650k). The gains on employment from additional QE appear marginal at best, however, downward pressure on money market rates is increasing due to QE, with $448 billion in RRP yesterday. Short rates continue to make new lows, with 3 month libor setting below 13 bps yesterday. Rock bottom short term yields are fostering speculation; moving investors further out the reddit risk curve. I would personally judge that benefits of QE are now completely outweighed by risks to financial stability that will ensue with an unwind of complacency. Perhaps some clues will come with today’s release of the Beige Book, exactly two weeks before the June 16 FOMC announcement.
–Are price pressures increased by continued hacks? Yesterday JBS beef plants were hit, with ramifications to US meat supplies. Security enhancements and redundancies are likely not transitory in nature. But if that’s conceptually hard to quantify, WTI prices above $68/bbl aren’t.
–The curve edged a bit steeper yesterday, with tens +2.9 bps to 1.615% and bonds +3.2 to 2.294%. Relatively quiet in dollars, though red/gold pack spread rose 4 bps to 162.25. In late March I marked this spread as high as 182.

