
Margin call
March 29, 2021
–Now it’s fallout from Archegos as Credit Suisse and Nomura warn of losses related to Friday’s fire sale position liquidation. As Kevin Spacey playing Sam said in the flick Margin Call, “Forty percent done by ten fifteen, by eleven o’clock all your trades have to be gone, because by lunchtime, word’s going to be out and by two o’clock you’re going to be selling at sixty-five cents on the dollar if you’re lucky. Then the Feds are going to be in here, up your ass, trying to slow you down.” Well, they didn’t quite achieve 65 cents on the dollar on the late stuff.
–ESM has given back a portion of Friday’s late ramp-up (now down 22). Fixed income barely reacting. On Friday, the ten year inflation breakeven (ten year yield vs inflation-indexed note yield) edged to a new high of 235.7 bps. Summers in a tv appearance Friday: “The idea that it [inflation] can’t rachet up quickly is just plain wrong.”
–While 2/10 spread is 6 bps off the recent high of 158, (as of Friday close), red/gold eurodollar pack spread is only 4 off the high of 177.125. Back end of dollar curve remains well offered, with golds closing -6 on Friday. The gold pack (avg EDM’25, U’25, Z’25 and H’26) settled 9788 or 2.12%.
Mark Twain market
March 26, 2021
–Tens ended unch’d yesterday, though the curve steepened as a couple of late +TY vs -WN blocks went through (details below). 10/30 rose 2 bps to 72.1. Steepening also apparent in the back end of the dollar curve with the blue back +0.625 and gold pack -1.625 (blue/gold pack spread is directionally correlated with 10/30).
–Chart attached shows that the dollar index pierced the 200 day moving average with the potential for further gains. Stocks staged a surprising rally from early morning weakness.
–ZH has a story citing the Financial Times that Credit Suisse is considering using its own capital to reimburse clients who lost money ($3 billion) in funds related to the Greensill collapse. In the “history often rhymes” category, some might recall that in May of 2007, Bear Stearns injected its own capital in two collapsed mortgage funds. Stocks took a modest dip after that news, before going on to make new highs. So….everything’s fine. Rumors of my demise are greatly exaggerated.
–News today includes the Fed’s favorite inflation indicator, Core PCE prices, which are expected +1.5. On a month to month basis Personal income expected -7.2 and Spending -0.8.
–April treasury options expire today.
BLOCKS:
+8536 TYM 132-00 vs -2087 WNM1 183-29
+12506 TYM1 132-03 vs -3036 WNM 183-30
Below is a very loose reference to Mark Twain riverboat stories…
Whip Inflation Now
March 22, 2021
–Turkey’s Erdogan sacked the head of the Central Bank Naci Agbal, because rates were too high. Here come capital controls. –Interesting video from 1978 featuring Jimmy Carter’s plan to stop inflation (I believe it was posted by Eric Peters of One River Asset Mgmt). It’s all about gov’t austerity: “The gov’t has been spending too great a portion of what the nation produces.”
–Contrasts couldn’t be sharper today. The US has the central banker Turkey would love…low rates forever. The US gov’t is spending as much and as fast as it can.
| Jimmy Carter-Anti-Inflation Program Speech (October 24, 1978)President Carter defines what America needs and what he plans to do in order to stop the progress of inflation.www.youtube.com |
–WIN, an acronym for Whip Inflation Now! was started by Gerald Ford in 1974. In 1978 it was still Carter’s number one problem. Not always transitory.
–Friday featured new curve highs with 2/10 at 158 bps and red/gold pack spread 177. Back end of the dollar curve was especially weak with blues and golds (4th and 5th years) down 5 to 5.5 bps even as tens closed close to unchanged. Peak one-year calendar is EDM23/EDM24 at 76.5 bps, up 6.5 on the week. EDU1/EDZ1 made a new high Friday at 7.5, even as EDZ1/EDH2 remains pinned to its recent low at negative 4. The market is already concerned about year-end pressure, which may have negative connotations for credit in general.–Treasury auctions twos, fives and sevens this week. Powell speaks today, and appears with Yellen in front of the House tomorrow.
Stubborn Authority
And though authority be a stubborn bear,
yet he is oft led by the nose with gold[s]
Comment – March 21, 2021
************************************************
Now is the winter of our discontent made glorious summer by this sun of York.
And so, it’ll turn out to be a one-time sort of bulge in prices. But it won’t change inflation going forward. Because inflation expectations are strongly anchored around 2%.
Every part of me looks at this and says this is insane. …I think you’re actually placing too much value on the work. I think we’re in some level of a bubble.
***
I’m starting with three quotes. The first is, of course Shakespeare from Richard III. I am not referring to this play to conjure comparisons to political intrigue at the level occurring on today’s geopolitical stage, though there are worthy parallels. I only start with it because the winter of 2020/2021 is over with the first official day of spring and I’m hopeful the covid winter is also behind us. (The title quote is from The Winter’s Tale).
The second quote is from Jay Powell’s FOMC news conference. As everyone in the markets knows, Powell isn’t inclined to budge on rates until he sees the whites of inflation’s eyes. But the above comment captures the absolute core of the debate occurring in markets: Is inflation transitory or gaining traction? Are expectations REALLY anchored at 2%? Gold Eurodollars think not.
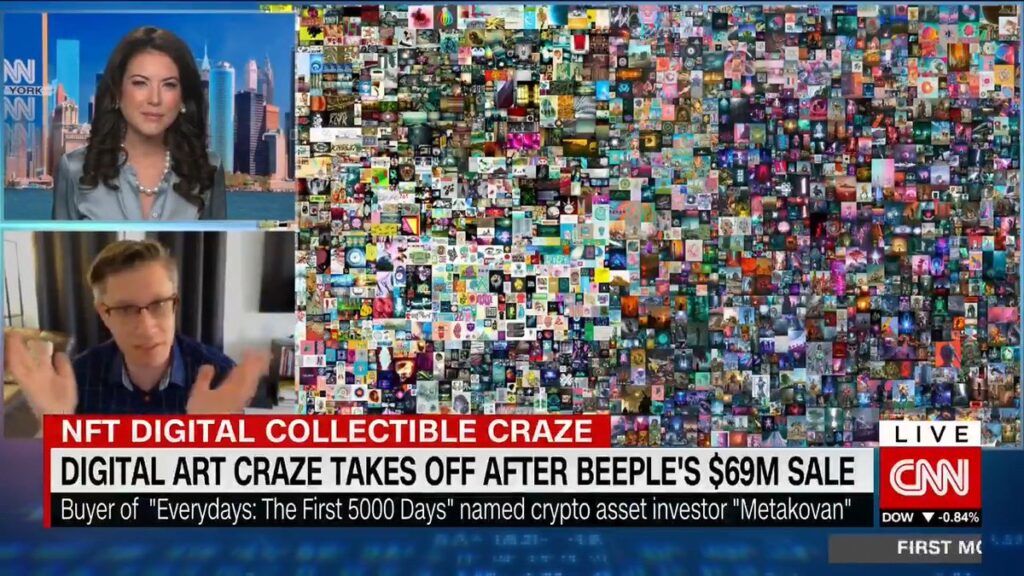
The final quote is, of course, a hedge fund manager excoriating his peers and calling stocks a bubble. No. Actually it’s not. It’s an opinion from the artist BEEPLE, whose digital work sold for $69 million. He was interviewed by Julia Chatterley on CNN. The link is below. I LOVE this guy, Mike Winkelmann. He is articulate, thoughtful and genuine; within a few minutes I got a much better sense of the world of NFTs.
***
I read Richard III in highschool. My English Literature teacher deconstructed this play and all of the characters and their relations to one another. She translated the meanings of some of the more complex passages. This class helped me appreciate English language and history and political psychology. Thank you Miss Schultz. Somehow I think coursework like this is no longer deemed important as it chafes against the equality narrative. It is.
At the margin, those who take issue with the idea of inflation expectations being firmly anchored have already had their way with the yield curve. As I noted during the week, the red/gold euro$ pack spread has moved with greater intensity and about the same magnitude as occurred during 2013’s taper tantrum. By definition, tantrums pass. I’m not so sure about this one.
Yields ended the week at new highs, with the five year at 87.6 bps (+3.1), tens at 172.6 (+9.4) and bonds at 244.8 (+4.9). On the week, the 5/10 treasury spread rose 6.3 bps to 85. However, 10/30 actually declined by 4.5 to 72.2. The fact that 10/30 eased should act as a potential warning signal that some aspects of the curve move have stalled. Steepening thus far has been fierce. However, on Friday the gold euro$ pack was still the weakest thing on the strip. EDZ’25 which had been featured in a couple of large block trades and is now the 3rd gold, ended the week down 15 at 9777.0! More on golds below.
What about the SLR? Well clearly it hit banks somewhat, with JPM tumbling 4% to 151.19 on the news that the Fed will let loosened regulations expire, before snapping back at the end of the day to close down only -1.6%. The biggest issue with the SLR decision is this: the US treasury has a LOT of bonds to sell, and the market is nervously wondering how they get absorbed. The last 7-year auction went poorly, and we have another one this week. These higher yields will likely attract buyers. Are they high enough? The Feb 25 auction went off at 1.195% with bid to cover of only 2.04. On Friday, the WI 7yr was 1.38%.
Look at the image below of curve steepening. In 2013’s taper tantrum I marked the move from late April to December at 142.5 bps to 305 for a total of 162.5. Eight months. The current magnitude of the move has been 146 bps starting from the “new framework Fed” in August. Seven months. In the 2013 episode, the Fed did not actually hike from zero (0-0.25%) until two years after the curve peaked. The first hike was in Dec 2015. In the current incarnation, the market also expects a hike in about two years. However, is there anything stopping the curve from running another 100 bps?? In 2013, I’m sure there was a bit of “pent-up demand”. But can it be anything like post-covid demand? In the wake of the GFC there was robust government spending with programs parceled out over a few years. Is it anything like today’s gargantuan spending? Back then the Fed’s balance sheet was exploding, from $2.92T at the start of 2013 to $4.0T by the end of the year. Since last August’s change in framework, the Fed’s balance sheet has exploded from $6.9T to a new high at $7.7T. What is going to arrest this move?
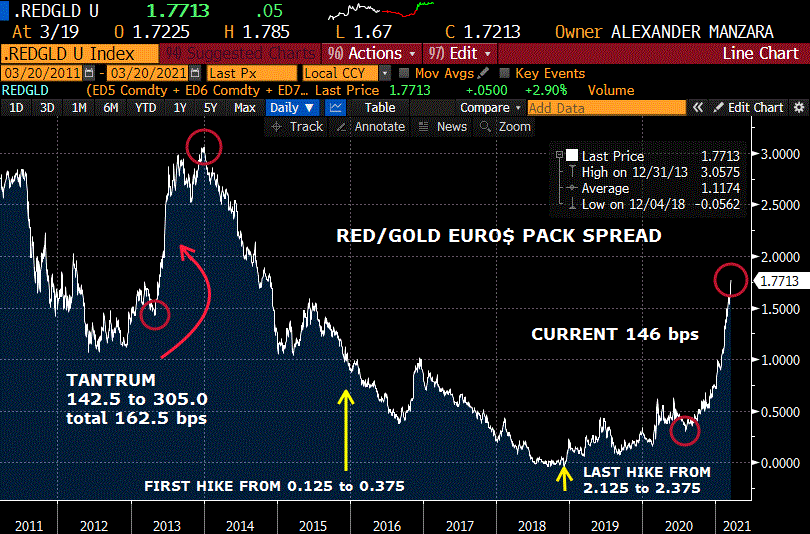
One other key note: On May 1, 2013, the 18th quarterly euro$ contract (2nd gold) was 98.245. By Sept 5, when the contract bottomed, it was 96.17, or 3.83%. With funds at 0.125%, same as now. On Friday, EDM’25, the 2nd gold, settled at 97.885 or 2.115%. Catch the falling piano.
During the Julia Chatterley interview Winkelmann outlines the inherent value of blockchain tokens across the economy. At the end Chatterley asks, “Did Beeple just call NFTs a bubble?” The response, “One Hundred Percent”. Is it just me or does he look a little bit like Powell in that picture?
This week features 2, 5 and 7 year auctions of $60 billion, $61 billion and $62 billion. Staggering numbers. Powell speaks on Monday, Tuesday and Wednesday. However, he was very clear, organized and eloquent in presenting his argument for transitory inflation. There is simply no reason to forecast a change in tone. Although there are a lot of Fed speakers over the week, Tuesday is likely the most important, with Powell and Yellen in front of the House and Brainard also speaking.
OTHER MARKET THOUGHTS/ TRADES
The peak one-year ED calendar on the curve is now 76.5 bps, EDM23/M24 up from 70 bps last week. The only inverted spread is EDZ1/EDH2 at -4.0, a sign that credit concerns could yet bubble to the surface.
Comments last week were pretty much on the mark, if not conservative regarding new inflation projections. About the dots I wrote…
All wrong. All of them. All too low, starting in 2021. There is talk that some dots will move up, given the vaccine progress and stimulus, and that investment committees will convene and, in careful consideration and deliberations will react to this change in official circumstances… by puking bonds. I wouldn’t be surprised to also see Core PCE Inflation projections move up by 1/10 each in 2021 and 2022. [Core PCE projections were actually adjusted upward by 0.4 in 2021 to 2.2 and 0.1 in 2022 to 2.0]. The question is whether the existing shorts will take such an opportunity by covering some positions, or whether they will press. I expect the latter.
On the curve I wrote:
On 5-March, red/gold euro$ pack spread ended at 157, a new high. I suggested targeting 175 to 185. On Friday this spread (which will now be the old red, vs old gold pack, as March contracts roll forward) settled 162.625.
Red/gold pack spread actually settled 177.125 on Friday, in the target area.
From last week:
FFN1/FFN2 settled 2.0. No one thinks the Fed can hike by June 2022. I do; it’s 15 months away. For comparison, FFV1/FFV2 which I had recommended buying for 3, settled 8 on Friday.
FFN1/FFN2 settled 5.0.
| 3/12/2021 | 3/19/2021 | chg | ||
| UST 2Y | 14.9 | 14.7 | -0.2 | w/I 15.5/15.0 |
| UST 5Y | 84.5 | 87.6 | 3.1 | w/I 90.0/89.5 |
| UST 10Y | 163.2 | 172.6 | 9.4 | |
| UST 30Y | 239.9 | 244.8 | 4.9 | |
| GERM 2Y | -68.7 | -69.5 | -0.8 | |
| GERM 10Y | -30.6 | -29.4 | 1.2 | |
| JPN 30Y | 68.7 | 66.7 | -2.0 | |
| CHINA 10Y | 325.9 | 323.7 | -2.2 | |
| EURO$ M1/M2 | 9.0 | 9.5 | 0.5 | |
| EURO$ M2/M3 | 45.5 | 44.0 | -1.5 | |
| EURO$ M3/M4 | 70.0 | 76.5 | 6.5 | |
| EUR | 119.55 | 119.07 | -0.48 | |
| CRUDE (active) | 65.61 | 61.42 | -4.19 | |
| SPX | 3943.34 | 3913.10 | -30.24 | -0.8% |
| VIX | 20.69 | 20.95 | 0.26 | |
http://creditbubblebulletin.blogspot.com/
Countertrend?
March 19, 2021
–Yields jumped yesterday with tens up 9.6 bps to 1.728% at futures settle. Curve made new highs with 2/10 up 6.6 to 157. Red to gold euro$ pack spread (2nd to 5th year) also rose just over 6 bps to a new high of 172 bps. It has been a dramatic yield increase in the past one and a half months. For example, EDU25 (the second gold) was 9875.5 on February 1, and settled 9794 yesterday, over 80 bps. But it’s still only just over 2%, in a world awash with liquidity where commodity prices have been surging. Philly Fed prices were 75.9, the highest since 1980. The main index was 51.8 from 23.1, the highest since 1973. Even if these numbers are outliers, the trend in other data has been in the same direction.
–At settle, CLK1 was down 4.57 to 60.06, with many pointing to renewed covid lockdowns in Europe as the catalyst for profit taking after a torrid rally from Feb thru mid-March. This rally had corresponded with the rise in yields, so a countertrend rally in US fixed income wouldn’t be surprising.
–BOJ widened the bands for long term yields from 20 bps to 25 bps, and tapered guidance on ETF buys. Kuroda: “…we will ensure any moves won’t diminish the impact our yield curve control policy has in stimulating the economy.” Reassuring.
–Equity option expiration today. Nasdaq featured a 3% dump yesterday, though it’s still above levels from earlier in the month, so the burden of proof still falls on the bears at this point.
Trying to square inconsistencies
March 18, 2021
*POWELL: RATES WERE AT ZERO FOR 7 YRS WITHOUT FINANCIAL EXCESSES
….not with wartime gov’t spending!!!
–Powell will be gone in February. I didn’t watch the press conference, so I am just relying on projection materials and dots, and it seems as if squaring the actual projections with the idea of keeping funding rates at zero would be a magical task. In December, the projection for PCE inflation was 1.8 for 2021. Yesterday it was bumped up to 2.4! Core PCE inflation from 1.8 to 2.2%. GDP from 4.2 to 6.5. Unemployment from 5.0 to 4.5. The Fed is projecting a [temporary] boom. If these estimates are anywhere NEAR correct, and the Fed attempts to hold FF near zero, then long rates will surge. The projection materials indicate conditions for ‘liftoff’ by the end of THIS YEAR. As market lore says (most recently Bianco) the Fed stays the course until something breaks, which is what occurred at the end of 2018. As soon as Powell is replaced as chair, the Fed will be raising rates, if not sooner.
https://www.federalreserve.gov/monetarypolicy/files/fomcprojtabl20210317.pdf
–Don’t take my word for it. Look at the net changes at the back end of the euro$ curve (4th and 5th years, blues and golds)
blues:
EDM4 9866.0 +4.0
EDU4 9850.5 +3.0
EDZ4 9836.5 +2.0
EDH5 9824.5 +0.5
then the golds…same magnitude, opposite sign
EDM5 9813.5 -0.5
EDU5 9803.5 -1.5
EDZ5 9792.0 -3.0
EDH6 9783.0 -4.0
All of the back one-year calendar spreads rose at least 4.5 bps. Of course, 5/30 leapt to a new high of 166.5 (at futures close) up 10 bps with fives down 5.3 bps to 77.1 and thirties up 4.7 bps to 243.6. Unsurprisingly USM is printing new lows as of this writing at 153-28. The recent dynamic is that a steeper curve weighs on tech, so Nasdaq may see additional pressure that could stem selling in the long end. It will likely be a seesaw pattern lower for both, and quite difficult to maintain core shorts. But something is going to “break”.
–EDU1/EDU2 settled 12.5. From this, we might call the odds of a 25 bp hike 50/50 within that time frame. The peak one-year calendar is EDM23/EDM24 at 71.5, which has the added feature of straddling the end of libor, so saying that this spread projects 3 hikes over that time frame isn’t quite right. The point is that Powell has sort of boxed himself in, while the dots indicate that not all members agree with the “zero forever” mantra.
Equity in Household Real Estate Growing
March 16, 2021
–Rate futures retraced a part of Friday’s sell off, with tens down 2.5 bps to 1.607%. Large trade in dollars was a buy of about 45k 0EU 9962.5p for 7.5 covered 9967.5 with 40 delta. Settled 7 vs 9968.0; the straddle settled 19.5. I looked back to September of last year (prior to the libor extension announcement), and the 0EU 9975^ was the exact same price, 19.5, with 6 months of additional time value. Clearly premium is reflecting a much healthier distrust of certainty for the path forward, though vol eased slightly yesterday. The underlying contract on the 0EU put buys is EDU’22, which expires in 18 months. It’s highly unlikely that the FOMC meeting tomorrow could signal tightening in that time frame, however, it is completely plausible that forecasts for 2023 move higher.–Today’s news includes Retail Sales, expected -0.7%.
–The NY Fed released a Credit Survey (SEC Credit Access) which noted,
The The mortgage refinance application rate reached a new series high of 25 percent (of households with a mortgage), up from 16 percent in October 2020.
· The overall rejection rate for credit rose slightly from 18 percent to 19 percent, the highest reading since October 2018. Rejection rates for new credit card applications and for requests for credit card limit increases reached new series highs, while those for auto loans were at a series low. Mortgage refis likely to slow with the move to higher rates. It’s somewhat interesting that credit rejections are increasing even as the economy re-opens.
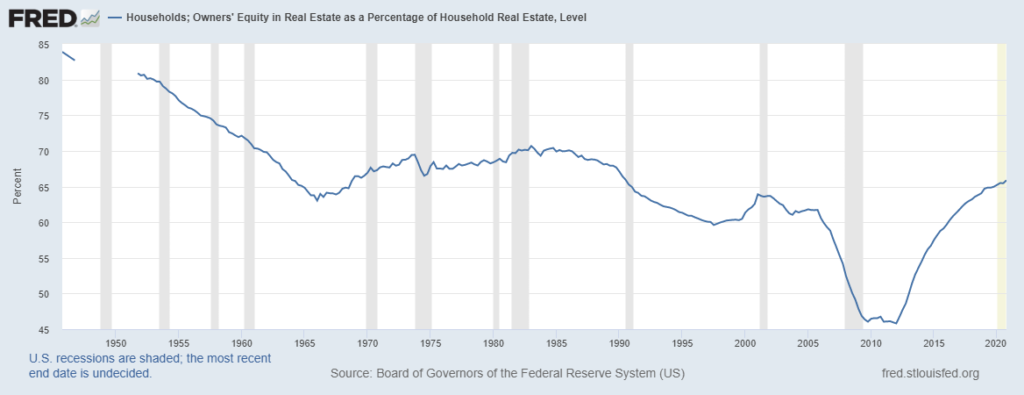
–I’ve attached a chart which I find surprising: Households: Owners Equity in Real Estate as a % of HH Real Estate. This chart shows equity at over 65%, the highest since 1990! This is an indication that leverage in the Household sector in aggregate isn’t all that high. In fact, the home ownership rate at 65.8% is higher than it was in the 1990’s, though below the peak of 69.2% in 2004.
The Ides
March 15, 2021
–Strong China economic data due to low base year-ago data. Industrial output +35% and Retail Sales +33.8%. In the US Goldman has raised its GDP forecast to 8% in 2021, and calls for an unemployment rate of just 4% by the end of the year. It’s little wonder that analysts are expecting the Fed to increase projections on growth, and for the ‘dots’ to reflect a more aggressive timetable for a hike.
–On Friday, tens jumped 10.9 bps to 1.632%. The new red/gold pack (using June as first contracts) surged 8 bps to nearly 163.5, as the gold pack sank 11.625. The thirty year bond yield ended at 2.4% having doubled in yield since August. Fortunately, mortgage and corporate yields remain tight, because a doubling of interest servicing costs could send some shivers through financial markets…at some time in the future. Implied vol surged in treasuries, with atm TYJ 131.75^ settling 1’10, just over 6.1 using 12 dte.
–Retails sales tomorrow expected -0.7%. I’ve seen a bunch of headlines citing Stripe’s valuation at $95 billion. This is an online payment processing company, and that valuation puts it in the neighborhood of American Express ($120b) and about triple DFS (Discover). Of course, V, AXP and DFS are all at all-time highs.
–RIP Jack Sandner, former CME Chairman. That picture shows the ED pit, from the options (at left, cut off) to reds, greens and blues all the way in back. As it’s close to St Patrick’s Day, I’ll never forget when Jack was giving a floor tour to the Irish Prime Minister, (I believe Mary Robinson) and the O’Callaghan brothers got a picture with her. One of their acronyms was IRSH, short and jovial with thinning sandy reddish hair. Don’t think I’ve ever seen anyone happier in a photo op!
/cdn.vox-cdn.com/uploads/chorus_image/image/68959267/Jack_Sandner.0.jpg)
Holy Frijoles
March 13, 2021 – Weekly comment
I saw three headlines this week that I am trying to wrap my head around. First, Household Net Worth was reported to have ended 2020 at a record $130.155 trillion, up by a whopping $6.9T in Q4. Annual GDP is only $21.5T. This net worth figure comes from the Fed’s quarterly Z.1 report (link below). Then, there is the story about a piece of digital art, “Everydays – The First 5000 Days”, by the artist “Beeple” that sold at Christie’s for just over $69 million dollars. Finally a friend sent me an article about Taco Bell launching a collection of crypto art NFTs for $1 each to celebrate the return of potatoes to the menu, some of which are now selling for thousands of dollars on, what we in the business refer to as, ‘the secondary market’. No, the potatoes aren’t selling for thousands. The NFTs. BC suggested I use the Taco bell bit in my missive. He was joking. I am not.
https://www.businessinsider.com/taco-bell-potatoes-return-celebrated-with-nft-crypto-collectibles-2021-3

When I was a kid, I had a piggy bank. Mine wasn’t a pig though, it was a cast metal horse, with the coin slot in the middle of the saddle. I still have it, somewhere. Later, my mom took me to the bank to open a savings account. Pretty exciting day, going to the teller window in Berwyn with cash, and getting a little passbook back showing my name and deposit. It was probably less than twenty dollars. That’s money to be put aside. Money that you can’t spend now, that you can’t really get at easily.
Now, I must assume that someone lists their digital artworks as ‘assets’ and that ‘assets’ are a part of household net worth calculations, offset by liabilities or loans. So, I buy a piece of taco bell crypto art for $1. Sell it for $1000, and the clown that bought it lists it as an asset of $1000. My wealth has increased. The aggregate net worth of the US Household Sector has risen. Can I possibly be framing this correctly? If Christie’s is selling this crap for $69 million, I think I am.
Ok, back to the savings account and the markets of today. My working theory is that savings are dollars held aside today for future consumption. There has to be a price, a benefit, in delaying immediate spending. Otherwise, the incentive is to go find the next NFT or digital sports clip and spend some stupid amount for it. My conclusion, therefore, is that the price of withholding savings for future consumption is too low. By a lot.
Let’s bring it back to the markets. Bond futures settled at new lows on Friday. The yield on the 30 year treasury ended at 2.4%. Investors, or savers, put money into bonds in a delay of present spending. That yield, although its recent ascent is being looked upon with trepidation in institutional money markets, is too low. Not only that, if our previously mentioned ‘investor’ borrowed money on his credit card to buy his NFT, and if he sees that similar works are now trading for $1500, his net worth has increased by $500. He has an asset valued at $1500, with a liability of just $1000. Of course, that debt, backed as it is by an NFT, is someone else’s [worthless] asset.
At this point, I figure it’s appropriate to add a definition of NFT, which I got from google:
An NFT is an asset verified using blockchain technology, in which a network of computers records transactions and gives buyers proof of authenticity and ownership.
Just because you use blockchain technology to verify that you own a piece of sh-t, doesn’t make it any more valuable. Just so that you don’t think I’ve gotten [more] stodgy, here’s another feel good story:
Rapper Azealia Banks sold her audio sex tape with her fiancé Ryder Ripps for $17,000 as an NFT, or a non-fungible, token, which essentially allows individuals to sell digital objects as one-of-a-kind via cryptocurrency. Now, the sex tape is being resold for over $260 million.
This, from a site called Insider, which I have linked below. I think it’s real. It’s on the internet. A friend sent me a chart that was from Gundlach’s Doubleline presentation. Investment grade debt in real terms is negative. (Thanks MJ). From 2015 through 2018 this real yield was positive, ranging from 1.5 to 2.0%. Investment grade borrowers are essentially being paid to borrow. That’s what a negative real rate means. Any ramifications to growth, or perhaps, froth in speculative assets from that?
OK, so I have a proposal, we start a SPAC which invests in NFTs. The portfolio of NFTs is to be highly diversified including pieces of art, sports clips, and the occasional sex tape in the name of inclusivity. Though some of the assets may be of dubious value, they are all unassailably backed by blockchain technology, so the ratings agencies feel compelled to list our bond offering at AA. And we can borrow at LESS THAN THE RATE OF INFLATION. I think we can christen this new enterprise under the “HowYaLeft” name. Of course, I already own howyaleft.com which I would be happy to part with… for a tidy sum. I will transfer ownership to the SPAC. However, I want to be paid in GOLD. *Other partners in side conference: “Can you believe it? This idiot is willing to exchange digital assets for gold” *
***
Another couple of interesting tidbits from the Z.1 report. In 2007, Household Home Mortgages topped at $10.625 trillion. At the end of 2020, we’ve finally just surpassed the amount of HH Mortgage debt outstanding, at $10.935 trillion. Houses are worth a lot more these days, so of course that contributes to the increase in HH Net Worth, given stagnant mortgage debt. Now, for the sake of comparison, let’s take a look at Federal Gov’t Debt. In 2007, it was $6.074 trillion, less than 2/3rds mortgage debt outstanding. At the end of 2020, it is $23.621 trillion, more than twice mortgage debt outstanding. When we see that mortgages are tight to govies, there might be a good reason, even ignoring the Fed hoovering up MBS. Take a look at your elected officials. What’s more risky, a mortgage backed by a house, or lending to the House?
Once again, we look at Friday’s midcurve option expiration, with Blue March midcurve puts having expired with 907k open interest, which now goes away. Blue midcurves weren’t all that popular a year ago. Of course, just over one year ago, in the month of February 2020, the red pack to blue pack spread (2nd year forward to 4th year forward) averaged just above 11 bps. On Friday, reds to blues were over 121 bps, a new high. So there has been quite a bit of steepening. In fact, it was October of last year that featured a lot of the initial interest in buying blue March (3E) put structures. One dilly was the October 9, 2020 buy of the 9900/9912ps vs 9975/9987cs, paying 0.25 for the put spread in 50k ref EDH’24 price around 9946. This wound up trading well over 100k, adding a big chunk to 3EH OI. EDH’24 settled Friday at 9875. 3EJ, K and M on EDM’24 now have 1.475 million puts combined, and 3EN, Q and U on EDU’24 have over 800k.
The peak one-year ED calendar on the curve is 70 bps, with EDH23/H24 and EDM23/M24 tied at that level. These are new highs. Typically, one-year calendars widen in an environment of the Fed easing from a high FF starting point: near contracts swiftly fall in yield in reaction to cuts and expected cuts, while deferred yields fall much less quickly. Now the forward one-year calendars are rising for the opposite reason: expected future rate hikes. The Fed generally cuts faster than it hikes. So 70 bps is high for a far forward one-year calendar. If one were to assume the 2004/06 guide of 25 bps hike per FOMC meeting, with eight meetings a year, then 200 bps in a year is doable. But the market never prices certainty of all hikes. On the other hand… Taco Bell NTFs. It’s time to start thinking about the odds of a 50 bp hike in one shot in the not-too-distant future. Chalupa.
This week features Retail Sales on Tuesday, and the FOMC announcement and press conference on Wednesday.
OTHER MARKET THOUGHTS/ TRADES
At December’s FOMC, the projection materials have the following dot plots. In 2020 and 2021 all dots are at 12.5 bps. In 2022 one errant member indicated a hike, with one dot at 37.5 bps and the rest at 12.5. In 2023, there are 12 dots at 12.5, 3 at 37.5, 1 at 62.5 and the black sheep (who sees what’s actually happening), at 1.125. All wrong. All of them. All too low, starting in 2021. There is talk that some dots will move up, given the vaccine progress and stimulus, and that investment committees will convene and, in careful consideration and deliberations will react to this change in official circumstances… by puking bonds. I wouldn’t be surprised to also see Core PCE Inflation projections move up by 1/10 each in 2021, to 1.9, and 2022, to 2.0. The question is whether the existing shorts will take such an opportunity by covering some positions, or whether they will press. I expect the latter.
| 3/5/2021 | 3/12/2021 | chg | ||
| UST 2Y | 13.9 | 14.9 | 1.0 | |
| UST 5Y | 78.4 | 84.5 | 6.1 | |
| UST 10Y | 156.7 | 163.2 | 6.5 | |
| UST 30Y | 229.0 | 239.9 | 10.9 | |
| GERM 2Y | -69.0 | -68.7 | 0.3 | |
| GERM 10Y | -30.2 | -30.6 | -0.4 | |
| JPN 30Y | 66.9 | 68.7 | 1.8 | |
| CHINA 10Y | 324.9 | 325.9 | 1.0 | |
| EURO$ M1/M2 | 7.0 | 9.0 | 2.0 | |
| EURO$ M2/M3 | 45.5 | 45.5 | 0.0 | |
| EURO$ M3/M4 | 68.5 | 70.0 | 1.5 | |
| EUR | 119.13 | 119.55 | 0.42 | |
| CRUDE (active) | 66.09 | 65.61 | -0.48 | |
| SPX | 3841.94 | 3943.34 | 101.40 | 2.6% |
| VIX | 24.66 | 20.69 | -3.97 | |
https://www.federalreserve.gov/releases/z1/20210311/html/b1.htm
https://www.businessinsider.com/taco-bell-potatoes-return-celebrated-with-nft-crypto-collectibles-2021-3
https://www.insider.com/azealia-banks-ryder-ripps-nft-sex-tape-resold-275-million-2021-3
Honing my reasoning skills
March 12, 2021
–Tens settled essentially unchanged and bonds slightly lower as the Treasury completed the 30y leg of the auctions. Post-auction, there was a buyer of some 70k EDZ22 at 9958.5 and a block buy of 4k USM 158-06. While there was a temporary boost from these buys, it didn’t last. As of this writing USM is 1.75 points lower at 156-13 and EDZ2 is 9955.5. One contact noted that EDZ2 buys could be flattening short deltas from a large long put spread/short call position. In any case, EDZ2 was the peak volume across the ED curve with just over 400k traded. EDU2 was next closest at 323k, all else below 300k. Z2 open interest rose 29k; it would have fallen if it were pure short covering of futures. Apart from market stats like volume and open interest, the message is that large buys were faded; what appeared to be a big sigh of relief, having gotten thru CPI and auctions, looks much more tentative now with USM trading near the low for the entire move.
–Today’s news includes PPI with Core yoy expected 2.6%, and U of M inflation surveys. Last time the 1-yr was 3.3%, highest since 2014, and the 5-10 yr was 2.7%, which equals the high from 2016 and 2020. It might be worth noting that CLJ1 settled 66.02, just 7 cents shy of the high settle this month and less than $2 away from the March 8 high tick of 67.98. I don’t know the window for the UofM survey, but the 3/1 close for CLJ1 was 60.64, and the price-at-the-pump increase in the Chicago area is noticeable in the past few weeks, as is the general pick up in traffic.
–One last note is that the ten-year inflation breakeven ended at a new high yesterday of 228 bps. I am not sure if tips are reacting to Fed buying or if there are other anomalies, but others had cited the 5-yr breakeven having pierced 250 bps last week. The FT is all over it with this headline: ‘US bond market signals expectations for shortlived burst of inflation’. I am personally getting a bit sick of the argument that inflation can’t possibly be sustained with slack in the labor force (though I don’t know if the FT is making that case since I didn’t read the article). We are all aware of the phenomenon of pricing power returning when weak competitors fail. When I think of finely crafted and well-reasoned arguments, I invariably fall back to Cliff Clavin in Cheers:
“Well ya see Norm, it’s like this: A herd of buffalo can only move as fast as the slowest buffalo. And when the herd is hunted, it’s the slowest and weakest ones at the back that are killed first. This natural selection is good for the herd as a whole because the general speed and health of the whole group keeps improving by the regular killing of the weakest members. In much the same way, the human brain can only operate as fast as the slowest brain cells. Excessive intake of alcohol, as we know, kills brain cells. But naturally, it attacks the slowest and weakest brain cells first. In this way, regular consumption of beer eliminates the weaker brain cells, making the brain a faster and more efficient machine.
That’s why you always feel smarter after a few beers.

