
Lane change
April 11, 2021 – Weekly Comment
*****
The snippet below is from Tyler Neville of Blockworks:
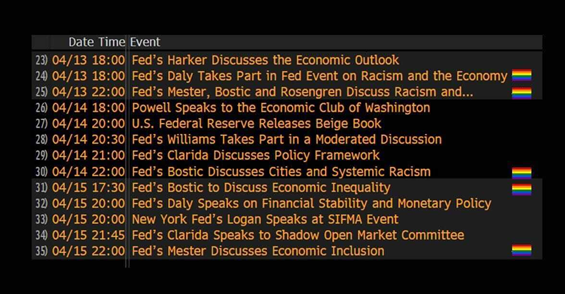
Here are the speaking events for the Fed next week.
This is an absolute CLOWN show.
For 12 years, the Fed ignored any signs that QE was causing a gap in inequality between capital and labor.
Now, all of a sudden they are experts on inequality and systemic racism?
In many Congressional appearances, especially during the Trump years, Powell constantly reminded his audience that the Fed “stays in its lane” with regard to monetary policy, concentrating on the dual mandates of full employment and low inflation. Just this week, four of the twelve regional Fed Presidents will be discussing racism and economic equality/inclusion. Not included on the list above is Kaplan’s appearance on the 16th at a Virtual Climate Change Symposium.
The late 1970’s were the most equal years regarding wealth and income distribution. That was also a period of high inflation. Clearly, the institutional thinking of the central bank has shifted to the idea that higher inflation results in more equality with respect to economic outcomes. However, they’re working overtime (time-and-a-half) to convince the public that price increases are transitory. Markets aren’t so sure.
On August 27 of last year, Powell announced the change in the Fed’s policy framework to incorporate FAIT, flexible average inflation targeting. On the employment side, the Fed would henceforth assess “shortfalls” from maximum employment rather than “deviations”. In a Jan 31, 2021 speech, Brainard explained it this way:
In other words, the new framework calls for policy to address employment when it falls short of its maximum level, whereas the previous framework called for policy to react when employment was judged to be too high as well as too low.
Markets noticed. As the chart below of the 2/10 treasury spread reveals, the curve has been steepening ever since the change in framework. The Fed succeeded in changing market sentiment regarding inflation, a sentiment which has now been reinforced by the huge fiscal and monetary response to the covid crisis, (which has now turned the corner). The public’s mentality is now buy and hoard.

Over the past week, the curve flattened a bit as yields retreated from highs set the previous week. The five year yield dropped 10.6 bps to 87, while tens fell over 5 bps to 166.6. This, in spite of a record high Service ISM release of 63.7, a huge Consumer Credit number of $27.5 billion, and yoy PPI of 4.2%. When a market absorbs bearish news without going lower, it is often a bullish sign. However, this week will bring further challenges in the form of supply, with 3s and 10s auctioned on Monday, followed by 30s on Tuesday. According to TBAC, auctions this week will raise $59 billion in new cash. In the following couple of weeks, the 20y will be auctioned on 4/21, 5y TIPS on 4/22 and 2s, 5s, 7s on April 26 and 27. These auctions are raising $130 billion in new cash. Even with the Fed buying $80 billion in treasuries per month, this increase of $190 billion of new cash could cause a bit of indigestion.
On top of that, BofA is expecting a monster retail sales number of 11% on Thursday as outlined on ZH. CPI is released on Tuesday, expected 2.5% yoy with Core at a tame 1.5%.
Powell is appearing on 60 Minutes this evening, where he will likely parrot the mantra of transitory inflation due to base effects and one-off changes in consumer preferences. However, he will almost certainly swerve into economic equality lanes and use the climate change ramp to take other detours which weren’t overtly mentioned in the Fed’s framework change, but have now been included, notwithstanding. Will markets conclude the Fed is trying to do too much?
OTHER MARKET THOUGHTS/ TRADES
There were a couple of large trades worth note. On Friday, a new buyer of 7250 long Green pack 100 call strip for 17.0 up to 19.0 EDM3 100c settled 3.0, U3 at 4.0, Z3 at 4.5 and H4 at 5.5, so the strip settled 17.0. These options expire with the underlying futures, i.e. EDM3 100c has 798 days until expiry on June 19, 2023. It’s all vol. Both EDH3 and EDM3 have huge open interest in 9975 and 9987.5 c strikes (H3 9975c 400k and 9987.5c 200k, EDM3 9975c 102k and 9987.5c 155k) so these 100c buys might just be the start of an upside cap of risk. If the trade were more of a forecast of impending disaster, the long red pack 100c strip would be the better bet, settling at 5.25 (M2 1.0, U2 1.25, Z2 1.25 and H3 1.75).
A much larger trade was a buy on Friday of 200k July VIX 25/40 call spreads for 2-2.15. Said to be greater than $40 million in premium. While spot VIX has eased down to 16.69, July VIX futures closed 23.16, with the 25c at 3.50 and 40c 1.37. For the sake of comparison, June VIX futures are 22.23, the June 25c at 2.65 and 40c at 1.05, so 1.60 in the call spread vs 2.13 for July.
BABA was fined $2.8 billion for antitrust violations by the Chinese government. As one twitter commentator noted, that’s almost 5% of top line revenue. While this action is almost certainly just a specific clampdown targeting Jack Ma, governments worldwide are likely hearing an echo of Willie Sutton’s reply when asked by a journalist why he robbed banks: “because that’s where the money is.”
The risk is that a sudden reversal of fortunes in big tech could cause an abrupt halt to the rise in treasury yields. It’s instructive to look back at 1987. From January to October of 1987, the ten year yield went from 7% to 10.25%. From the start of 1987 until late August (when stocks topped, having taken notice of rising yields), SPX rose 39%. From the start of September in 2020, the low in the 10y yield following the Fed’s framework change was 64 bps. Seven months later, at the start of April, it reached 1.74%. Still low, but on a percentage basis it’s a MUCH larger move than 1987. Stocks have yet to take notice and SPX since a dip in last September is up 28%. There’s probably more life in major stock indices. Which likely means that yields will again push to new highs.
| 4/2/2021 | 4/9/2021 | chg | ||
| UST 2Y | 18.4 | 15.5 | -2.9 | |
| UST 5Y | 97.4 | 86.8 | -10.6 | |
| UST 10Y | 172.0 | 166.6 | -5.4 | w/I 166.7 |
| UST 30Y | 236.3 | 233.9 | -2.4 | w/I 234.2 |
| GERM 2Y | -70.8 | -70.2 | 0.6 | |
| GERM 10Y | -32.8 | -30.3 | 2.5 | |
| JPN 30Y | 69.3 | 67.6 | -1.7 | |
| CHINA 10Y | 319.9 | 321.0 | 1.1 | |
| EURO$ M1/M2 | 14.5 | 10.0 | -4.5 | |
| EURO$ M2/M3 | 52.5 | 44.0 | -8.5 | |
| EURO$ M3/M4 | 77.0 | 73.0 | -4.0 | |
| EUR | 117.60 | 119.02 | 1.42 | |
| CRUDE (active) | 61.48 | 59.32 | -2.16 | |
| SPX | 4019.87 | 4128.80 | 108.93 | 2.7% |
| VIX | 17.33 | 16.69 | -0.64 | |
https://home.treasury.gov/system/files/221/TBACRecommendedFinancingTableQ22021-02032021.pdf
https://www.zerohedge.com/economics/stimmy-bonanza-here-comes-another-blockbuster-retail-sales-print
Base effects
April 9, 2021
–Yields ground to slightly lower levels yesterday with tens down 2.3 bps to 163 and TYM settling exactly at 132-00. Comments by the NY Fed’s Lori Logan about aligning the Fed’s purchases with outstanding issues caused a late bid in 20’s, as it’s now expected the Fed will announce an increase in buying there. However, all treasury futures are slightly lower this morning.
–PPI is released today with CPI out next week. I believe yoy is expected 3.8% with Core 2.7%. Base effects are expected to provide strong price increases, whether they are temporary or not is the question of the day. To give an example of base effects, BMW reported Q1 sales up 33%. Not only is it a huge surge, but it was the company’s best Q1 ever. Mercedes also reported blockbuster sales. I saw an article about a private jet shortage. Lumber and corn made new high settles yesterday. Articles abound about a lack of skilled labor.
–A couple of large trades of note: early yesterday there was a buyer of 30k 4EN 9775/9750/9725/9700 put condor for 5.5. Max loss on this trade is the 5.5 paid, max gain is 25 less the 5.5 paid, or 19.5 if underlying EDU5 is between 9750 and 9725 at expiry in mid-July. I have attached a chart of EDM5, currently the first gold, because by July, EDU25 will have rolled to the 1st gold position. If prices remain in a downward sloping channel, then by mid-July we’ll be around the 9725 strike. Voila!
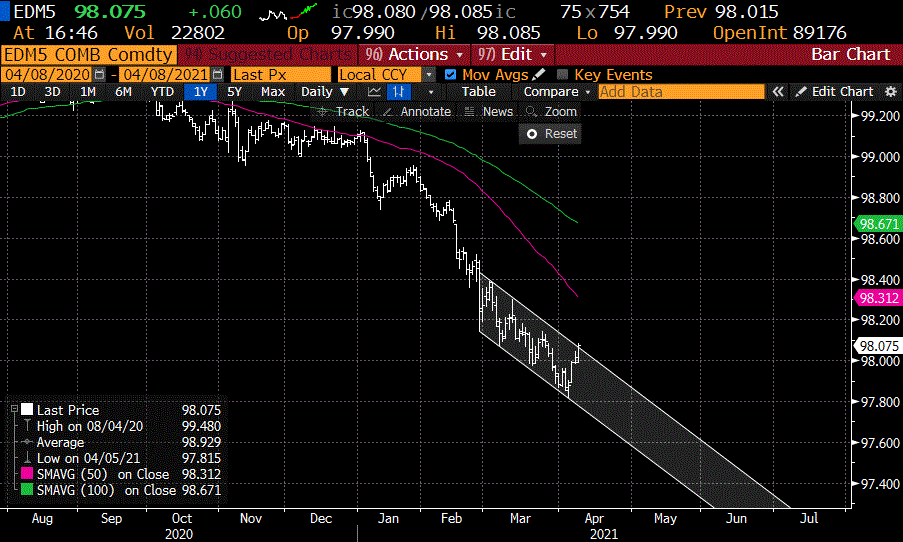
–There was also a large VIX option trade, +200k July VIX 25/40cs reportedly for 2.00 to 2.15. Approx $40 million in premium. Spot VIX is around 16.85, while the July future ~23.00. Obviously the roll is a headwind for the trade, but the recent decline in VIX is perhaps indicative of a bit too much complacency given global tensions with Russia/Ukraine, China/Taiwan, Israel/Iran and the simmering issue raised by the state of Georgia trying to tighten up voting rules with the possibility of open hostility between Meghan McCain and Whoopi Goldberg. :-/
Resistance FOMC high, support NFP low
April 7, 2021
-Yields fell yesterday in a continuing rejection of Friday’s employment data. Tens fell over 6 bps to 1.654%. Friday’s top tick in TYM was 131-20, now trading 131-25. Red/gold euro$ pack spread closed at a high of 182 last week, yesterday it fell over 8 bps to just under 171. Bearish news, including the surge in both ISM Mfg and Services and in the employment data, has been absorbed by a market that had apparently already priced in the strong releases. Today FOMC minutes are released. At the last FOMC, EDU3 settled 9914.5, now 9902.5. EDU4 settled 9850.5, now 9835.5 and TYM at 132-03, now 131-22 (at yesterday’s settle). Rate futures pretty much sold off after the last FOMC; highs from that day should provide strong resistance.
–Fallout still being felt from the Archegos liquidation. Various estimates have put the portfolio at $100 billion, capitalized with about a tenth of that. Many of the stocks publicized in the Archegos portfolio dropped by about half, so call it a max of $50 billion lopped off the top value. CS has taken a hit of $4.7 billion, about 10% of the drawdown. I guess it’s not that big of a deal when one considers that a move of less than 2.5% in just AAPL alone is over $50 billion.
–Treasury vol held up pretty well in the rally, with the atm TYK 131.75 straddle settling 1’02 or 4.5 with two and a half weeks left. EDH24 is the last green. The atm long-dated straddle on that contract is the 9862.5 strike as the underlying settled 9858.5, and it settled 98.5 with 1077 days to go. On Friday the 9850 straddle which was at the money, settled 101, the first time I saw the last green straddle over 100 bps in a long time!
Service ISM at new high
April 6, 2021
–SPX and DJIA at new record highs yesterday, not Nasdaq or R2K. Yields eased from Friday, though Service ISM at 63.7 made a new high, at least since 1998 which is as far as BBG data went back. Ten year yield was down around 0.5 bp to 1.716%. Volume in rate futures was subdued. Implied volatility bled, with TYM now 4.7 from over 5 at the end of the week. Though WTI dropped $3/bbl yesterday, it held the low of the range in March so far and has rebounded to 60.30, up 165 this morning.
–In euro$s, the peak one-year calendar spread EDM23/EDM24 set a new high at 78 bps. EDZ21/EDZ22 settled just above 1/4% at 26 bps, down 2 on the day. The strongest part of the eurodollar curve was the green pack (3rd year), which closed +4 at an avg 98.87, while golds (5th year) only barely settled positive at +1 at an average 97.735. Interestingly, 4EU 9637.5 puts have seen consistent buying at 1.5, with a buy of 4k yesterday and open interest now over 12k. Underlying EDU25 settled 9778.5.
Can’t depend on YCC
April 4, 2021 -Weekly Comment
Net changes on the week in eurodollars: Whites -2.125, Reds -10.625, Greens -19.375, Blues -20.75 and Golds -15.75. The five year was the leader on the treasury curve, up 12 bps to 97.4 (a new high), with tens up 6.2 and thirties essentially unchanged. 5/30 treasury spread is 139, the lowest level since late January, at significant support of 137 to 139.
Reds are the second year out, greens and blues are the third and fourth years. Obviously the surge in yields in years 3 and 4 relative to the front end of the curve is telling us that the Fed will certainly be tapering/tightening in two years. Even a three-month spread like EDM2/EDU2 settled at 9.5 on Friday, a new high, having been between 1.0 and 2.5 from last September through January. That spread reflects a hike probability of over 35% during that three month period, which is only 1 ¼ years away. EDU1/EDU2 settled at a new high of 22.0 which signals near certainty of one hike over that year.
Last week Mfg ISM surged to 64.7, the highest level since 1983. Unemployment fell to 6.0% with non-farm payrolls jumping by 916k. This week ISM Services is released on Monday, expected 59.0. The high in 2018, the year in which almost all economic data made new highs in the Trump era, was 60.9. On Friday PPI is released, with Core yoy expected 2.7% vs 2.5% last month. The high in 2018 was 2.9%. Powell has repeatedly vowed to keep rates low because of continued economic slack, especially in the service sector, and because inflation cannot be sustained due to generational headwinds. We get info on both fronts this week.
It’s worth noting that in 2007, just following the height of economic activity before the GFC, the unemployment rate bottomed at 4.5%. In 2004 as the Fed began to hike it averaged around 5.5%. In 2006 it averaged 4.6%. To think that the Fed must wait for something like 4% unemployment before raising the FF target from the emergency level of 0.0 – 0.25% is utter folly. In only three out of the past twenty years has unemployment been at 4% or lower.
In terms of the sustainability of actual price increases (that the Fed promises to look through) I tend to think about the example of Jon Corzine blowing up MF Global by loading up on peripheral debt. There are those who say, “Ultimately he was right, sovereign debt of Portugal and Italy, et al. had a tremendous rally.” No. He was wrong. He destroyed the company, dipping into customer funds in the process. He probably should have gone to jail. Don’t be Jon Corzine.
Sure, it might be the case that there is a one-time upward adjustment in prices followed by stability. However, the market is not currently giving any indication of that. TIP breakevens are at new highs with the ten year above 237 bps, a level not seen since 2013. Back month euro$ contracts easily set new lows on Friday. There will come a time when the market signals that the rise in yields has run its course. In my opinion, we’re not there. Too many trapped longs hoping the Fed will come to the rescue with YCC. In that regard, look at ten-yr JGBs. For the last two quarters of 2020 the yield ranged between 0 and 5. In February it rallied to 15.5, then came back down to 6.8 in late March. Now it’s back to 12.
FOMC minutes are released on Wednesday. On Thursday Powell participates in an IMF Forum on the Global Economy, starts at 12:00. There will be more assurances that inflation is temporary, that growth is Covid dependent, that there is a lot of slack in the labor market. Powell will tell us that the current emergency policy is appropriate. By the way, the NY Fed’s Q2 Nowcast is 6.2%.
With regard to the front end of the market, I remember a time when banking issues caused front Eurodollars to sell off due to credit concerns. However, April and June Eurodollar contracts settled at 9981.5 and 9982 respectively, both lower in yield than the current libor setting of 19.975 (Thursday). I don’t know enough about banking activities (and apparently neither do a lot of the banks themselves) but there were a couple of downgrades relating to the Archegos episode. I don’t want to single out any one bank in particular, BUT, Credit Suisse, right on its own website has a tidy summary:
https://www.credit-suisse.com/about-us/en/investor-relations/debt-investors/ratings-credit-reports.html
Moody’s, S&P and Fitch are all have negative credit outlooks, with Moody’s giving this summary:
The negative outlooks on the senior unsecured debt, long-term issuer and deposit ratings – where applicable – of CS and CSG reflect Moody’s view on (1) emerging signs of a higher-than-anticipated risk appetite or potential deficiencies in its risk management, audit, compliance or governance control processes and frameworks, as highlighted by a likely material loss from unwinding concentrated leveraged equity and derivatives’ exposures following the failure of a US hedge fund client, in addition to the aggregate risk the group assumed in relation to Greensill’s founder and his companies culminating in the wind-down of CS’s supply chain finance funds…
We all have unquestioning faith in our Central Banks to backstop all of the messy problems in the world of finance, oh, and climate change… and of course equality, but I have to wonder how anyone can sell EDM1 9981.25 puts at 1.25 or 1.5 bps. It’s not that they will definitely finish in the money, although at Thursday’s libor setting they would be darn close to breakeven. It’s that there is supposedly a credit aspect in the contract, and recent escapades highlight the fact that not all lending is ‘money good’. EDZ1 is a bit more reflective of these concerns for year-end, having settled at 9972.0 Friday, down 2.5 on the week. I had been surprised that the 9975 straddle was recently sold down to 8.0; it settled 9 on Friday. I had suggested looking at EDZ1 9975/9962p spread for 2.5, still a reasonable buy for 3.0 having settled 3.25.
| 3/26/2021 | 4/2/2021 | chg | ||
| UST 2Y | 13.9 | 18.4 | 4.5 | |
| UST 5Y | 85.4 | 97.4 | 12.0 | |
| UST 10Y | 165.8 | 172.0 | 6.2 | |
| UST 30Y | 236.6 | 236.3 | -0.3 | |
| GERM 2Y | -71.5 | -70.8 | 0.7 | |
| GERM 10Y | -34.6 | -32.8 | 1.8 | |
| JPN 30Y | 66.2 | 69.3 | 3.1 | |
| CHINA 10Y | 319.8 | 319.9 | 0.1 | |
| EURO$ M1/M2 | 8.5 | 14.5 | 6.0 | |
| EURO$ M2/M3 | 42.5 | 52.5 | 10.0 | |
| EURO$ M3/M4 | 72.5 | 77.0 | 4.5 | |
| EUR | 117.96 | 117.60 | -0.36 | |
| CRUDE (active) | 60.97 | 61.48 | 0.51 | |
| SPX | 3974.54 | 4019.87 | 45.33 | 1.1% |
| VIX | 18.86 | 17.33 | -1.53 | |
1983
April 2, 2021
–NFP today expected 660k with yoy earnings +4.5%
–ISM Mfg released yesterday with a print of 64.7. Oh sure. It’s been higher than that. In 1983. Dude: 1983. I don’t think they even said “dude” back then. Have to wait until 1987 for Aerosmith’s Dude looks like a lady. Anyway, was 1983 anything like today?
Let’s start with some economic data from year-end:
Inflation (CPI) 3.8% (and falling)
Unemployment 8.3%
Fed Funds 9.5%(who says there can’t be inflation with labor slack?)
***************
Michael Jackson’s Thriller released.
Microsoft Word was launched.
The UK introduced the 1 pound coin.
More music: Bonnie Tyler’s Total Eclipse of the Heart.
Now you’ll have that stupid song stuck in your head all day. You’re welcome.
https://www.youtube.com/watch?v=lcOxhH8N3Bo
And, in a nod to my colleague Trent:
She Blinded Me with Science
Here are a few headline snippets:
https://worldhistoryproject.org/1983/page/5
On March 3, 1983, he [Ronald Reagan] predicted that communism would collapse, stating, “Communism is another sad, bizarre chapter in human history whose last pages even now are being written.” In a speech to the National Association of Evangelicals on March 8, 1983, Reagan called the Soviet Union “an evil empire.”
–[Parallels today: the US is moving closer to communism and the President still puts Russia in the ‘evil empire’ category].
Apr 1983
Keith Richards appears on the cover of Guitar Player

In 1983, two separate research groups led by Robert Gallo and Luc Montagnier independently declared that a novel retrovirus may have been infecting AIDS patients, and published their findings in the same issue of the journal Science.
Vanessa Williams Becomes the First African-American Miss America
The Big Chill is a 1983 film about a group of baby boomer college friends who reunite after many years and explore the aftermath of the 1960s.
North Korean Operatives Detonate Bomb in Rangoon in Unsuccessful Attempt on Life of South Korean President, Chun Doo Hwan
Scarface is a 1983 epic crime drama film directed by Brian De Palma, written by Oliver Stone, and starring Al Pacino as Tony Montana.
“[Frank Lopez] Lesson Number One: Don’t Underestimate The Other Guy’s Greed! [Elvira Hancock] Lesson Number Two: Don’t Get High On Your Own Supply.”

New curve highs at quarter end
April 1, 2021
–The quarter ended with new highs in the curve. 2/10 up 0.8 to 158.3. Red/gold euro$ pack spread (2nd to 5th year) just over 182 bps. New high for peak one-yr euro$ calendar: EDH23/H24 and EDM23/M24 tied at 77.5 bps. This, as Biden announced his massive tax and spend plan for infrastructure and SPX made a new all-time high before a modest pullback into the close. Implied vol firmed significantly in back dollars, supporting the move towards higher yields and further steepening; straddles up 1.5 to 2 bps. As examples, 2EU 9800 straddle from 37 Tuesday to 38.5 yesterday. 3EZ 9812^ from 66 to 67.5. While Friday’s payroll data could change the picture, price action and the curve signal a move to still higher rates.
–Worth a note that May Corn is at a new high this morning 578. After spending Feb and March bouncing around 530 to 550, a bullish USDA grain report sparked a close above 564, with further strength today.
–Jobless Claims today expected 675k from 684k. Manufacturing ISM expected 61.5 from 60.8.
Pinning the 5y yield
March 31, 2021
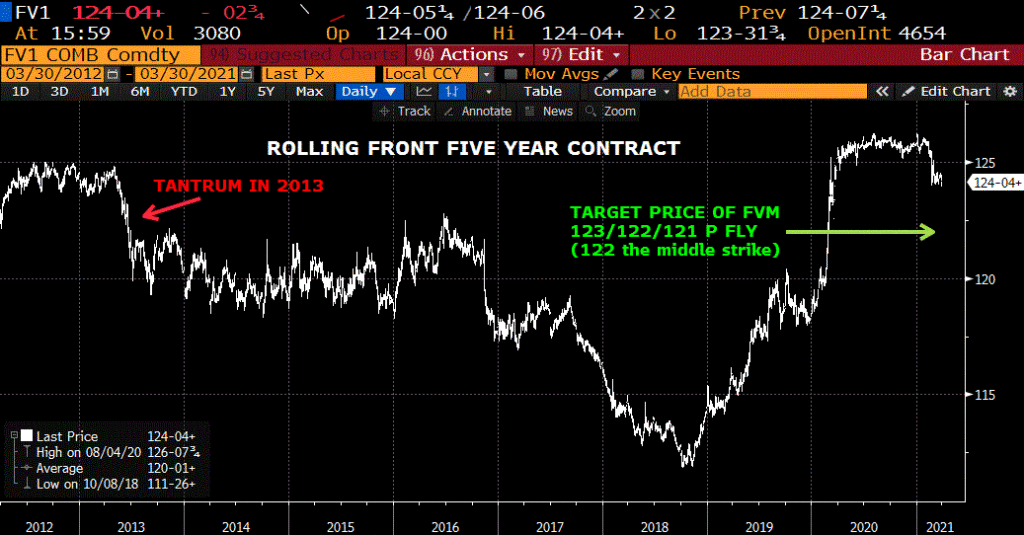
–One large trade to high-light yesterday, a buy of 25k FVM 123/122/121 p fly 9 to 9.5. Settled 8.5 vs 123-18. Max value at expiry is of course at center strike of 122, around 1.20% vs current 5y at 91 bps. Seems far away until one considers the initial taper tantrum high in the 5y yield was 1.61% in July 2013 and ultimate high was 1.85% in September. I’ve attached a continuous futures chart, which indicates just how lofty we still are given continued massive fiscal spending during the grand re-opening. There was also a late block buy of over 3k WNM 182-28, just above $1m DV01. WNM settled 182-12. Note that 5/30 continues to drift lower, now 148.5 from a high in March of 162, and that the two trades cited above, taken together even though done independently, support the flattening of 5/30. Action is moving to the belly. By the way, during taper tantrum, 5/30 ranged between 210 and 235 bps, ultimately reaching 250 at the end of the year. Again, the tantrum might not be the proper road map, but modest flattening in 5/30 doesn’t really indicate that the move is over.
–New high, but just barely, in euro$ curve. Red/gold now at 180 compared to 2/10 at 157.5. Steepness continues to move forward on the curve.
–Biden set to announce $2 trillion plus infrastructure plan today. ADP also released expected 550k.
Market focuses two years forward for Fed changes
March 30, 2021
–Rumors of NFP even greater than the expected +650k and Wednesday’s expected $3 trillion infrastructure plan conspired against fixed income on Monday (with follow-on new lows this morning). New Fed Governor Waller categorically denied that the Fed will keep rates low to help fund the deficit. I’ve included a couple of speech snippets below, but omitted the hot mic, “We’re not Turkey, you know!”
–The ten year note rose 6 bps to 1.718%. Gold eurodollars (5th year forward) made new lows, falling 7.625. Red/gold pack spread posted a new high, just under 179 bps. with 2/10 just shy of its recent high of 158. The interesting aspect of yesterday’s curve trade is actually the jump in reds to greens, 2nd to 3rd year. Net changes: Reds -1.875, Greens -6.625, blues -7.0 and Gold -7.625. The kink here is obviously reds/greens….as if the Fed can hold the line on rates for the next two years (through reds) but will be nudged into action by the market by March or June of 2023. Similarly, 2’s/5’s had a nice boost of 3.4 bps yesterday.
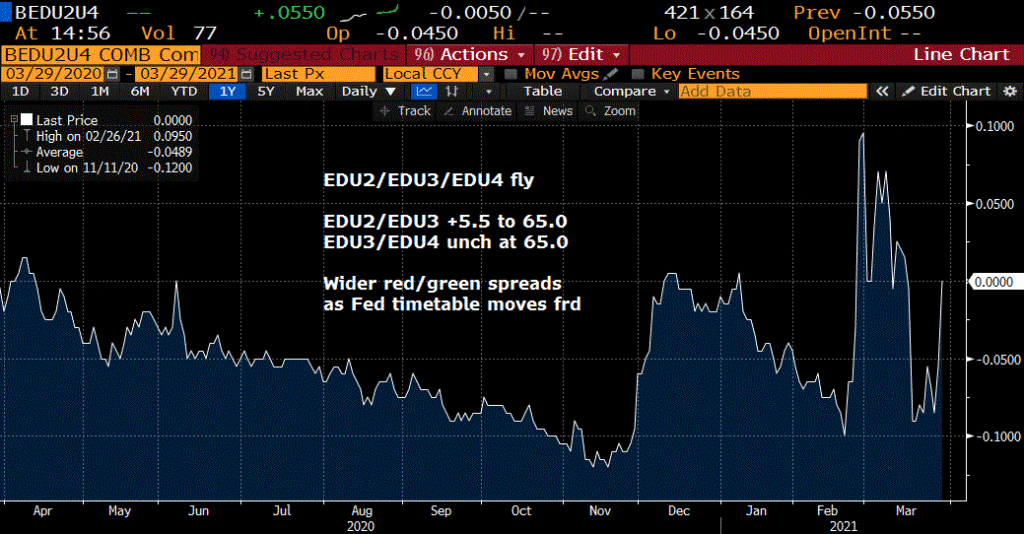
–I’ve attached a chart of EDU2/EDU3/EDU4 futures butterfly which captures this dynamic, having jumped from -8.5 to flat in a couple of days as EDU2/EDU3 widened much faster than EDU3/EDU4. (thanks DK).
–Seller yesterday of EDZ1 straddle at 8.0, which then settled 8.5. Sort of amazing to me that with Archegos related stress at Credit Suisse and Nomura the market feels comfortable that nothing can happen over the next nine months into year-end. I’ll bet the Fed is happy they allowed banks to engage in share buybacks and dividends again, as they liberally employed off-exchange, off balance sheet CFD’s (contracts for differences) to abet Archegos. Buyer of 25k EDM1 9981.25/9975p 1×2 for 0.25 appears to be a roll up.
–Big Dallas Fed Mfg survey at 28.9 vs 16.8 expected. Price subsets also jumped. I have a cousin who owns a machine tool shop in St Louis (Precision Tools) who told me yesterday: “We have only seen a very modest increase in our raw materials prices, maybe 4-5% and this just recently occurred.” Half full can focus on “modest increase” while half empty can focus on “4-5% just recently”.
WALLER comments:
…Because of the large fiscal deficits and rising federal debt, a narrative has emerged that the Federal Reserve will succumb to pressures (1) to keep interest rates low to help service the debt and (2) to maintain asset purchases to help finance the federal government. My goal today is to definitively put that narrative to rest. It is simply wrong. Monetary policy has not and will not be conducted for these purposes.
Consequently, the argument goes that a hot economy may cause substantial inflation pressures that are hard to rein in politically, and which ultimately harm Americans in the longer run. This view is backed up by the political economy literature, which argues that having monetary policy under the control of political authorities may lead to excessive inflation and economic volatility that is not socially optimal.11 Put another way, it can lead to an unstable economy, on which households and businesses cannot rely.
Price Discovery
March 28, 2021 -weekly comment
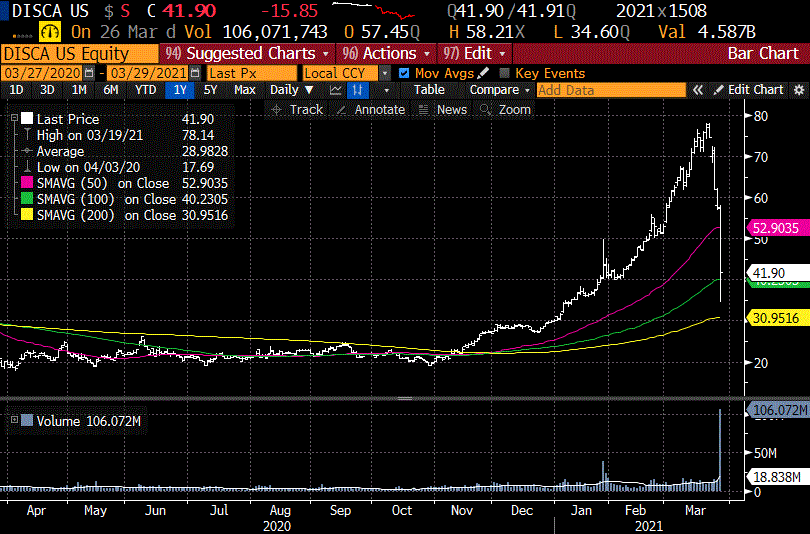
Someone “discovered” stocks don’t always go up. Above is a chart of Discovery Inc, one of the names in Friday’s block trade purge. There’s a lot of talk about the $10 billion-plus block sales on Friday, and the fund that was liquidated. It’s worth noting just a couple of the market cap changes. From March 22 to Friday, Baidu (BIDU) fell about $20 billion in value, with Discovery losing an equal amount since March 19. In fact, BIDU closed at 340 on Feb 19, and 208.61 on Friday, so the loss in market cap since mid-Feb is over $45 billion. Granted the closing price is still above the closing level for 2020, but these were massive moves.
From recent highs to Friday’s lows many of these stocks were cut to HALF PRICE. Here’s a list of stocks with highs from March 23 to lows on Friday March 26:
Baidu (BIDU) 263.71 to 174.05
Tencent Music (TME) 32.24 to 16.31
Vishop (VIPS) 46.00 to 24.98
Viacom (VIAC) 96.34 to 39.81
Discovery (DISCA) 72.42 to 34.60
Farfetch (FTCH) 61.46 to 41.25
IQiyi (IQ) 28.97 to 14.60
GSX Techedu (GSX) 83.57 to 29.40
I don’t know this list to be all inclusive. All still closed above the 12/31 closes, though some just barely. All had bounces off the lows. News reports claim the fund was highly leveraged and couldn’t meet margin calls.
**Late in the day at Goldmans offices: “We cleaned up all the stocks right?” “Yes, got out of everything.” “Good, I’m about ready for a cold beer. Where’s that annoying intern that keeps claiming he’s over-worked?“ Intern returns, clutching trading statements. “Boss, it looks like these guys might have been short SP futures as a hedge to their long stocks.”
I’m just joking of course, but could something like that have accounted for the ramp in the last hour of the day in ESM1 from 3908 to 3968 from 2:50 to 4:00?
We’re in a time where a loss of billions in a given fund barely causes a ripple. It’s not like 1998, where a loss of $5 billion by Long Term Capital Markets (LTCM) nearly brought down the system and sparked a bailout engineered by the Federal Reserve. It’s just a “one-off”. Like the ship stuck in the Suez Canal. It’s not as if there are currency devaluations and defaults like the 1997 Asian crisis and 1998 Russian crisis. Turkey… it’s a one-off. Just a temporary block in the plumbing. It seems to me we’re seeing a lot more “one-offs” recently.
It’s somewhat interesting that in 1997 to 1998 as the Asian Tiger crisis and LTCM unfolded, the ten year treasury yield went from nearly 7% to a capitulation low of 4.2% in the beginning of October 1998. The lack of buying in the ten year now underscores the nonchalance of the market with respect to possible risks. Or, maybe there IS buying, but massive supply nullifies the chance for a yield decline from what are already low levels, especially with inflation signals percolating.
While yields did fall on the week, with tens -6.8 bps from 172.6 to 165.8, the trend higher is still intact. The back end of the Eurodollar curve remains notably weak. EDU’25 closed at 9793.0, just 4.5 bps above the lowest close of the move which was the previous Friday at 9788.5. Once again, it’s worth noting that the ultimate low close for the second gold (18th quarterly) in the taper tantrum of 2013 was in September at 9617.0. Over 175 bps lower than the current level. The ten year topped at 3% vs 1.66% now. Perhaps the tantrum isn’t a suitable roadmap. However, we’re looking for nonfarm payrolls to be about 650k on Friday. Pre-covid there hasn’t been a payroll number above 400k in the past 20 years except for one post-GFC reading in May 2010 at 540k.
Truly interesting website on John Mauldin’s weekly piece, WTF Happened in 1971, (when Nixon abandoned the gold standard). It appears to be a huge inflection point. A lot of charts. In the 70’s inflation was running 5-10% and started 1980 around 15%. Fifty years ago.
https://wtfhappenedin1971.com/
Another informative article by Harley Bassman last week on vols and convexity
http://www.convexitymaven.com/images/Convexity_Maven_-_Lurking_at_the_Scene.pdf
OTHER MARKET THOUGHTS/ TRADES
The peak one-year ED calendar on the curve is still EDM23/M24 at 72.5. High settle has been 76.5 on 19-March. Interesting to note that greens to blues (3rd to 4th year) has been the steepest part of the curve. In part, this is due to the libor transition. While one-year calendars from greens to blues declined a few bps this week, blues to golds made new highs. As an example, EDM4/EDM5 closed at 55 on 19-March, but settled 56.0 on Friday with a new high print of 57. I find the direction of the blue/gold pack spread highly correlated to 10/30 treasury spread. The thirty year bond remains vulnerable to further inflation pressures.
| 3/19/2021 | 3/26/2021 | chg | ||
| UST 2Y | 15.2 | 13.9 | -1.3 | |
| UST 5Y | 89.7 | 85.4 | -4.3 | |
| UST 10Y | 172.6 | 165.8 | -6.8 | |
| UST 30Y | 244.8 | 236.6 | -8.2 | |
| GERM 2Y | -69.5 | -71.5 | -2.0 | |
| GERM 10Y | -29.4 | -34.6 | -5.2 | |
| JPN 30Y | 66.7 | 66.2 | -0.5 | |
| CHINA 10Y | 323.7 | 319.8 | -3.9 | |
| EURO$ M1/M2 | 9.5 | 8.5 | -1.0 | |
| EURO$ M2/M3 | 44.0 | 42.5 | -1.5 | |
| EURO$ M3/M4 | 76.5 | 72.5 | -4.0 | |
| EUR | 119.07 | 117.96 | -1.11 | |
| CRUDE (active) | 61.44 | 60.97 | -0.47 | |
| SPX | 3913.10 | 3974.54 | 61.44 | 1.6% |
| VIX | 20.95 | 18.86 | -2.09 | |

