
Powell digs into the toolbox
Nov 17, 2020
–Relatively quiet session in rates even as Moderna released positive vaccine news which sent DJIA and SPX to new record high closes. Tens rose 1.3 bps to 90.4 with TYZ0 settling 138-01. December treasury options expire Friday, and it’s worth recalling the 50k TYZ 139/138/137.5 put tree that was bought for 3 to 5/64s a few weeks ago. Pegged it. Settled 49 yesterday with a good chance of the full enchilada on a Friday settle between 137.5 and 138. By the way, Dec puts around the current futures level have the most open interest: 138p with 118k contracts, 137.5 with 121k and 137 with 130k.
–Implied vol in rates remains soft. Jan TY vol at just 3.0 and March at 3.2. There was a buyer of 25k TYZ 136/TYF 135p diag for 3 (sold Dec at 1, paid 4 for Jan). Looks like the trade was an exit. Somewhat interesting in that lower strikes are now more likely to be bought than sold at these paltry vol levels. Previously put sales suggested a cap on yields. This isn’t an apples to apples comparison, but I believe the TYZ put tree was on Oct 20, and I am sure the first price was 3 vs 138-24. Now consider TYF 138/137/136.5 put tree ref 137-205 (everything about 1 point lower). That tree settled 15 (46, 19,12). The vol surface has changed considerably.
–Powell speaks today on a panel at the Bay Area Council. I would expect strong hints to echo Clarida yesterday suggesting the Fed will ramp up the pace of bond buying. Probably USD negative on balance. CNY has strengthened further today, now at 6.5537 vs 7.15 in late May. From Reuters: “The Chinese yuan has gained nearly 9% against the dollar since late May, despite the PBOC taking various actions to temper its strength, including suspending FX frd risk reserves and phasing out the counter-cyclical factor in daily midpoint fixing.” In the middle of last year when China’s ccy was weakening, the fear was that deflation was being exported to US shores. What does the opposite portend?
–Retail sales and Industrial Production today.
Asia in focus
November 16, 2020
–Yields edged slightly higher Friday and vols firmed a touch from depressed levels. Tens ended at 89.1 bps
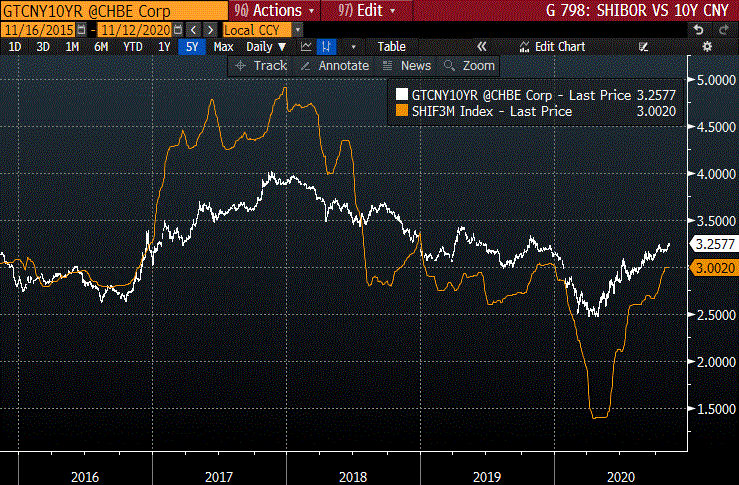
–Cues for US markets may now be more dependent on Asia. The PBOC injected 800 billion yuan into its one-year Medium-term Lending facility today as 600 billion becomes due this month. According to BBG, China’s banks face a 900 billion funding gap over the next two months, amid concerns that SOE’s debts are no longer sacrosanct. Again from the BBG article: “Earlier this month, the PBOC once again raised the topic of exiting easing policies when vice governor Liu Guoqiang said such a move ‘is a matter of time and it is also necessary.'” China’s ten year is currently 3.27%.
–Note that 15 Asian nations including China, Japan, S Korea just signed the largest economic trade pact covering 29% of the world’s GDP.
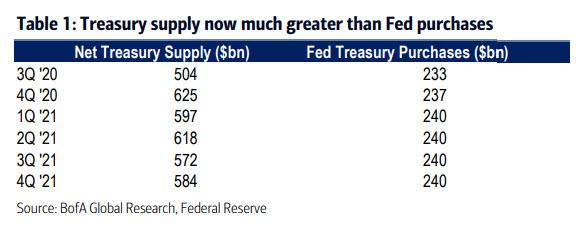
–While China grapples with a possible funding shortfall, BofA notes the same regarding US treasury buying. At the current Fed pace of buying $80 billion UST per month or $240 billion a quarter, BofA projects that buying will only absorb about 40% of issuance next year. Table below. Expect the Fed to hint at ramping up QE in the near future.
https://blinks.bloomberg.com/news/stories/QJV7XEDWX2PZ
https://www.zerohedge.com/markets/traders-edge-china-faces-900-billion-funding-shortage
Hit it
November 15, 2020 -Weekly comment
This week I was honored to be on the Market Huddle podcast with Kevin Muir and Patrick Ceresna.
https://www.youtube.com/watch?v=UbiiDoYcAWw&feature=youtu.be
My basic premise is this: the Fed has told us the funding rate is locked near zero for the next couple of years. The first eight quarters of the Eurodollar strip have warmly embraced this outcome. All contracts from EDZ’20 to EDZ’22 are only in a 15.5 bp range from 99.785 (EDM’21, the peak) to 9963 (EDZ’22). Implied vol in these contracts has been crushed.
When one considers something like the five year treasury yield, the first half of the term is dead. It’s the forward two and a half years that could get some play. If there is to be action after two and a half years, it can only affect today’s five year yield by half the expected amount (ignoring coupons). If only we had forward starting contracts to take a view! We do, of course, and those are the forward contracts on the Eurodollar curve. These deferred quarterlies have already given a nod to either higher inflation numbers, or higher growth. For example, the two-year calendar spread between EDZ0 and EDZ2 is only 12 bps (9975, 9963). But the two-year spread between EDZ2 and EDZ4 is more than three times that level at 39.5 (9963, 9923.5). That’s why these forward three-month term contracts mimic longer dated treasury yields. If higher yields are the expectation, whether due to an upcoming Fed normalization campaign, or better than expected growth as a result of increased global trade, or any other reason, then forward contracts provide a good vehicle for the trip. As mentioned, pricing is beginning to reflect this. For example, EDZ’23 was comfortable at 9963 into the end of September, but traded down to 9941 on news of Pfizer’s vaccine results. In other words, in a month and a half, this contract adjusted by 22 bps. Keep that number in mind for later.
Not everyone considers an outright sale of forward futures as fitting into their risk/reward framework. The curve roll can work as a headwind, and if things really get moving in favor of shorts (higher forward yields), the Fed could announce yield curve control to further stifle market signals. One might consider using calendar spreads, buying nearer contracts and selling deferred. However, the near contracts appear capped by the Fed’s repeated dismissals of negative rates. That leaves the idea of buying put structures on longer dated futures. There are liquid options on the first four years of the euro$ curve that expire with underlying contracts. I would say the first two and a half years are quite liquid, less so after that. There are also midcurve options. These are options on forward contracts that expire within the next year. For example, I have recently highlighted large trades going through 3EH puts. These options are priced on EDH’24 (blue March), but expire on March 12, 2021, next year. Expirations of Dec 11, 2020, (on EDZ21, EDZ22, EDZ23 and EDZ24) are quite liquid. The March 12, 2021 expiration (on EDH22, EDH23, EDH24 and EDH25) are also liquid. June 11, 2021 is less active and Sept 10, 2021 has not yet seen much interest. This was my basic point on the Market Huddle. If one thinks the curve can steepen, perhaps aggressively, then buying puts on forward Eurodollars makes sense.
Now we get to a few things that happened this week that make this type of idea more reasonably priced than it had been previously. Implied vol in near contracts has been absolutely crushed. For example, due to huge selling of EDU1 9975 puts, the 9975 straddle could have been bought for just 7 bps on Thursday. This, with the EDU1 contract trading 9978 and 302 days until expiration. I have never seen the 4th contract straddle this cheap. This is sort of like the auto insurance companies cutting premium rates during covid because no one was driving. Of course, when there WERE accidents they were worse because drivers were speeding! These straddles are pricing NO chance of accidents. Of course, by Friday EDU1 9975 straddle settled 8.5, a more reasonable level, but still very low.
For Market Huddle I prepared the following table (next page), which shows atm straddle level snapshots at three month intervals, so that days to expiration are equal or similar. Then vs now. Just nine short months ago, in February, is the first snapshot, pre-Fed ease, before Covid was really treated seriously in the US.
There was a trade on Thursday that really hammered home the insane levels of premium sales: a seller of 70k EDZ22 9962.5 calls at 10.5 bps while the underlying EDZ22 was 9963.0. Synthetically sold the straddle at 20.5 with 766 days until expiration (dte). That is why I wanted to note the 22 bp sell off in EDZ23 from 9963 to 9941 in 40 days while a 25 month straddle is 20.5. Yes, EDZ22 is a nearer contract, but odds are, straddles at these levels will provide several great scalping opportunities. Put levels provide cheap hedges for those that need them.
This table simply shows nominal straddle levels. If a given euro$ contract is trading at 9900 or 1% yield, a straddle might trade 20 bps. But if a contract is trading 9950, or half the yield level at 50 bps, then a straddle with the same amount of time might be 10 bps, equating the relative premium vs strike level. In any case, that is a bias in pricing.
In this table I have only used select contracts; the third quarterlies and midcurves, and the next forward treasuries. Notice that all treasuries have the same dte, the same expiration date. Same with midcurves. I am a day off on my current Nov 12 prices, just because I wanted to wait for Thursday’s settles.
The top Feb 12 prices were pretty much pre-COVID and pre-Fed emergency rate cuts. The atm ED straddle with 215 days to go was 27 bps. That was the 9850, or 1.5% strike. Currently, on Nov 12, the quarterly straddle with 214 days to go is EDM1 at a price of 9979, with a 9975 strike, or 0.25%. “Why! (you might exclaim) that makes the current straddle relatively EXPENSIVE! Seven bps on a 25 bp strike is 28% of underlying while 27 bps on a 150 bp strike is only 18%.” Maybe that’s what sellers are thinking. Maybe some math wizard kid has it figured out.
I have highlighted (boxed) just a couple of prices in May and November, 6 months apart, same relative expirations, both after the Fed easing. In May, the third green, which is the 11th quarterly, 9975 straddle was 55.5 bps vs 9971. Currently, the third green long-dated straddle is the 9962.5 strike, against a future level of 9958, and it’s 33.5. Sure, these contracts have been flatlining. But there are 950 days to go. Look back again at Feb, 270 or so days ago. The third green future was 96 bps lower in price.
Now check out the third blue midcurve with 212 days to go. In Feb the 9850 strike was 41.0. In May the 9950 strike was 37.5. By August, the 9950 strike, with the same futures level as May, was 32.0. Now in November, the atm 3rd blue midcurve is just 28.5 bps. But you know what? The strike is now the 9925 line. The same relative future is actually 25.5 bps lower, 9956 in May and August, and 9930.5 in November.
| 2/12/2020 | fut pr | atm ^ | dte |
| EDU0 | 9851.00 | 27.00 | 215 |
| EDU1 | 9868.50 | 56.00 | 579 |
| EDU2 | 9862.50 | 80.00 | 950 |
| 0EU0 | 9868.50 | 38.50 | 212 |
| 2EU0 | 9862.50 | 41.00 | 212 |
| 3EU0 | 9854.00 | 41.00 | 212 |
| FVM0 | 120-027 | 1’185 | 100 |
| TYM0 | 130-18 | 2’12 | 100 |
| USM0 | 160-23 | 5’06 | 100 |
| 5/13/2020 | |||
| EDZ0 | 9969.00 | 18.00 | 215 |
| EDZ1 | 9979.00 | 23.00 | 579 |
| EDZ2 | 9971.00 | 55.50 | 950 |
| 0EZ0 | 9979.00 | 23.00 | 212 |
| 2EZ0 | 9971.00 | 30.50 | 212 |
| 3EZ0 | 9956.00 | 37.50 | 212 |
| FVU0 | 125-175 | 1’09 | 100 |
| TYU0 | 138-315 | 2’29 | 100 |
| USU0 | 179-04 | 7’40 | 100 |
| 8/12/2020 | |||
| EDH1 | 9978.50 | 10.50 | 215 |
| EDH2 | 9978.00 | 26.50 | 579 |
| EDH3 | 9970.50 | 51.50 | 943 |
| 0EH1 | 9978.00 | 16.00 | 212 |
| 2EH1 | 9970.50 | 21.50 | 212 |
| 3EH1 | 9956.00 | 32.00 | 212 |
| FVZ0 | 125-27 | 0’60 | 100 |
| TYZ0 | 139-02 | 2’10 | 100 |
| USZ0 | 177-04 | 7’26 | 100 |
| 11/12/2020 | |||
| EDM1 | 9979.00 | 7.00 | 214 |
| EDM2 | 9967.50 | 14.00 | 578 |
| EDM3 | 9958.00 | 33.00 | 949 |
| 0EM1 | 9967.50 | 9.50 | 211 |
| 2EM1 | 9958.00 | 16.00 | 211 |
| 3EM1 | 9930.50 | 28.50 | 211 |
| FVH1 | 125.257 | 0’445 | 99 |
| TYH1 | 137-245 | 1’55 | 99 |
| USH1 | 173-18 | 6’02 | 99 |
************************************************************************
In conclusion: We have a Fed begging for more fiscal stimulus while promising to overshoot inflation. Powell is stuffing the balance sheet with bonds. We’ve got 18% yoy M2 growth. And a vaccine on the way. Hit it.
As Elwood would say: “It’s 106 miles to Chicago. We got a full tank of gas. Half a pack of cigarettes. It’s dark. And we’re wearing sunglasses.” Jake: “Hit it.”
| 11/6/2020 | 11/13/2020 | chg | ||
| UST 2Y | 15.3 | 17.7 | 2.4 | |
| UST 5Y | 36.1 | 40.1 | 4.0 | |
| UST 10Y | 83.7 | 89.1 | 5.4 | |
| UST 30Y | 159.7 | 164.6 | 4.9 | |
| GERM 2Y | -78.0 | -72.7 | 5.3 | |
| GERM 10Y | -62.1 | -54.7 | 7.4 | |
| JPN 30Y | 62.6 | 64.9 | 2.3 | |
| EURO$ Z0/Z1 | 0.0 | 0.5 | 0.5 | |
| EURO$ Z1/Z2 | 10.0 | 11.5 | 1.5 | |
| EURO$ Z2/Z3 | 15.0 | 15.0 | 0.0 | |
| EUR | 118.77 | 118.38 | -0.39 | |
| CRUDE (active) | 37.49 | 40.40 | 2.91 | |
| SPX | 3509.44 | 3585.15 | 75.71 | 2.2% |
| VIX | 24.86 | 23.10 | -1.76 | |
Euro$ premium squeezed
November 13, 2020
–Yields declined and the curve retreated yesterday. Tens lost 9 bps to end at 88.5. 2/10 finished at 71 bps, down 8 on the day. Stocks took a sharp dip but bounced into the end of the session and are higher this morning.–Trade of the day was a sale of about 70k EDZ22 9962.5c at 10.5. These are long dated, with 767 days until expiration. Settled 11.25 vs 9963.5. Open interest in the strike ended the day at 85k, up 73k on the day. Sales at this level are inexplicable to me. Here’s a guy that has run out of ideas. Assume it’s a sale of 50k at 10.5, then it’s a premium intake of $13.125m, about $17k a day assuming straight line decay.
–Compare these against the year in front, EDZ1 9962c. Those settled 14.25 vs 9975.0. So, if nothing changes, the position slowly rolls against. EDZ1 9975c settled at 4.75 with futures exactly at strike. So if EDZ2 remains at the 9962 strike, then he will make 5.75. In a year. The premium compression this week in eurodollars has been nothing short of spectacular.
–Of course, if the Fed were to hike rates sometime in the next couple of years, these calls will eventually settle worthless. However, in that case, the large short positions in EDH2, M2 and U2 9962 puts will come into play. This strike (9962.5) has been depressed by the buyer of 9975/9962p 1×2’s and settled 3.0 vs 9968.5 in EDH2, 4.5 vs 9967.5 and 6.75 vs 9966.0. To give an indication of just how depressed these levels are, consider EDM2 9962 straddle at 14.0 with 578 days to go. In May, the atm straddle with the same amount of time left (EDZ1) was 23.0. In August, the atm straddle with the same amount of time left was 26.5. These levels represent absolute faith in the Fed to lock short rates where they currently are for the next couple of years. As I mentioned yesterday, China 3-month SHIBOR has risen from 140 bps at the Covid peak, to 300 bps now. Of course, it appears as though China is trying to rein in some financial excesses. That’ll never happen here.
–One other interesting trade worth note, a seller of 30k 0EH 9962 straddle (settled 8.0) vs buyer 3EH 9925p (settled 4.5). Perceptions could still shift to deferred tightening.
Vols lower, curve pulls back
November 12, 2020
–Once again, year end funding became a topic as JPM released a report that rising bank stock prices could lead to higher GSIB scores and thus a pullback from intensive balance sheet activity. EDZ0 settled -2 at 9974. This was after Tuesday’s heavy sales of EDH1 at 9978.5 to 78. With the crazy rotation this week, JPM stock has rallied from around 95 at the end of October to 115 yesterday. While I don’t know the technical details of GSIB scores and balance sheet ramifications, I do know that all front (white) straddles are 7 bps or lower, which doesn’t seem to compensate for possible regulatory shifts. 9975 straddles: Dec 3.5, March 5.5, June 6.5, Sept 7.0. There was also an article noting that Boston Fed’s Rosengren is concerned about pressures on prime money market funds. I guess that will leave the Fed as the funder of all CP.
–In spite of these concerns implied vol was again pressed lower as the curve receded from the steepest levels of the year this week. 5/30 lost about 1 bp to 128.8 while 2/10 closed on a new high just above 79 using the new ten year. Thirty year auction today, $27 billion. Red/gold euro$ pack spread fell 4.5 to 62.375. USF 172 straddle settled 3’48 or 8.0, right at recent lows. On election day the atm USF straddle was 4’32.
–CPI expected 0.1% with yoy Core expected +1.7 from +1.7 last month. While Corn pulled back from new highs, Jan Beans powered to a new contract high at 1152 1/2, best level since 2016. There’s an article on Aljazeera noting that LDC, Louis-Dreyfus, is selling a portion of the firm to Abu Dhabi. ADQ wants to “boost food security”. This may become a much bigger investment theme. For example, Corteva, an agribusiness and seed company (CTVA, and yes I own some) closed at 36.50, a new high.
“For ADQ, formerly known as Abu Dhabi Development Holding Co., acquiring a minority stake in one of the four largest traders of grains, oilseeds and sugar will help boost food security for the United Arab Emirates at a time when governments around the world are accelerating efforts to ensure they can feed their citizens.”
https://www.aljazeera.com/economy/2020/11/11/bblouis-dreyfus-sells-stake-in-family-business-to-abu-dhabi-fund
–The market is aggressively selling interest rate insurance (premium) because the Fed “has our backs”. VIX is also at the lowest level of the past couple of months at 23.76. However, other forms of insurance are still being purchased.
It’s all stable until it isn’t
November 11, 2020
–Ten year rose another 1.2 bps as dealers apparently got caught with more of the auction than expected, somewhat surprising given the yield back-up close to 1%. The ten year went off at 96 bps, and was 99.0/98.5 at the futures settle.
–All euro$ one-year calendars eked out new highs. For example, EDU21/EDU22 settled 14.0, up 1.5 on the day. 2/10 (using old ten-yr) made a new high at 78.5 while red/gold ED pack gained over 1 to a new high of 66.875. The curve is steepening as previous fiscal and continuing monetary stimulus are weighed against what could become a more normally functioning economy with a covid vaccine.
–There was further selling in EDM1 and EDU1 9975 puts. The latter were mostly sold at 2.0, with 66k added to open interest. Settled 1.75 vs EDU1 9978.5 for a straddle price of just 7 bps. As recently as the end of October this straddle was 11.0 and the EDM1 straddle was 9.5 (now 6.5). These are extremely low levels associated with locked Fed policy. There are 306 days until expiry for EDU1. I know what the Fed has promised, but given events over the past 300 days, these levels reflect unwavering, divine faith in the Fed. Yours.
–By the way, not that food prices have anything to do with inflation or the “real” digitally driven economy, but corn and beans are making new highs. Dec Corn was 320 in August and prints 425 this morning.
–Front March ED saw huge volume with what appeared to be one seller of near 150k contracts 9978.5 to 78. Settled 9978. These are new positions as open interest rose 90k in the contract. One client mentioned the possibility of these sales being related to a Fed credit facility winding down in March. I did not see specifics, but I would note that the Fed instituted a slew of special lending programs in March of this year, and it would not be surprising if the Fed used the one-year anniversary to pull back extraordinary measures.
https://www.federalreserve.gov/funding-credit-liquidity-and-loan-facilities.htm
Sort of makes one wonder if being short EDM1 9975 puts at 1.5 is such a sparkling trade strategy.
–The Fed released its Financial Stability Report on Monday. In it, concerns were expressed over vulnerabilities in asset prices: “Given the high level of uncertainty associated with the pandemic, assessing valuation pressures is particularly challenging, and asset prices remain vulnerable to significant declines should investor risk sentiment fall or the economic recovery weaken.” What that means in layman’s terms is, there’s a chance of more sellers than buyers. The same warning is given with respect to business debt: “Debt owed by businesses, which was already historically high relative to GDP before the pandemic, has risen sharply….”
–I saw a headline that Bill Ackman thinks credit spreads are too low and is placing bets for widening. “Hey Bill, let me get you into some of these long dated euro$ puts for incredibly low premium.” Well that would have been the simple play pre-SOFR. Now the credit feature in the product is going away.
Wild Monday. Pandemic Plays Pared.
November 10, 2020
A covid ‘breakthrough’ vaccine announced by Pfizer sent stocks on a giddy morning run to new highs and caused bond yields to surge. However, mammoth rotation ensued across markets, as covid plays were pared back in favor of more normal conditions. The most dramatic move was the surge and then plunge of Nasdaq, which finished -1.5% on the day as DJIA ended up nearly 3%. Outside day for Nasdaq. Zoom and NFLX were crushed, -17% and -8.6%. FB and AMZN both dropped 5%, MSFT -2.4%, AAPL -2% and GOOGL was essentially unch’d. GE a tarnished previous bellwether of the Dow, gained 7.8%.
–The ten year yield exploded to 95.6 bps, up 13.8 bps on the day and the 30y ended at 1.748%, up 15. While tens remain below the psychological 1% level, all measures of the curve made new highs for the year. 2/10 up 11 to 77.5. 5/30 up 6.4 to 130. Red/gold euro$ pack spread up 13 bps to 65.75. However, implied vol was blanketed, starting with a sale of 50k TYZ 137.5 put at 10 covered 137-30, 33d. That strike is part of the large TYZ 139/138/137.5 put tree, so it appears shorts were added to the lower leg. This tree was originally bought for 3 to 5, and settled 38 (1’28, 0’36, 0’18) vs TYZ 137-18+. Another interesting feature is the change in the vol curve across treasuries. FV vol was higher on the day, with a noted buy of 20k FVF 126c 3.5 to 4.5 (5.0s vs 125-08.75) while 30y vol was unch’d to lower. It was after the Covid onset in March that 30 yr vol outpaced everything else, as the long end of the curve is most affected by stimulus while the Fed promised to keep rates at zero. This trust in the Fed was punctuated by huge sales in near puts yesterday, for example some 50k EDU1 9975p were sold mostly at 2.5, settled 2.25 vs 9978, yielding a straddle settle of 7.5 vs Friday’s settle of 10, with 308 days to go! For another example, 0EU 9962.5 straddle settled 13 vs 15 on Friday. 305 days to go here, with EDU’22 as underlying.
–To give a sense of just how depressed these front straddles are, I checked back to May 12, when the last red midcurve had 304 days until expiry. It was 0EH2, based on underlying EDH’22 which had settled 9980. At that time the straddle was 30. VERSUS 13 NOW! Of course, at that time the idea of negative rates were still in play. Currently, the Blue Sept 3EU 9925 straddle is just 36, a large nominal premium spread to the 0EU of course, but still below the May 12 level for the last blue of 44 (vs 9949.5).
–The curve is now steeper than it was mid-year, and every one-year euro$ calendar settled at a new high. There was a seller of 30k EDM2/EDM3 spreads at 13, settled 12.5, appears to be a new position. Ten year auction today. Monday’s volume was huge, but liquidity is lessening as many hedge funds pare back risk to protect gains made earlier in the year.
Stocks near new highs
November 9, 2020
–With Biden declared the victor, stock index futures are near all-time highs this morning, with ESZ 3550 vs high around 3576 in September and NQZ 12283 vs 12444. While WTI crude and gold are both up as well, they have lagged; at the end of August CLZ was 44 vs 38 now, and GCZ was as high as 2075 in early August, now 1960. Ten year future is up small, retracing a bit of Friday’s loss. On Friday the curve steepened, with the 2yr now up 0.6 bp to 15.3, while tens and 30s were +5.0 bps to 76.8 and +6.6 to 159.8. This leaves both 2/10 and 5/30 around 5 bps off recent highs (recent highs 71.8 and 128.6 vs 66.5 and 123.7).
–Implied vol in treasuries continues to compress with Jan TY and US 3.0 and 8.0, about as low as they ever get. From Tracy Alloway of BBG today, “Yields on the benchmark 10yr treasury jumped to 94 bps on Tuesday before sharply falling on Wednesday, moving in a 22 bp range that JPM analysts point out is the widest since June.” Her note goes on to reference the Sept 2019 repo blow-up and comments from both Quarles and Powell about the Fed making sure markets function smoothly. Does smooth functioning mean no volatility? With option premium cut to the bone a natural shock absorber goes away. Liquidity could suffer as the result of the central bank owning a large chunk of the market while trying to stifle volatility. Treasury auctions 3s, 10s and 30s this week in size of $122 billion (54, 41 and 27).
Death of reflation is greatly exaggerated
November 8, 2020 – weekly comment
______________________________________
Chart of yoy M2 percentage growth:
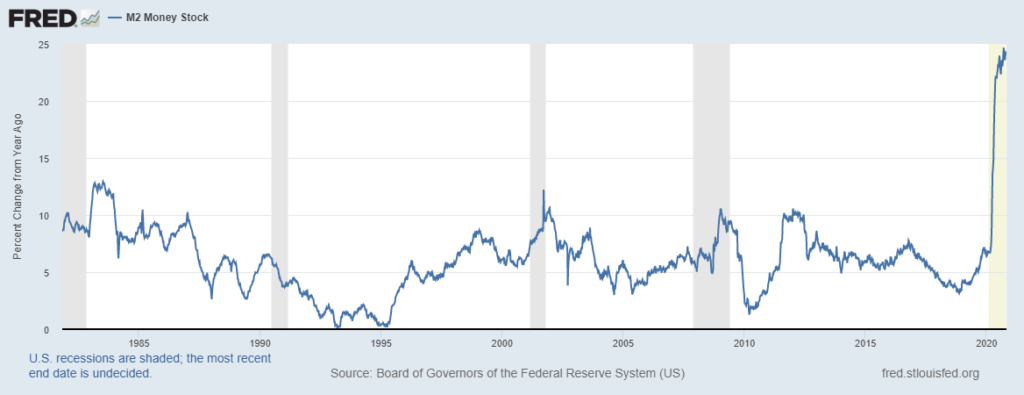
This week has had commentators opining about the demise of the “reflation” trade. Bonds rallied as the probability for large stimulus lessened with the prospect of a Biden presidency and Republican Senate.
To delve a bit deeper into the demise of reflation, I would like to re-visit a paper written in May by Paul Tudor Jones and Lorenzo Giorgianni, The Great Monetary Inflation (GMI). It’s well worth reading the source paper which I have linked at bottom.
The press, as you may have recently noticed, tends to focus on juicy soundbites with or without context. “PTJ goes all in on bitcoin!” The paper is, of course, much more nuanced and interesting, perhaps even more so on a look back after six months have passed. Here are a couple of excerpts:
A large demand shortfall will prevent goods and services inflation from rising in the short term. The question is whether that will be the case in the long term with a central bank whose central focus will be repairing the worst employment crisis since the Great Depression.
To answer this question, we need to ask, how reasonable is it to expect that in the recovery phase the Fed will be able to deliver an increase in interest rates of a magnitude sufficient to suck back the money it so easily printed during the downswing? The current Fed leadership has made it a centerpiece of its new monetary policy framework to do whatever it takes to overshoot the inflation target in the recovery phase. This is a risky strategy.
Note that this was written in May, before the official Fed change of framework announcement in August. The inflation ‘overshoot’ is now official policy. Don’t fight the Fed! Most of the GMI note centered around the reflation theme and its counterpart, debasement of the currency. My question is, in the aftermath of the election, have things changed with respect to those themes? Perhaps there will be a smaller fiscal stimulus package. Maybe a comeback in global trade will grease supply chains and restrain prices. But that’s really about it.
A couple of more excerpts:
As Satoshi Nakamoto, the anonymous creator of Bitcoin, stated in an online forum around the time he launched Bitcoin, “the root problem with conventional currency is all the trust that’s required to make it work. The central bank must be trusted not to debase the currency, but the history of fiat currencies is full of breaches of that trust.”
So, when the time for lift-off finally occurs, any hiking cycle is likely to be delayed and unambitious. Furthermore, the risk of a complicit (politically-appointed) central bank chairman cannot be easily dismissed given that central bank independence is no longer a sacred cow.
The Fed has signaled its goal is to debase the currency. And it is asymmetrically stifling its reactive function. In terms of a complicit Fed, I think we have one. Trump did what he could to erode the independence of the Fed. This weekend we got a glaring example of what happens when the central bank is left to the devices of an autocrat. Turkey’s Erdogan again sacked the head of the central bank Murat Uysal, having fired the previous hand-picked chief Murat Cetinkaya in July 2019. Apparently rate cuts and depleting reserves are not the roadmap to a vibrant economy. The lira is in free fall. Powell’s term ends February 2022. Let’s hope his replacement isn’t a guy named Murat.
Here are the vehicles that PJT identified as a reflation hedge:
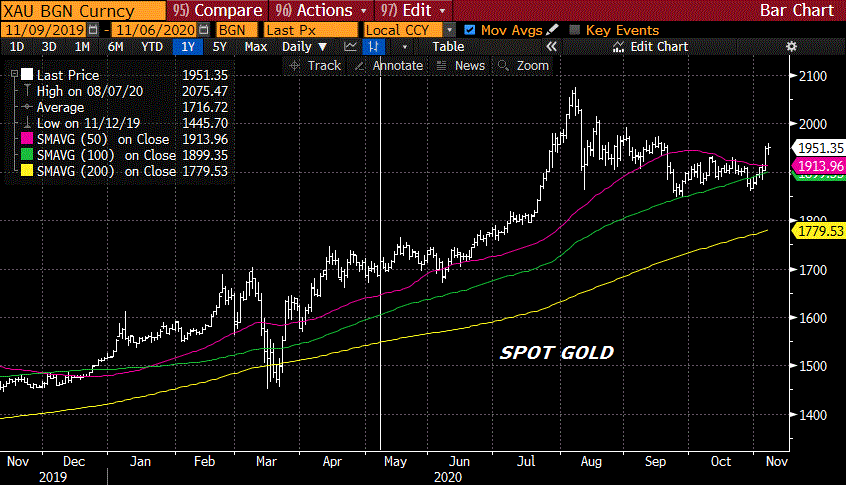
1.Gold–A 2500 year store of value
2.The Yield Curve–Historically a great defense against stagflation or a central bank intent on inflating. For our purposes we use long 2-year notes and short 30-year bonds
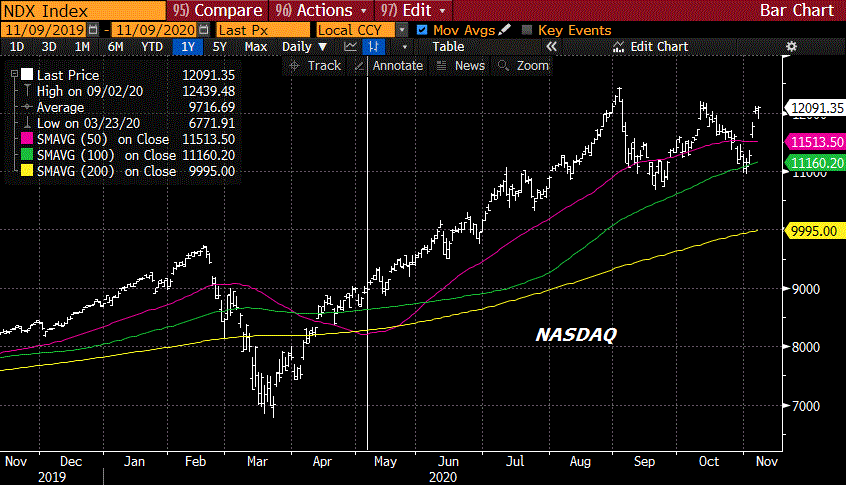
3.NASDAQ100–The events of the last decade have shown that quantitative easing can rapidly leak into equity markets
4.Bitcoin–There is a lengthy discussion of this below
5.US cyclicals (long)/US defensive (short)–A pure goods’ inflation play historically
6.AUDJPY–Long commodity exporter and short commodity importer
7.TIPS(Treasury Inflation-Protected Securities) –Indexed to CPI to protect against inflation
8.GSCI(Goldman Sachs Commodity Index) –A basket of 24 commodities that reflects underlying global economic growth
9.JPM Emerging Market Currency Index–Historically when global growth is high and inflationary pressures are building, emerging market currencies have done quite well
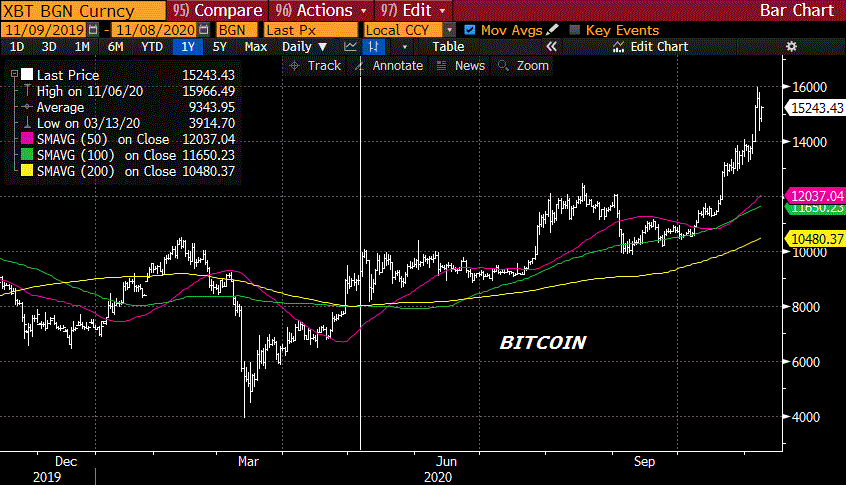
These suggestions have worked out, some in spectacular fashion, especially bitcoin, which hit a high of 10069 in early May (around the time of the paper) and touched 16000 this week.
The next two pages are charts highlighting a few of the trades, bitcoin, Nasdaq, gold and 2/30. The vertical line represents the time of the paper. Note that In October, PTJ still maintained that bitcoin’s rally is in the “early innings”.
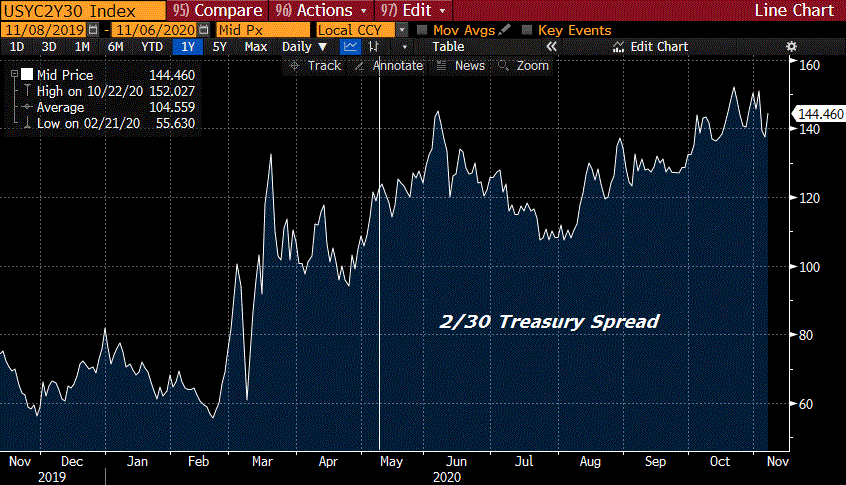
With respect to 2/30, now at 144 bps, I would note that the high of the past four years came right after Trump’s election, with a level of 203 bps on Nov 10, 2016. The high of the 2000’s has been 401 bps, in February 2011. The low since then has been 33 at the end of 2018, when the Fed was still tapering but unwittingly had its tightening campaign forced to an abrupt stop as stocks plunged.
Going forward, my thought is that gold and bitcoin remain strong as USD struggles. Commodities, especially ags, will continue to rally. Nasdaq and the curve are most vulnerable to declines if a new virus wave leads to lockdowns and the prospect of the Fed buying increased quantities of longer maturity treasuries. However, the more that the Fed is forced to openly monetize deficit spending the less confidence there will be in long-dated paper.
This week the ten year yield declined only 4.7 bps, as did the thirty year. Implied vol was absolutely crushed in rates. The Jan US atm straddle (174^) was 6’00 or 11.1 vol on October 30’s close. On Friday the atm 175 straddle for Jan was 4’00 or 8.0. Implied vol has recently tended to firm with higher rates and decline on rallies. This supports the idea of a simple retracement, rather than a change in the steepening trend. The lows in 2/30 in late July, early August of 107/108 will be a key level to hold, though I would doubt it even gets as low as 125 in the near future. My objective by year end is 170. In short, I believe the reflation theme is still alive and well. Look again at the top chart of M2 annual growth, consider the Fed’s new framework, and the healing qualities of a new stimulus program.
OTHER MARKET/ TRADE THOUGHTS
This week the treasury auctions $122 billion. $54b 3y on Monday, $41b 10y on Tuesday and $27b 30y on Thursday. CPI and PPI on Thursday and Friday.
On the week, Russell 2000 rallied 6.8% and SPX 7.3%. Going forward I expect further underperformance of RTY.
One of the interesting trades over the week concerns the libor to SOFR transition expected in January 2022. EDZ’21/EDH’22 calendar spread only rallied from 4 to 5 on the week, but there was a buyer of 60k of the spread from 3.5 to 4.5 on Thursday. The kink in the curve is apparent as EDU1/Z1 is 3.0, Z1/H2 is 5.0 and H2/M2 is just 1.0.
| 10/30/2020 | 11/6/2020 | chg | ||
| UST 2Y | 15.2 | 15.3 | 0.1 | |
| UST 5Y | 38.1 | 36.1 | -2.0 | |
| UST 10Y | 86.5 | 81.8 | -4.7 | w/I 83.7 |
| UST 30Y | 164.5 | 159.8 | -4.7 | w/I 159.7 |
| GERM 2Y | -74.4 | -78.0 | -3.6 | |
| GERM 10Y | -62.7 | -62.1 | 0.6 | |
| JPN 30Y | 64.3 | 62.6 | -1.7 | |
| EURO$ Z0/Z1 | -0.5 | 0.0 | 0.5 | |
| EURO$ Z1/Z2 | 10.0 | 10.0 | 0.0 | |
| EURO$ Z2/Z3 | 17.5 | 15.0 | -2.5 | |
| EUR | 116.47 | 118.77 | 2.30 | |
| CRUDE (active) | 35.79 | 37.14 | 1.35 | |
| SPX | 3269.96 | 3509.44 | 239.48 | 7.3% |
| VIX | 38.02 | 24.86 | -13.16 | |
Gold reflates. Interest rate vol, not so much
Nov 6, 2020
–Short end yields edged slightly higher and longer maturities were unch’d to a shade lower on Friday, as SPX (+1.95%) and Nasdaq (+2.6%) surged within shouting distance of new all-time highs. Gold GCZ0 jumped by $50/oz to 1947. Nov bitcoin exploded 1060 (about half an ounce of gold) to end at 15260; it prints 15740 this morning. DXY looks vulnerable to downside breakout.
–Tens ended unch at a yield of 76.8 bps, while TYZ rose a few 32’s to 138-28. The implied vol puke continued as the economic growth and reflation theme reversed. Treasury vol is nearing all time lows, as pre-election protection has been wholesale dumped. I marked Jan US bond vol at 8.3, having been 11.4 at the start of the month. In the eurodollars there was heavy liquidation of blue March 3EH puts. As an example, 3EH 9937p, the most popular long strike for put spreads, lost 40k in open interest yesterday; settled 5.0 vs 9952 in EDH4.
–2EU 9962 straddle settled at just 22.0 bps with 309 days until expiration. Underlying contract is EDU’23 at 9960. This price is forecasting utter lethargy in rates over the next few years. Of course, Powell is promising the Fed will continue to support everything, for now keeping the current pace of treasury and MBS purchases, but eager to jack it up. Worth noting that the operational statement instructing the desk also adds: “Increase holdings of Treasury securities and agency MBS by additional amounts and purchase agency commercial mortgage-backed securities (CMBS) as needed to sustain smooth functioning of markets for these securities.” I.e., do whatever is necessary.
–Employment report today with NFP expected 600k, but the risk appears to be a much lower number.
–There were a few large trades worth mention. Buyer of 25k FVF1 126.25/126.5/126.75 call butterfly for 3.5. This settled 3.5 vs 126-0425 in FVH. DV01 in FVH is about $57; the mid strike in the fly equates to 26.5 to 27 bp five year yield vs current 32.9.
–In eurodollars, there was buying of about 60k EDZ1/EDH2 calendar spread for 3.5 up to 5.0. Big discrepency compared to 3m spreads right around it: EDU1/Z1 settled 2.5, H2/M2 at 0.5 and M2/U2 at 1.0. EDZ1/H2 settled +5.0, up 2 on the day with those two ED contracts showing the most volume of any contracts, 252k and 340k. Prelim OI figures are probably incorrect as they show little change +19k and -5k. They’ve got the same guys that are counting the ballots. This play is certainly related to the libor to SOFR transition. Dec ‘turn of year’ pressure has been flipped on its head.

