
Tech giants soar with Q2 GDP -32.9%
July 31, 2020
–On a day when Q2 GDP showed a historic plunge of 32.9%, and Trump suggested the election be postponed, tech giants FB, AMZN, AAPL released better than expected earnings and soared in after hours trading. At the same time, yields are making new lows with the two-yr just under 12 bps, and fives 22.6. Tens ended at 53.8 with TYU 140-005s, the highest ever settle of a front TY contract. It’s a bit higher this morning at 140-03 even with NQU up over 100. Red, green and blue euro$ contracts settled at highest levels ever, with EDU21 and EDH22 at peak levels of 9985 or 15 bps. The ten year inflation-indexed note made a new low of negative 98.3 bps, so of course Dec gold made a new high this morning at 2005, and is currently 1993.8, up $27. The dollar index is making new lows. The only thing that makes sense is that Russell futures are down slightly. Otherwise it’s all a bit Ozzy.
–Over the month of July SOFR has been 9 to 13 bps, with the two year note yield currently right there.
–Today’s news includes Personal Income and Spending, with Core PCE prices expected 1.0% yoy. Also, final July one-yr and 5-10 year inflation expectations from UofM, which were 3.1 and 2.7 at the mid-month release.
Powell vows to do what he can as GDP expected -35%
July 30, 2020
–Powell vowed continued support for the economy at yesterday’s FOMC. Yields at the front end pressed lower with twos down to 12.3 bps, a decline of 1.2. Tens were unch’d at 57.7 and thirties rose 2.3 to 1.244%, providing a small bounce in the curve. Notable buying in EDZ0 as swap lines to central banks were extended…appears to be short covering as open interest fell in the contract. EDZ0 closed +2 at 9972.5 (strongest contract on the strip), while FFF1/EDZ0 spread closed at a new low of 24. (Proxy libor/ois).
–New high in ten-year note to inflation-indexed yield breakeven spread at 153.4 bps, as the tip yield hit a new all-time low of negative 95.7 bps. DXY made a new low yesterday as well with EUR popping above 1.18 for the first time since Q3 2018. Current 1.1747.
–Today’s news includes Q2 GDP which is expected down around 35%. Whether anticipating the shock of the actual number or concerned about this afternoon’s earnings, stock index futures have reversed yesterday’s gains. After the close FB, Alphabet, AMZN, AAPL all report. Newmont this morning. Of course, lack of an agreement on extending the $600/week will also cut oxygen from stocks, and that deal doesn’t seem any closer today.
FOMC day
July 29, 2020
–In front of today’s FOMC meeting the curve flattened with many spreads making new recent lows. Ten year yield fell 2.5 bps to 58 bps, within a few bps of all time lows. 2/10 is at its recent low of 43.8, while the red/gold euro$ pack spread fell 2.125 to a new low (since March) of 35.625. Red/gold has a double top at 62 from the March spike and June surge. Implied vol in rates continues to grind lower, even from these basement levels.
–Several articles suggest the Fed has to maintain extremely loose conditions. For example, Reuters notes that S&P has made 1190 downgrades so far this year, just 136 shy of the 2009 total, with plenty of time left in the year to catch up.
https://www.reuters.com/article/us-health-coronavirus-ratings-graphic/how-the-coronavirus-is-crushing-credit-ratings-idUSKCN24U18Y
| How the coronavirus is crushing credit ratings – ReutersThe crippling effects of the coronavirus crisis have crushed government and corporate finances and sent debt soaring. As the charts below show, it is also crunching their credit ratings and …www.reuters.com |
Another article notes that banks are cutting credit limits or simply closing credit card accounts. According to CompareCards, from mid-May to July, 25% of cardholders had an account involuntarily closed and 33% had limits cut. Evictions are also expected to rise as the moratorium on non-payment ends. If Congress can’t agree on a large new package to replace the $600/week, then the Fed is going to have a much bigger job on its hands that it can’t possibly win. If the curve gets any flatter it will only cause banks to draw in their horns, putting the Fed in the position of being a direct lender without an appropriate transmission architecture. No matter what the Fed says, accommodative conditions will continue with massive growth in the balance sheet. Gold has pulled back a couple of bucks to 1955, but bitcoin is still above 11k, and DXY is at a new low this morning.
–Heads of FB, AMZN, AAPL and GOOGL appear before the circus known as Congress today, right before tomorrow’s earnings reports (after the bell)
Fed and Treasury. Buying and Selling
July 29, 2020
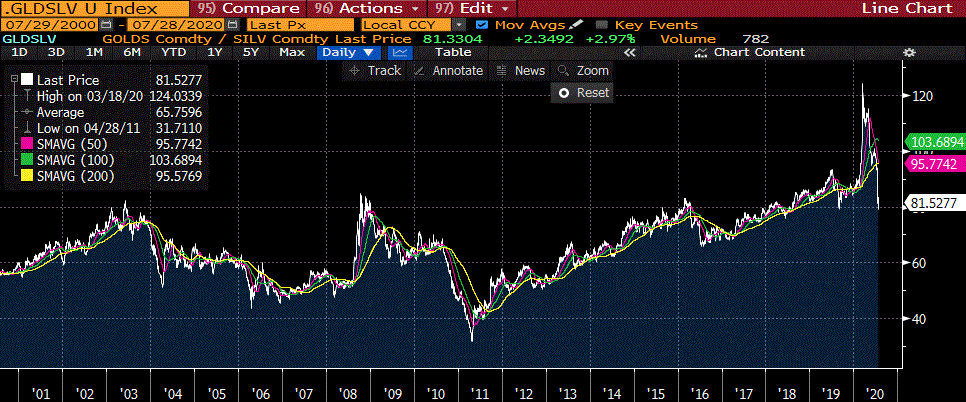
–Yields edged slightly higher yesterday with tens squeezing just above 60, up 1.8 to 60.5. Implied vol remains blanketed, with TYU 139.5^ settling 56 or 3% vol. Gold soared to a new high but silver outperformed. Gold/silver ratio now 81.5, below the triple top of 82 in 2003, 84.5 in 2008 and 83.25 in 2016.
–The NY Fed released a new purchase schedule, buying 12.8 billion of short term debt today 0-2.25 yrs, while the treasury auctions $44b of 7’s. One might think that would result in a steepening trade, but the Fed will also be buying ~$5.5 billion in 30y MBS. I am adding the links of schedules here, as they aren’t easy to immediately access on the NY Fed website.
https://www.newyorkfed.org/markets/domestic-market-operations/monetary-policy-implementation/treasury-securities/treasury-securities-operational-details#current-schedule
https://www.newyorkfed.org/medialibrary/media/markets/ambs/AMBS-Schedule-072820.pdf
–As ZH summarizes, the Fed will buy approx $9 billion per day in treasuries and MBS for the next two weeks.
–The administration also released its plan to replace the $600 week. It is, of course, smaller. It was, of course, derided by Democrats. It will, of course, result in a last minute compromise when stocks force the issue.
–FOMC tomorrow.
–Chongqing hit by massive flooding. “HK’s Econ Times reports that by 6 am Monday morning the water level at the Cuntan hydrologic station in Chongqing rose to 180.5 meters, exceeding the warning level for the first time this year.” Btw, Three Gorges is 185 meters.
https://www.taiwannews.com.tw/en/news/3975669
NOTE ON GOLD AND OPEN INTEREST
July 27, 2020
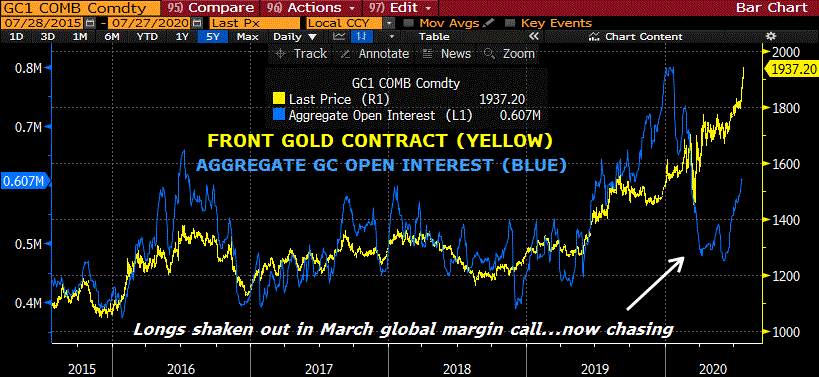
On June 29, I put out a tweet with a chart of the front Gold (GC) contract and aggregate open interest, suggesting that longs were blown out of the market in the global COVID-inspired margin call in March, and might have to chase the GC contract up to re-establish longs. A friend (thanks Marco) suggested that I update the chart. At the time (end of June) agg Open Int in GC was 546k contracts. Currently aggregate OI is 607k contracts, which is still well below the high in the beginning of the year of 800k, EVEN THOUGH GOLD MADE NEW HISTORIC HIGHS TODAY. I’m no expert on global flows of gold, but to me, this suggests that there’s plenty of upside room. Below is the updated chart.
Two additional notes.
First, there was an article on ZeroHedge that 5.5 million ounces of gold were delivered into the June Gold contract expiration. Typically a negligible amount of physical is delivered. The author suggests it’s because NY gold was trading at a premium to London, creating an arbitrage opportunity. Clearly there is intense focus on gold as an investment theme currently, as any scan of financial press headlines will confirm.
https://www.zerohedge.com/markets/record-170-tons-physical-gold-were-just-delivered-comex-heres-why
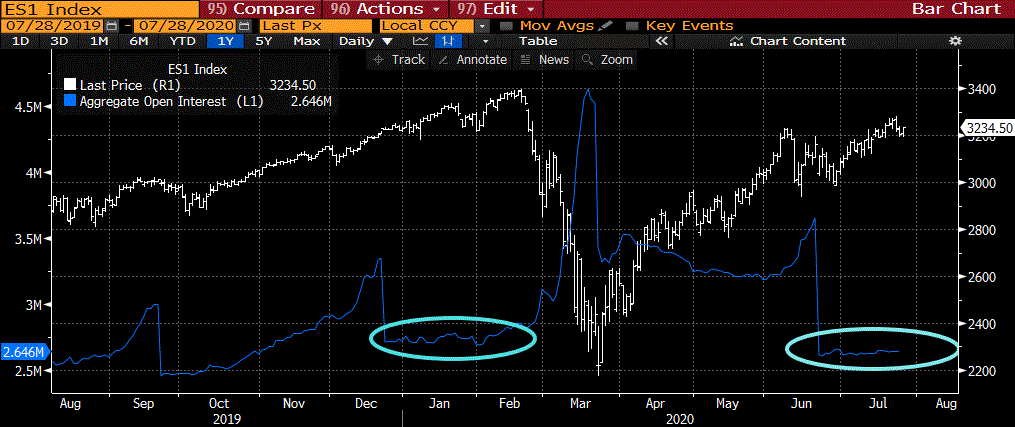
Second, and this one might be a bit of a stretch, I also created a shorter term chart with the front emini SP contract, ES1, and aggregate open interest. What we see here is that open interest soared in March, as portfolio managers used the contract as a hedge against long stocks. You can see that from the start of the year until early Feb, the contract didn’t register much of a demand for a hedge, as open interest was horizontal. I overlaid VIX as well, but it essentially shows the same dynamic so I omitted in the interest of simplicity. We want the hedge after it starts to move. What I find a bit interesting here is that even with VIX at around 25, open int in June and July is also flat-lining at a slightly lower level than the start of the year. It just seems as if the market is convinced the Fed has our backs and will continue to support the rally. No use in taking any proactive safety measures. De-fund the hedge.
Precious metals jump as USD dives
July 27.2020
–Gold and silver are exploding with the former at an all-time high $1940. Silver is above $24/oz; it’s all-time high was near $50 in April 2011. Bitcoin has vaulted above 10,000. The dollar index (DXY) is at a new low for the year sub-94; hasn’t seen this level since 2018. Stocks also staging a rebound from Friday’s close. Bonds are lower of course, right? No, that would be wrong. Bonds are edging close to new low yields, with tens at just 57 bps, down 1.7 from Friday. The low in March is 54.3.
–Big earnings reports this week: Visa, Tuesday post-close. Shopify Wednesday, pre-open, FB Wed-post, P&G Thursday-pre, AAPL, AMZN, GOOGL all Thursday post. Wednesday also features the FOMC meeting, with Thursday’s Q2 GDP expected -35% and Friday’s PCE deflator yoy expected +0.2.
–The White House and Senate republicans have agreed to a package at 70% of wages to replace the $600/week, to be unveiled later today. Pelosi says Congress won’t leave for August break until a deal is resolved. Chicago violent crimes and homicides are up 75 to 78% year over year. The same move in silver would put it over $28/oz rather than the current 24.
Party like it’s 1999
July 26, 2020 – Weekly comment
“All generalizations are dangerous, even this one.” – Alexandre Dumas (b.24 July 1802)
On Monday, I saw a tweet by Ed Bradford, @Fullcarry “Starting to feel a bit 1999 ish.”And I responded, “a bit”? Gundlach has also referred to 1999. Maybe he heard it from Bradford first. So I started to think about 1999. It’s 21 years ago. An overarching concern in 1999 was dependence on technology and the Y2K issue. The fear was that the banking system might freeze up, that air traffic would cease, that all the systems which relied on code were at risk. I’m sure there were preppers before that time, but Y2K gave that particular movement an honest kick in the ass, just as COVID has now. The Robinhooders of today were between 3 and 15 years of age at that time. So I am dusting off the ECNC story that I wrote a long time ago which captured a bit of the frenzied trading environment of that time (I’ve changed the names). It’s a lot easier than trying to come up with something clever to write about in the zero rate framework that we find ourselves in today.

First, here is a quick backdrop for 1999. CPI accelerated from 1.5 to 1.6 on a yoy basis in Q4 1998, up to 2.6-2.7 in Q4 1999, then to a peak of 3.8% in March 2000, settling back to around 3.4 in Q4 2000. The Fed therefore was in a hiking mode, raising from 4.75% to 5.0 in June’99 and continuing to hike, reaching 6.0 in March 2000, before finally putting the final flourish of a 50 bp dollop in May 2000, even after Nasdaq had topped. Unsurprisingly, the US dollar was generally firming throughout this period. The 2/10 spread was fairly stable through late 1999, ranging between 20 and 40, but inverted in Feb 2000 as tightening bit. It was the increase to 6% in March that popped the Nasdaq bubble. However, the imagery of the word “popped” is that the air was instantaneously expelled, never to be put back in again. But it was messier than that. From Sept of 1999 to the peak of 4816 in March 2000, Nasdaq had doubled. By the time of the June hike, it had dropped nearly 40% from the high to just under 3000, but then it rallied to nearly 4100 by July. The real damage occurred from Sept 2000 to April 2001, a decline of 67% (4150 to 1350). It’s worth noting that SPX had nearly matched its March high by September, and then fell only 27% by March.
There have been a lot of crazy rallies in tech stocks since the low in March of this year. But from then until this month’s high the move in NDX is 63%, and that’s at a time when the Fed has eased, not tightened, and is promising to keep rates near zero for years. The dollar is beginning to move south. The 2/10 treasury spread had inverted briefly in Aug 2019, but more recently has been between +42 and 52. There are a lot of charts that indicate stocks are more expensive than they were at the 2000 peak (see Mauldin ‘Valuation Inflation’ from this weekend). But maybe they SHOULD be. After all, in 2000, one can partially accuse the Fed of tightening too much as a catalyst for the crash. No hikes on the horizon now…
The implication for the 1999 comparisons is that we’re close to peak crazy, and that everyone who has recently said, “This can only end badly” will be able to take a somberly smug victory lap. In my opinion, it’s not overt action by the Fed that is the mostly likely culprit for a downward resumption in stocks, it’s the Federal Gov’t. The $600/weekly payout has caused the federal budget deficit to explode ($864b in June alone). It’s set to expire this week, and as of now has not been extended/replaced. The Federal Gov’t has carried the economy on its back this year, and by extension has pumped stocks. Of course, a huge amount of support has been provided by the Fed as well. The problem is that while both the Fed and the Federal Gov’t have done a yeoman’s job in manning the buckets to bail out a leaky boat, the minute they slow the pace, either by a stalled weekly payment package or by letting the balance sheet drift down, the boat is going to start to sink. It’s not proactive tightening, it’s passively slowing the pace of assistance.
The ECNC story
I was in the CME member breakroom at around 9:30. The breakroom was in the southeast corner of the building, with large windows looking out onto the corner of Wacker and Monroe, a small retreat from the cavernous, windowless trading room. There were a few CQG and newsfeed computers tucked just to the north, on the perimeter of the actual trading floor. That’s where the disheveled, elfin Indian clerk with long wavy black hair would run his charts and mutteringly dispense ideas to anyone that would listen, and I often did. For some reason there was a Quotron in the actual lounge and I was in line to get a couple of live stock quotes, with other people sitting around having a coffee or watching Sports Center. Behind me was MA, a filling pit broker in eurodollars, also waiting to get quotes on stocks…because this was the year 2000, at the height of Nasdaq mania, (but you still couldn’t just punch up an instant quote on your phone).
I had started at Refco just before the turn of the century, in late 1999. The Refco Eurodollar desk was on the east side of the floor, all the way at the top level of the tiered desks that surrounded the pit. Lehman was next to us, Chicago Capital was immediately below. There were about eight of us at the desk occupying three booths, probably 30 sq ft of floor space. Front month Eurodollars were directly in front, back months stretching to our left (south) and the ED option pit to our right. The shape of the connected pits was roughly a rectangle that spanned nearly a full city block, packed with order fillers, locals, and clerks, with back month dollars at the south end, then the 3rd and 4th contracts, then the second and then the front month, with the back months at a higher elevation to provide straight sightlines, down to ground level in the front months, and again slightly elevated at the north end, the option pit. On either side of this rectangle were desks, tiered up like a stadium.
Although the turn of the century was punctuated by concerns about Y2K computer problems and banks had curtailed trading activity because of possible computer system issues, the Nasdaq boom was in full force. In the year from March 1999 to March of 2000, Nasdaq went from just below 2000 to just above 4800. In the meantime, rates were increasing fairly aggressively. It was way back in 1996 when Greenspan had opined “But how do we know when irrational exuberance has unduly escalated asset values, which then become subject to unexpected and prolonged contractions as they have in Japan over the past decade?” Though that line got widespread notice, it was a bull market that shrugged off warnings from Central Bankers and everything else.
From mid 1999 until May of 2000, the FF rate went from 4.75% to 6.5%. I know there’s a lot of talk of the ‘Greenspan put’ but compared to current CB policies designed to instantly countervail any ill winds that buffet the market, Greenspan used his power sparingly. I would simply note that the Fed kept the FF target at 6.5% from May 2000 to December 2000 when a LOT of air was rapidly coming out of the Nasdaq bubble. I recall one of my old clients from Bankers Trust (then at DB) telling me, “It doesn’t matter what rates do, these Nasdaq companies have no debt. It’s all equity. Higher rates don’t affect them. And I would say “I don’t think that’s quite right.” But he was long a ton of stock and was riding the Nasdaq bull. Hard. Just to think of it makes me smile, because I have a few stories about this individual, who embodied everything right and funny about this particular business. Those stories are for later, in a more extensive format.
OK, let’s get back to the Quotron line and MA. I’m in my grey mesh trading jacket and he’s in green. VO is snoring in the lounge chair next to us with vending machine wrappings in his lap, having filled a bazillion options in the last 2 hours. I punched up a couple of quotes and Mike says, ‘hey Alex, do you own any of this?’ And I said, ‘what?’ ECNC. Now this was in February of 2000. I said I didn’t. He replied, ‘Everyone on the floor owns this thing.’ So I wandered back to my trading desk, having jotted down my quotes on a trading card and having ECNC on my mind. And when I got to the desk, it wasn’t busy at all, and I said, “Hey, you guys ever hear of ECNC?” I think Scooter was first to say he owned some, and someone else said I have some, and Doyle, just a junior clerk at the time said “I own a couple thousand shares.” I, of course, was incredulous. How had I not heard of this? So I turned around and logged into my account and bought a few thousand shares myself, but it had already been moving. Just to give you a flavor of the time, I didn’t know what the company DID. I don’t think anyone at the desk knew. The name of the firm (I learned later) was actually E-connect.
I don’t recall the exact price, but I paid something like 1.60. It was then that I learned that our pit clerk in the third and fourth option (3rd and 4th contract months) owned something like 50k shares (his relative in NY at Merrill had given him the tip while it was still under $1). I learned that traders in the option pit were also loaded up. Crazily, within a few days, my shares had doubled. I think I sold out half at something like $4. And then it just kept running. In hindsight I thought this took a MUCH longer time, but literally within about another week the shares had doubled again. I sold the rest of mine at a price just below 10. And of course, I was happy… for about a day. But this thing had taken on a life of its own. Craig, the futures clerk who worked for UGG, was riding the whole position as I recall. Next thing I know the stock is around $14 and moving higher, ultimately shooting over 20. And I am saying to myself, “I am a F*$%&G idiot! Why didn’t I just hold out?” But I also remember thinking, unless these guys have cured cancer there is no reason this stock should be flying like this. In any case, my self-loathing was short lived, because the stock was halted in mid-March due to creative financials. It turned into a total loss for the guys that held it. In April, Fronz told me his story. He was a jovial clerk on the other side of the pit. He said he owned it while he had gone to Florida on a vacation with the family, and was checking the stock from there. He was having a grand old time, saying “So THIS is how the big guys do it, printing money while sitting on the beach drinking cocktails festooned with umbrellas.” He of course, returned home to a halted stock, worthless, but was laughing about it and enjoyed telling the tale.
So, how does the ECNC story tie in to today? While ECNC was one of many flame-out dotcom companies, its demise came just a couple of weeks prior to the ultimate Nasdaq top. People were just buying into the story of untapped potential, riding the wave without really thinking it through. Sound familiar?
Oh, by the way. When looking back and doing some ‘research’ for this piece, I found out what E-connect did. From a blog: Econnect Holdings in the spring of 2000 at $0.96 had a quizmo to attach to your computer that you could swipe your credit card through and pay for purchases on line. Seemed to be a good idea to me….kind of like Square.
| 7/17/2020 | 7/24/2020 | chg | ||
| UST 2Y | 14.3 | 14.7 | 0.4 | w/I 14.7 |
| UST 5Y | 27.9 | 27.2 | -0.7 | w/I 27.7 |
| UST 10Y | 62.5 | 58.7 | -3.8 | |
| UST 30Y | 132.7 | 123.6 | -9.1 | |
| GERM 2Y | -66.4 | -65.1 | 1.3 | |
| GERM 10Y | -44.7 | -44.8 | -0.1 | |
| JPN 30Y | 57.9 | 57.1 | -0.8 | |
| EURO$ U0/U1 | -7.5 | -6.0 | 1.5 | |
| EURO$ U1/U2 | 4.0 | 3.0 | -1.0 | |
| EURO$ U2/U3 | 13.0 | 11.5 | -1.5 | |
| EUR | 114.38 | 116.54 | 2.16 | |
| CRUDE (active) | 40.75 | 41.29 | 0.54 | |
| SPX | 3224.73 | 3215.63 | -9.10 | -0.3% |
| VIX | 25.68 | 25.84 | 0.16 | |
Holding back liquidity
July 24, 2020
–Stocks retreated yesterday and are poised to start the US trading day lower, with deterioration in US/China relations said to be the main catalyst. A flattening bias has pushed 2/10 to a new recent low of 43.7 bps and 5/30 sub-100 at 98.3. Red/gold pack spread is 37.5, -1.375 on the day.
–August treasury options expire today with TYQ 139.5 straddle settling 12 vs 139-20. The high so far today is 139-25, so calls were 18 in the money, but the contract now prints 139-18. New Home Sales and Markit PMIs released today.
–Larry Kudlow was on with Maria Bartiromo yesterday morning talking about improvement in various data points, and concluded, “I still think we’re in a self-sustaining recovery.” Self-sustaining?!?!?!? I suppose that means the $600/wk being doled out by the Federal Gov’t no longer is needed, right? Same with the Fed buying every asset in hopes of propping up prices. As we draw nearer to the end of July and stocks remain pressured, some type of last minute extension bill on weekly benefits is likely to be passed. If not, watch out below.
–In August 2005, New Orleans was flooded by Katrina. A much bigger disaster looms if the Three Gorges Dam collapses. In the early part of 2005 tens were in a range of 4.00 to 4.60. From June into early August the yield went from 3.90 to 4.40, and then turned lower. As the flood hit, the yield fell from 4.17 to 4.00, bottoming on Aug 31, and then starting a run to new highs in 2006. From the end of April to early July China’s ten year has gone from 2.50 to 3.10 and now has begun to retrace, now 2.87. Shanghai Comp had a huge surge in early July but is now retracing, down 3.8% today. I’m not sure of market reaction to more extensive flooding in Wuhan, but it would probably temporarily ease US/China tensions due to the scale of humanitarian disaster. In any case, here’s a viral video of simulated flooding (at bottom of first link). By the way the height of the dam is 185 meters and the water level has reached 165 meters.
https://www.taiwannews.com.tw/en/news/3973169https://asiatimes.com/2020/07/yangtze-deluge-tests-limits-of-three-gorges-dam/
Minutia
July 23, 2020
–Once again, a light volume trade in rates with a bias flatter. Tens fell 1.1 to 59.4 while 30s fell 2.2 to 1.29%. On the euro$ curve, marginal new lows were posted in spreads from reds to deferred, with the red/gold pack spread just under 39 bps. 2/10 notched a new low at 45.
–The ten yr inflation-indexed note equaled its all-time low from late 2012 at -91.7, having ended yesterday at -90.5. This of course, is helping to push USD to new lows, with DXY closing at its lowest level of the year, matching the spike low in March. “Investors” are thus pushed out the risk curve into can’t lose bets… like TSLA. However, these moves are having no effect on treasury vol, which remains under the blankets. With 30 days until expiration, atm TYU 139.5^ settled below one point at 62/64’s. The expiring August straddle settled at just 14. To give some small indication of compressed vol in the aftermath of the dislocations seen in March, note the following: At every treasury option expiry, there is a large buyer of wings to replace protection that is rolling off. Yesterday for example, there was a buyer of >60k FVU 123.75 puts for 1/64 (FVU settled 125-26). On April 21, FVM0 settled 125-17+, not all that far from the present level, but at that time he was paying 2 for 40k FVM 118.5 puts. I.e. he paid double for puts that were 5 points further out of the money. Also on April 21, he paid 2 for 50k TYM 131 puts ref 138-31. With futures now 139-18 (TYU), the 136 puts settled 2, three and a half points otm as opposed to eight. Of course, VIX was around 40 in mid-April as opposed to 24 now.
–Jobless claims today.
10y tip says silver has room to run
July 22, 2020
–Stocks opened stronger yesterday on the back of an EU Recovery stimulus agreement, but sold off late in the day as McConnell said he doesn’t expect Congress to pass a relief extension bill by next week. Kicking the can with last minute deals. Business as usual, at least in governmental affairs. Fed nominee Judy Shelton was approved by the Senate Banking Committee. Some had been concerned about her views on Fed independence, but that ship has already sailed.
–Interest rate trading has become extremely quiet. Tens finished down 1.3 bps to 60.5. There was a new buyer of 30k 2EZ 9950p for 3.75 ref EDZ2 9974, but all other midcurve puts in front of 2EZ only traded 18k in total.
–The ten-year inflation-indexed note (real) yield dropped to -89.5, essentially equaling the 2012 all-time low of -91.7. Little wonder that precious metals are breaking out, with a sparkling surge by silver this week of nearly 20%.
–Since the real 10y yield is approximately equal to the all-time low of 2012, I thought it might be worth taking a look at where other markets were at that time. In late 2012 DXY was around 80, having rallied earlier in the year up to 84. Currently DXY is at its low of 95, having surged to 102 in late March. Gold was at $1800. It hasn’t been that high again…until now (1858 currently). Ten year yield was 1.50% vs 60 now. 5/30 was over 200 bps vs 104 now. Finally, SPX was less than half its current level at around 1400. By the way, silver was 35, vs 22.20 now.

