
Gold grinding to new high
July 8, 2020
–Gold turned around and closed on a new high yesterday, now testing old highs from 2012. The peak was in Sept 2012 at 1921, but 1800 is a big level and spot is just above that price this morning. GCQ0 settled 1809.90.
–Rates are dead in the water in spite of ten year auction on today’s docket. Ten year was 64.8 late, down 3.3 on the day. W/I was 65.5/65.0. Blue July 9962.5 straddle which expires Friday closed at just 3.5 ref EDU23 9964.5. The put is currently 1 offer vs 64.5 bid, which seems to me to be a cheap hedge against the ten and thirty year auctions.
–Buyer yesterday of 8k 2EU 100/100.37c spread for 1.5 ref 9978.5 in EDU’22. Settled 1.25 (1.5 and 0.25). Two months until expiration.
–On Friday July 3, three month libor set at 27.588 bps, lowest since early 2015. On Monday it was 27.650. Fed Effective EFFR was 9 bps Monday and SOFR was 10. Both have edged up a few bps from early June, but there’s little sense of pressure for the July 15 tax date which is also the settlement date for this week’s auctions. One month libor is just above 16.5 bps.
–Russell 2k had a bad close …new low for month of July. Not so for SPX or for Nasdaq. Russell seems to be a bit more sensitive to actual economic news while Nasdaq is all about liquidity.
China stocks
July 7, 2020
–Another new low in the US 10y inflation-indexed note yield at -79.6. I have seen several articles recently comparing the rate of change on the tip yield with the price of gold. From early June until now the tip yield has gone from -40 to nearly -80 while GCQ rallied from 1690 to 1800. As real yields fall gold becomes more attractive.
–However, price action in early July is centered on Chinese stocks. Shanghai Comp has surged 14% since June 30, to this morning’s high of 3407 on the back of official party cheerleading that would make Trump blush. According to a piece in ZH loosely citing Rabobank, the issue is capital outflows from China, especially given the situation in Hong Kong. Authorities are trying to generate inflows through equities. It’s becoming a global tactic…harness the retail bros.
–US rate futures were quiet yesterday. Ten year treasury rose 1.2 bps to 68.1 as the treasury kicks off auctions with threes today. There was a seller of about 35k EDU0/EDZ0 spreads at 3.0 to 2.5. I thought it might be a clumsy play for a Biden victory coupled with an immediate stock crash (pre-election vs post-election contracts), but open interest reveals a simple roll as Sept OI fell and Dec gained.
–July ED midcurves expire on Friday. A cloud of lethargy has settled over the short end. An example is the 3EN 9962.5^ which settled 3.5 as the underlying EDU’23 settled right at strike, 9962.5. Blues can’t move 3.5 bps over a week?
–Stock index futures have reversed overnight and are trading somewhat lower. Bostic said that the recovery seems to be leveling off and a Reuters piece notes that global capex is expected to decline by 12% in 2020.
https://www.zerohedge.com/markets/real-reason-chinas-massive-market-meltup
Let’s end with a little Charlie Daniels. “I was raking in chips like Grant took Richmond…”
M2 and CPI
July 5, 2020 – Weekly comment
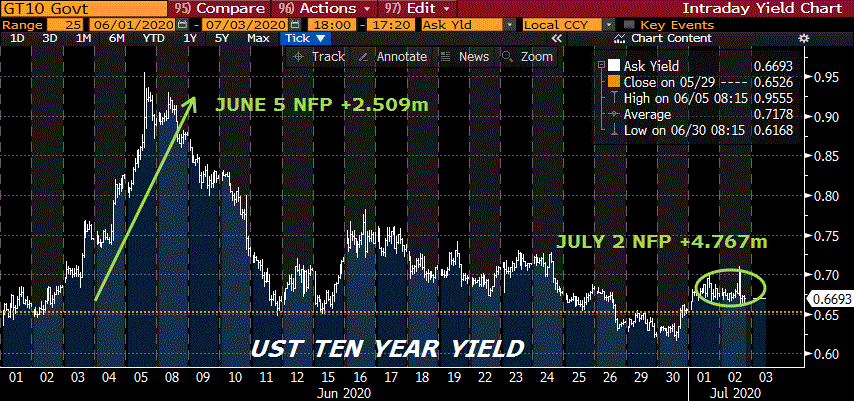
Friday’s payroll report was pretty much of a dud. NFP +4.767 million and the ten year yield barely budged, ending at 67 bps, 13 bps below the recent high yield of 90 bps set on the previous NFP released on June 5. In the week just ended, the US curve steepened, with twos -1.3 bps to 15.3 and thirties +6.3 to 1.433%. On a side note, in the land of yield curve control, the Japanese thirty-year ended the week at a new high of 64 bps, up from 30 in mid-March and 10 in September of 2019 (hasn’t been this high since March 2019). By contract the Japanese ten-year, which is what the BOJ had pledged to keep near zero, ended the week at 2.9, having been in a range of -5 to +5 bp since April.
Echoing the consistently higher yield in Japanese thirties is the trend is toward a lower nominal yield on the US ten yr inflation-indexed note, which was -75.2 bps late Friday, matching the low in 2013 and approaching the all-time 2012 low of -91. The breakeven spread between the ten-yr treasury and tip made a recent new high of 142 bps on Friday (high since early March). They are pouring into inflation protected securities. Why?
Here’s a tweet from Michael Ashton, @inflation_guy
Got tired of posting 25% y/y M2 growth rates. So decided to look at rolling 4y M2 growth rates. Interesting that the data falls into >8% and <8% pretty cleanly. The former is 1970s to mid 1980s. Plus right now. Can’t imagine why that would matter…
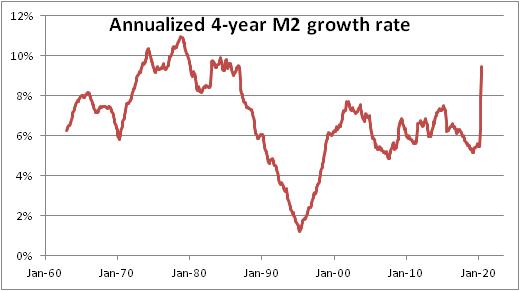
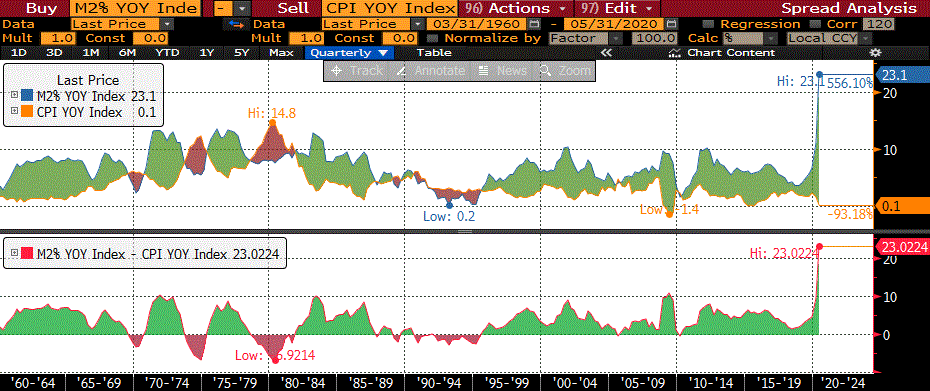
So currently the rolling 4-year M2 growth rate is above 8%, as it was in the 1970’s. Why would it matter? Well in the decade from 1973 to 1983, inflation as defined by CPI was above 5%. That’s why. It’s never the case where the annual growth of M2 exceeds inflation (CPI) by over ten percentage points. Until now.
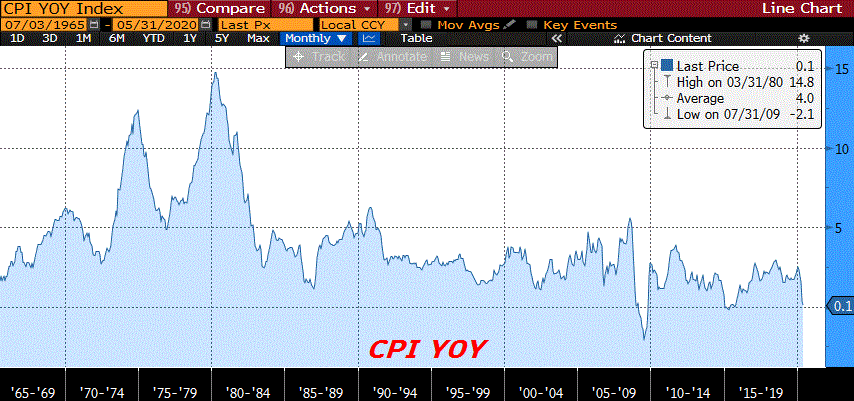
Below is a chart of CPI with last reading of 0.1%. Underneath that is a chart showing annual growth rates of CPI and M2, and a spread of the two on the lower panel. It appears as though inflation rates lag spurts in M2. Again, in the lower panel, the spread between the two doesn’t much exceed 10% since 1960. Now it’s 23%.
I again listened to a great lecture by Stephanie Kelton of Modern Monetary Theory fame from October 2018 (linked below). The presentation is well delivered, and of course temptingly seductive for the big spenders in the federal government. It’s basically superturboed Keynesianism. Keynes’ theory was that companies’ inventories may occasionally exceed INTENDED inventories, leading to unemployment and a decline in economic activity. Classical economists posited that interest rates would then fall and rekindle growth; Keynes argued that wasn’t necessarily the case, and at times of increasing unemployment and slack resource utilization the gov’t should step in to plug the demand shortfall. Kelton takes it a step further. The thrust of her argument is that the US Federal Government budget is nothing like a household’s budget because the gov’t can print the currency that its debts are denominated in. Therefore the budget deficit of the gov’t represents money spent into the economy which hasn’t been offset by tax collection, thereby driving growth and a surplus in the private sector. This extra spending is financed with bond sales. While these bonds are debts of the federal gov’t, they are assets to holders. Makes it all seem free, but of course the logical extension is that there is no limit to government spending to “help” the economy. That idea clearly collapses if all confidence in the currency is lost and high inflation results.
The national conversation, according to Kelton, is not “how to pay for a given program” but what the program should be, and what our poltical priorities are. In the short interview after the lecture she says the money should be spent “efficiently and judiciously”, which of course, dooms the theory from the outset, but she also talks about it in terms of putting slack resources to work. The limiting factor appears to be when resources are taut and price increases/inflation result. When has the government ever trimmed a program because of high resource utilzation?
One forward looking survey after another indicates that the public believes future inflation is heading higher. Lower nominal tip yields and a higher breakeven seem to corroborate this idea as does M2 growth. By the way, Trump just signed a five week extension for the Paycheck Protection Program. MMT is here. Now we will find out if/where there is a limitation. Growth in M2 makes me believe it will show up sooner rather than later in real-time price data.
OTHER MARKET/ TRADE THOUGHTS
Less than four months ago the Fed slashed the FF target by 150 bps. 2EZ 9975 straddle, which settles on 11-Dec of this year with EDZ’22 as underlying, settled at just 20.5 bps. The market is convinced that short end rates aren’t going anywhere over the next couple of years.
While the end of February and March saw tremendous volatility in the 3m libor setting, the forward spread represented by FFF1-EDZ0 has anchored between 26 and 30 for the past three months. The bigger picture is a repeat of the above: that the Fed has funding markets under control and will not allow another libor surge.
Copper has been rallying since mid-March and crude oil has rallied ever since the ridiculous decision in mid-April to allow futures contracts to trade negative. Both of these moves appear to be running out of steam, in need of a good pullback at the very least.
Treasury auctions 3, 10 and 30 year paper this week. As of yet, supply hasn’t been an issue; low yielding US dollar denominated bonds are being viewed as a safe asset, or at least an asset that the Fed will support in perpetuity. However, it bears watching how well long end paper is being received in this environment.
| 6/26/2020 | 7/2/2020 | chg | ||
| UST 2Y | 16.6 | 15.3 | -1.3 | |
| UST 5Y | 29.7 | 29.6 | -0.1 | |
| UST 10Y | 63.5 | 66.9 | 3.4 | |
| UST 30Y | 137.0 | 143.3 | 6.3 | |
| GERM 2Y | -70.2 | -68.0 | 2.2 | |
| GERM 10Y | -48.2 | -42.8 | 5.4 | |
| JPN 30Y | 57.7 | 64.1 | 6.4 | |
| EURO$ U0/U1 | -8.5 | -7.5 | 1.0 | |
| EURO$ U1/U2 | 5.0 | 5.0 | 0.0 | |
| EURO$ U2/U3 | 14.0 | 14.5 | 0.5 | |
| EUR | 112.21 | 112.30 | 0.09 | |
| CRUDE (active) | 38.49 | 40.65 | 2.16 | |
| SPX | 3009.05 | 3130.01 | 120.96 | 4.0% |
| VIX | 34.73 | 27.68 | -7.05 | |
(Stephanie Kelton presentation)
Huge NFP met with a yawn by FI
July 3, 2020
–The ten year yield declined on an increase in payrolls of 4.767 million! Midday at futures settle tens were 67 bps, down 1.3 on the day. A couple of the euro$ one-year calendar spreads notched new lows with EDZ0/EDZ1 now the lowest one-year on the board at -10, down 1 on the day. Of course, EDZ0/EDH1 is -9.5, representing nearly all of the Dec/Dec price. The ten year inflation indexed note yield is now -75 bps, matching the low from 2013 and nearing the all-time low of -91 in 2012. The ten yr note to tip breakeven made a new high at 142 bps. At the start of the year this spread, supposedly a long term proxy for inflation, was 180 bps, the March crisis low was 55.
–What a difference between this payroll number and last. The June release of NFP up 2.509 million caused a yield surge and steeper curve, with tens up to 89.6 bps which was a gain of nearly 9 bps on the day, and 2/10 up to 68 (+7). These levels were the highs of the month. Yesterday’s NFP of +4.767 million caused barely a ripple, with 2/10 at 51.6, essentially unch’d on the day. Of course, in both cases stocks rallied into and out of the data, with the top in SPX a few days after the payrolls report.
–TYQ 139 straddle settled 58/64, the equivalent of a little over 10 bps with two weeks to go. CLQ0 settled 39.80 on the June 5 employment report; yesterday at 40.65.
–Next week is quiet in terms of economic releases, with ISM Services Monday and PPI Friday. Treasury auctions 3s, 10s and 30s.
NFP – Happy 4th!
July 2, 2020
–Employment report today with NFP expected 3.058m. Currently stocks are positive and yields have edged slightly lower from yesterday’s settle, the dollar is lower. Mfg ISM released Wednesday showed a move back into expansion at 52.6, while Prices paid was also stronger at 51.3 vs 44.6 expected.
–Fed minutes had little effect on the market aside from solidifying the idea of low rates for a long time. That’s fairly evident from the euro$ curve as all contracts from EDU20 to EDZ22 are between 9970 and 9982. July midcurves expire one week from tomorrow and 2EN 9975 straddle settled at just 4.5 vs EDU2 at 9975.5. Though jobless claims and ADP have had violent swings, the market is priced for nothing to happen in the front end with today’s data. I’ll just note midcurve Sept atm straddles (72 dte): both 0EU and 2EU are 12.5 (vs 9982 in U21 and 9975.5 in U22) while the 3EU is 18.5. Of course the latter is at the 99.625 strike vs EDU3 at 9960.5. That is, the straddle is 1.5 times the premium of the nearer ones, but the strike of 37.5 bps is 1.5 times the 25 bp strike represented by the first two.
–St Louis Fed’s Bullard said that another flare-up of virus could spur a “wave of substantial bankruptcies” and of course, that’s exactly what we’re seeing. On a much shorter time frame, I can’t help but think the geopolitical situation could lead to weekend risk, especially on this 3-day weekend symbolizing US independence.
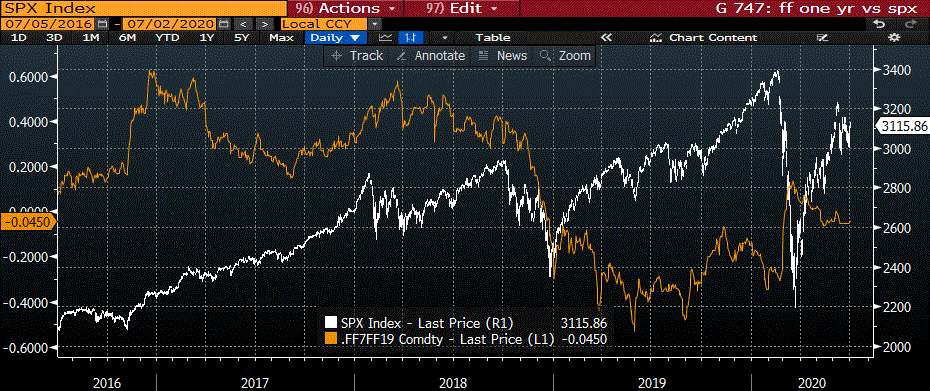
–There’s a post on ZH citing JPM’s Panigirtzoglou, that the Fed risks slipping behind the curve in terms of stimulus. (The Fed is already monetizing almost all US treasury issuance). I only skimmed the note so am probably not doing it justice, but he cites the forward 1y to 2y OIS curve – which is flattening and near inversion – as a risk to stocks. In yesterday’s note I mentioned that on the dollar curve EDM1/EDM2 which had settled 12 a couple of weeks ago had flattened to 2.5 (settled 3.5 yest). The attached chart shows the forward one-year FF calendar from 7 contracts out to 19 contracts out, currently Jan’21 to Jan’22, with SPX overlaid. I see no evidence of causation in this chart. In fact it seems the typical case is that as the short end of the curve flattens it helps stocks as the Fed is expected to lean more towards dovishness than hawkishness.
Equity?
June 30, 2020
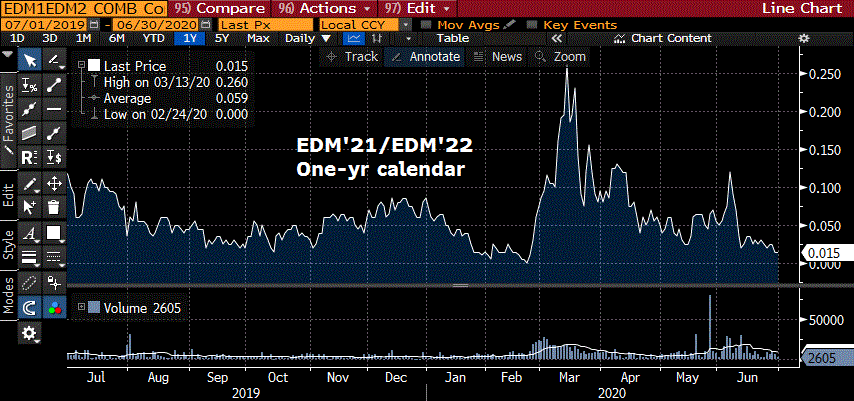
–In the beginning of June, EDM1/EDM2 spread surged, moving from 5.5 to a high settle of 12.0 on June 4. There had been a large buyer of 100k from 5 to 6, and the employment report last month made these buys appear quite prescient. On Feb 24, just after stocks had peaked, the spread had posted a low settle of zero. Yesterday it closed at 1.5, a new low for the month. Dashed on the rocks. In fact, all of the red/green spreads made new monthly lows yesterday even as stocks surged. The ten year yield was unchanged at 63.5; 5/30 spread bounced by 3.5 bps to close near 111.
–The Fed released comments from Powell on the website. What I found rather amusing was how many times Powell said new programs were “backed by CARES ACT equity.” (CAE) TALF is backed by $10 billion of CARES ACT equity. The PMCCF and SMCCF (bond and etf buying facilities) are backed by $75 billion of CARES ACT equity. The Main St Lending Facility is back by $75 billion of CARES ACT equity. Etc. The Federal Gov’t is running a huge deficit. THERE IS NO EQUITY. It’s as if I am trying to buy a new Lincoln Navigator backed by the equity in my 1972 Coupe de Ville. Obviously that’s a joke, because really, who wouldn’t rather just have the Caddy? The proper analogy is that I bought the Navigator with counterfeit bills. And financed it. At zero percent.
–Today we get the release of Chicago PMI. The last reading was just under the 2008 crisis low of 32.5, coming in at 32.3. In 2018 it peaked at 66.5. Today it’s expected to bounce, a good reason to put Main Street Loans to work in Nasdaq.

Forcing negative rates
June 29, 2020
–The highest print for a FF contract has been 100.07 on 8-May, FFF’22. It settled that day at 100.005. The highest settle in that contract was 100.03 on 14-May. Current market is 100.01/02. The high trade in EDU0 was 9981.5 on 16-March. On 8-May it traded 9977.5 and is currently 9972.5/73 with a block of 20k having gone through this morning at 73. Libor has been hanging around 30 bps; EDU0 9975 c are 2.5/3.0.
–The high print for any ED contract has been 99.895, and that was for EDU’21 (settled Friday at 99.815). On Friday, EDZ’20 100.125 calls were bought for 1.0 (open int in the strike is 32k). The short end of the market is pressing the Fed toward negative rates.
–Chesapeake filed for bankruptcy. On 4-June it was around 14 per share. On 8-June it had a crazy surge to 77.50 and closed just below 70 that day. By 10-June it was back below 17. It started the year at 165, but low energy prices coupled with crushing debt doomed the company’s fortunes. On an aggregate basis corporate balance sheets are as debt-laden as ever. The Fed hasn’t been able to hit inflation targets forever, so now has buckled and is just buying corporate debt as the Covid crisis flares again. High debt and lower activity/prices are constricting features in the covid economy. The Fed has been able to squeeze equities up, but CHK is a sobering reminder of how it can end without constant support. By the way, ten-year inflation-indexed note, which represents the “real” yield, closed at -70.7 Friday, a new recent low.
–Dallas Fed Mfg today. It was 0 in Feb, plunged to -74 in April, was -49.2 last and is expected to rebound further to -22.
pop
June 28, 2020 – Weekly comment
Sometimes it’s sort of funny when things go ‘POP’. But sometimes people get mad in what has become a humorless society. Which often makes it funnier.
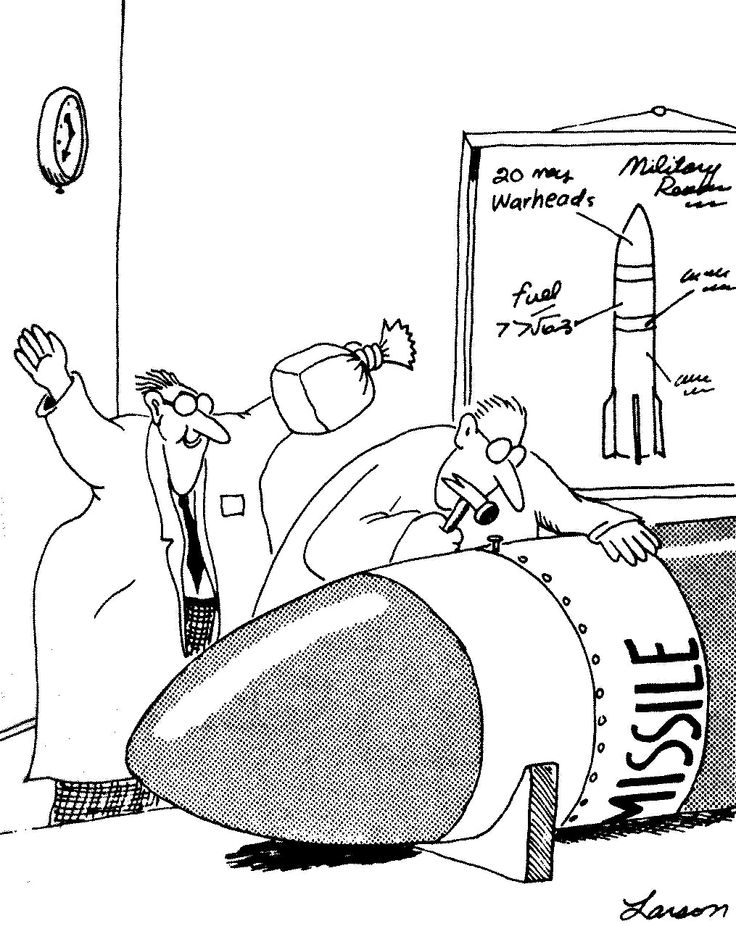
(FROM GARY LARSON/ THE FAR SIDE)
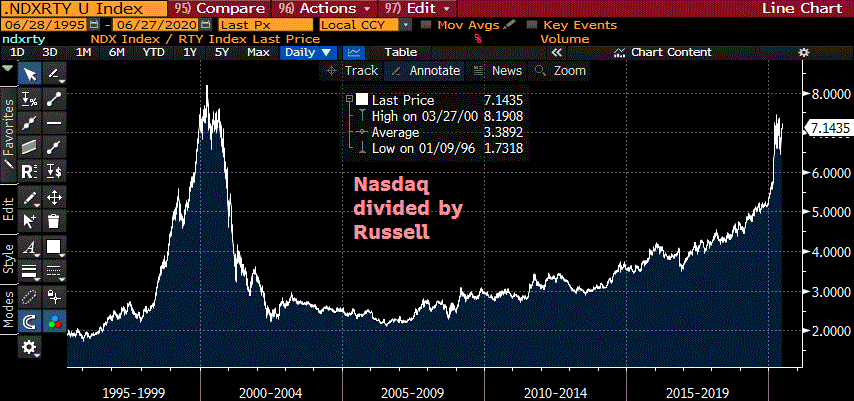
I am just going to post a few charts, and yes, I am plagarizing these ideas in part. Does that matter if I modified the chart data? Anyway, the first one is the ratio of Nasdaq to Russell 2k. I stole this one from Lance Roberts of RealInvestmentAdvice, (linked below) but he used SPX, which is even more dramatic because it’s at a new high. There’s no reason this ratio can’t go to ten I suppose. However, the wide ranges in the year 2000 are being echoed currently, and that to me is a sign of bearish instability.
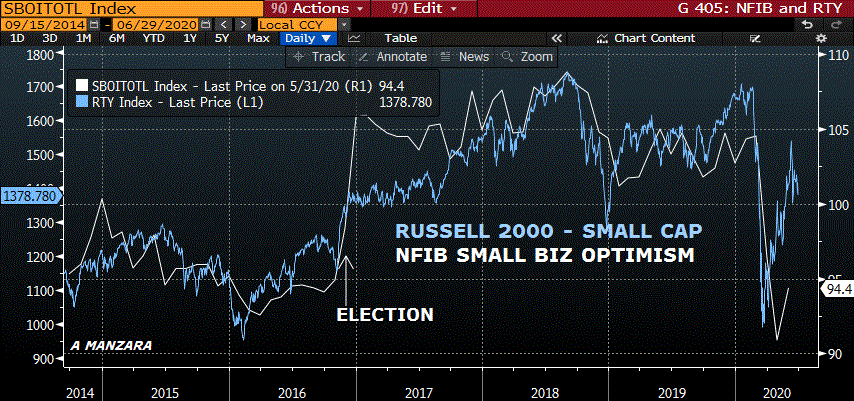
The next chart is one I came up with myself. The NFIB Small Business Optimism Index has closely tracked the Russell since 2009. Optimism really perked up after Trump was elected and the shackles of regulation were eased. The Russell caught up by 2018. Ironically, current NFIB is almost the same level it was prior to the last election (94.1 in September 2016 as Hillary looked like a shoe-in, and 94.4 now). In my mind, the outcome of this election, no matter who wins, will not likely have the same positive effect on confidence and animal spirits. Therefore, I believe the Russell rally is suspect, partially confirmed by the modest bounce in NFIB. Perhaps that’s how the NDX/RTY ratio will make a new high.
Yields continued to decline this week with tens ending the week at 63.5 bps and thirties at 1.37%, down nearly 10 bps since the previous Friday. As mentioned during the week, the 10-yr inflation indexed note yield is at a new low of -70 bps, within 20 of the historic low at the end of 2012.
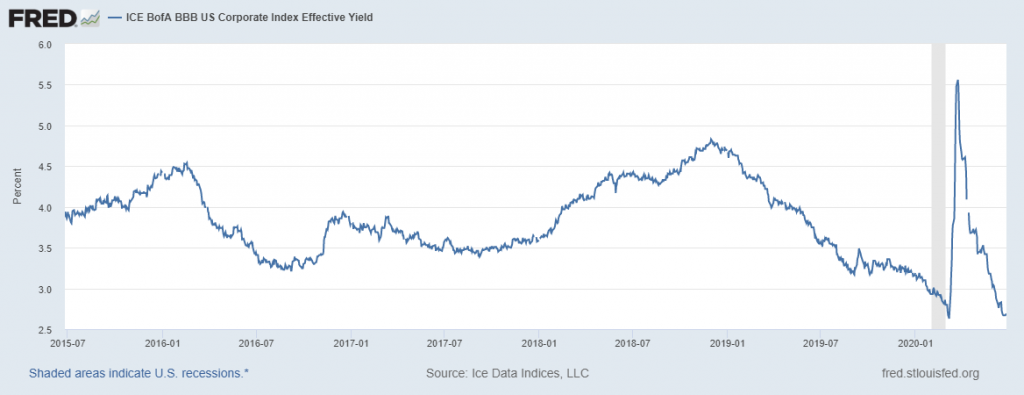
Below is the BBB effective yield from the St Louis Fed website. It has completely retraced the corona spike, even though the effects of the pandemic are nowhere near over. The current level is 2.7%. How are these companies able to borrow capital so cheaply?! Let me take a step back and consider the following: if I had 50 friends ask me if I would lend them money at a rate of 2.7%, if just two of them stiffed me, I would have a negative rate of return. It goes without saying I wouldn’t lend to me at that rate. Of course, the commercial bank credit card rate is over 15%. The delinquency rate on credit card loans is 2.73% (and rising). At least there’s a generous cushion in that spread. But there’s no cushion in this rate. It doesn’t matter…to the Fed. I get it.
OTHER MARKET/ TRADE THOUGHTS
There was a buyer Friday of Dec’20 100.125 calls at 1.0 bp ref 99.695. Peak euro$ contract is EDU’21 at 99.815, just 18.5 bps. Jan and Feb 2022 Fed Fund contracts (the furthest out listed) settled at the high on the curve at 100.015; negative yields. This at a time when the majority of Fed officials including Powell have said that negative rates are not an appropriate policy tool for the US. The market is forcing the issue in spite of the fact that Nasdaq, even with Friday’s sell off, is essentially at the level of the initial all-time-high in February (pre-Covid).
The vol crush in rates leaves TY at 3.6 to 3.7, back to pre-Covid levels. Given economic and social instability, vol is a much easier buy than sale. Shortened holiday week still includes the employment report on Friday, and the stock market is back to pricing weekend risk.
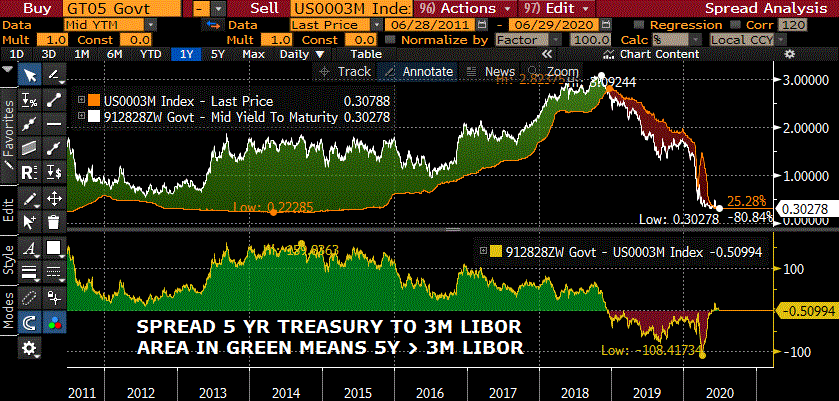
The chart below is three month libor vs the five year treasury yield. The red shaded area at the lower right hand corner shows that since the end of 2018, the libor rate (a proxy for bank funding) has been above the 5-yr treasury. We still haven’t really healed from the Q4 2018 stock sell off, and there are all sorts of bubbles: economic, social, geopolitical, just waiting for another pin.
| 6/19/2020 | 6/26/2020 | chg | ||
| UST 2Y | 18.5 | 16.6 | -1.9 | |
| UST 5Y | 34.0 | 29.7 | -4.3 | |
| UST 10Y | 69.7 | 63.5 | -6.2 | |
| UST 30Y | 146.6 | 137.0 | -9.6 | |
| GERM 2Y | -66.9 | -70.2 | -3.3 | |
| GERM 10Y | -41.5 | -48.2 | -6.7 | |
| JPN 30Y | 56.6 | 57.7 | 1.1 | |
| EURO$ U0/U1 | -8.5 | -8.5 | 0.0 | |
| EURO$ U1/U2 | 6.0 | 5.0 | -1.0 | |
| EURO$ U2/U3 | 15.0 | 14.0 | -1.0 | |
| EUR | 111.79 | 112.21 | 0.42 | |
| CRUDE (active) | 39.83 | 38.49 | -1.34 | |
| SPX | 3097.74 | 3009.05 | -88.69 | -2.9% |
| VIX | 35.12 | 34.73 | -0.39 | |
TIPS
June 26, 2020
–Not much to say about rate futures. Ten year yield locked just under 70 bps. TYU trading 138-29 this morning and July 139 calls expiring today trade 3, probably not even worth a look. Late yesterday the Fed limited banks’ dividends and banned stock buybacks as a result of stress tests. Given that share buybacks have been a major prop of the markets, I thought that news might be important. Nope. The WSJ had a blurb saying that stress could cause $700 billion in losses for banks. Does it really matter? The Fed is buying $80 billion in treasuries per month. Can’t print a few hundred billion to patch up the banks if things go sour?
–EDZ0/EDH1 slipped to a three month low settle of -9.5, down 1 on the day.
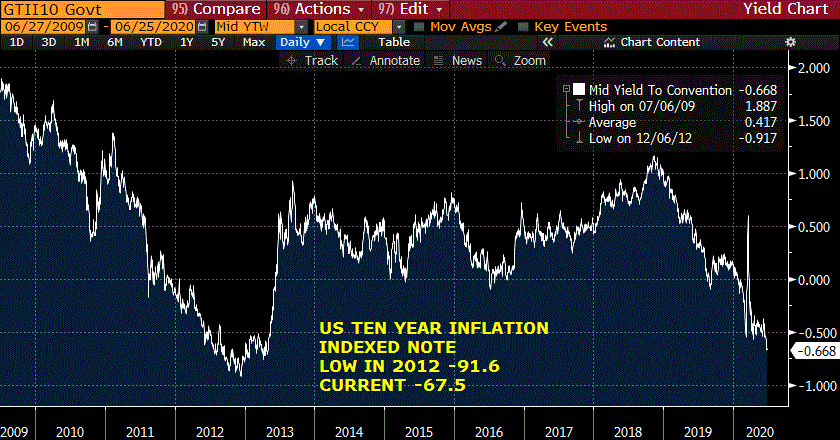
–News today includes Core PCE yoy prices expected 0.9% from 1.0 last. UofM long term inflation expectations provide a stark contrast, with the 1-yr at 2.6 and 5-10yr at 3.0. I suppose this is as good a time as any to delve into inflation-indexed note yields. I don’t know much about these securities. I seem to recall that one of my long commodity fund holdings had a big slug of tips in the portfolio, which makes some sense. IVOL, Quadratic’s Int rate vol and inflation hedge ETF has 86% of the portfolio in Schwab’s TIPS ETF. (The incestuous world of ETFs buying ETFs). I guess there can be all sorts of buyers for TIPS, but my point here is that there ARE buyers, as the ten-yr is making a new low yield of -67.5 (yesterday). This is closing in on the low in 2013 of -76 bps and the all-time low in 2012 of -91.6. The 30y tip, currently at -17 bps, made a new all-time low this year in April at -26.6. The five-yr is -81. Do we expect a ‘real’ yield of negative 67 bps for the next ten years? That forecasts a fairly bleak outlook. Sure, 2020 has had some challenges: pandemic, earthquakes, swarms of locusts (now in Argentina and Brazil), riots, and the Saharan dust cloud moving toward the US Southeast. But after this year, it should be smooth sailing. Right? Or is it that increases in CPI being foreshadowed by U of M and other sources are expected to overwhelm the negative yield?
zombie
June 25, 2020
–Yields eased a bit as stocks and crude oil tumbled. The ten year fell 2.5 bps to 68.2. SPX down 2.6% and CLQ0 settled -2.36 at 38.01. Option activity was light. July treasury options expire Friday. Increased virus fears appear to be the driving factor. News today includes Durables, expected +10.5% and Jobless Claims at 1.23 million. Seven year auction.
–I’ve attached a chart (from Mauldin Charts that Matter) which shows the rise of ‘zombie’ companies – those with earnings that are unable to cover interest expense. The chart shows that nearly 20% of listed companies now fall into this category. In a world where rates continue to fall, one would expect this line to be leveling off or even falling. Instead we have the merry-go-round of more companies needing to borrow just to service previous debt. I’m not sure the government, soon to be in the same boat, can help this problem. However, a BBG story notes that Illinois was able to cut its backload of unpaid bills from $6.9 billion to $4.8 billion this month after tapping Federal Reserve aid. I recall a previous story noting that unpaid bill balances accrue at an interest rate of 12% in IL.
–33 bp yield on the 5-year auction yesterday of $47 billion. This at a time when the market cap of AAPL increased $300 billion since the beginning of May. The framework of debt/interest/equity prices is now random.
**The official definition of a zombie company according to the Bank for International Settlements (BIS) “is a publicly traded firm that’s 10 years or older with a ratio of earnings before interest and taxes (EBIT) to interest expenses of below one.” More simply put, zombie companies are companies that are unprofitable — so unprofitable they are unable to pay even the interest on their debt out of their profits. They are effectively bankrupt but kept alive by banks continuing to lend them money to pay their existing loans.

