
Beyond reds
November 5, 2019
–Does supply matter? We’re about to find out this week as treasuries look to re-test the lows made just prior to the FOMC meeting last week, as auctions kick off with today’s $38 billion 3-yr (followed by 10’s and 30’s Wed and Thursday). Aside from supply, US/China talks appear to be progressing. For a long while, it didn’t seem to matter how much of a cash burn some companies generated. Now the market cares, as evidenced by UBER yesterday.
–The curve steepened with 2/10 up 2.8 bps to 19.4, near the recent high. Twos rose 2.8 bps to 1.59% and tens up 5.6 bps to 1.784%. Red/gold ED pack spread was up only 1.375 to just over 14 bps. Option activity was primarily selling, though activity was light.
–Jan20 FF settled 9846.0, just 4 bps higher than Nov, which has, of course, priced last week’s rate cut, settling at 9842 or 1.58%. The market is pricing a pause at the Dec FOMC, another negative factor for fixed income. FFF20/FFF21 settled -26.0 (one cut anticipated over the year). The peak area on the euro$ strip is the last two reds, EDM21 and EDU21 having both settled 98.51. The reds have been the apex of the curve for some time. In a policy environment where any thought of a hike has been shelved, the back contracts (beyond reds) should start to decline a bit more aggressively.
–The Fed’s Senior Loan Officer survey for October was released yesterday. Banks reportedly left standards on C&I loans unch’d, but demand for such loans reportedly weakened. Where demand was more robust, for credit card loans, banks reportedly tightened their standards.
–Today”s news includes JOLTS at 706.3k and ISM Services, expected 53.5 from 52.6.
The big data’s out, let’s sell some bonds
Nov 4, 2019
–New highs in stocks this Monday morning due to (I guess I’ll just chant this with everyone else) optimism on a China/US trade deal. Of course, central bank support continues to play a role, but that’s less apparent in the bond market with auctions of 3, 10 and 30 year treasuries this week totaling $84 billion. On Friday the ten year yield rose 4.1 bps to 1.728% with the curve flattening slightly. 2/10 closed 16.6 bps. Better than expected payroll data with NFP +128k and Private payrolls +131k along with previous upward revisions should have perhaps registered stronger selling in bonds but other data still casts doubt on economic strength with ISM Mfg 48.3.
–Implied vol hammered Friday. Midcurve straddles lost 2-3 bps across the board. For example 0EZ 9850^ settled at 19 from 21.5 on Thursday. Dec atm TY straddle went from 1’07 to 0’61 with three weeks to go. Future rate cuts are being priced as less and less likely. Nov/Jan FF spread settled -5.5. Jan20/Jan21 FF spread settled -31.5, indicating little more than one cut over next year.
–Post on ZH notes that freight rail traffic had a large decline into the end of October. This link from the American Ass’n of Railroads shows that 2019 is weaker than the past three years. https://www.aar.org/data-center/rail-traffic-data/
| Rail Traffic Data – Association of American RailroadsGauging U.S. Economic Activity Through Rail Traffic Data Since demand for rail service arises as a result of demand elsewhere in the economy for the products that railroads haul, rail traffic is a useful gauge of broader economic activity, both for specific industries and for the economy as a whole. A sample of current weekly, […]www.aar.org |
–News today includes Factory Orders expected -0.5% and Total Vehicle Sales.
It’s a mad world
November 3, 2019 – Weekly

In 2018, the dollar growth of nominal GDP was less than the dollar growth of the national debt. That means that there is no growth. We’re having an illusion of growth. It means that we’re issuing IOUs and spending it, and it shows up in the calculations as growth. But spending is not growth. –Jeffrey Gundlach from an interview with Finanz und Wirtschaft
That’s a pretty stark statement from Gundlach. Nominal GDP was $18.715 Trillion in 2016, $19.519T in 2017 and $20.580T in 2018. The change from 2016 to 2017 was $804B and from 2017 to 2018 was $1.061T. The Federal Budget deficit in FY2019 was $984 billion (from $779B in 2018). By borrowing and spending, “growth” occurs. A dollar borrowed is getting about a dollar added to GDP. Multiplier effect? Gone.
The picture above of course, is Alfred E Neuman, the Mad magazine mascot whose motto is “What, me worry?” Not to be confused with Adam Neumann who was single-handedly able to eviscerate some $40 billion in supposed value from WeWork. It is a mad, mad, mad world. Normally, I try to pull together market information and anecdotal news stories to create some sort of cohesive summary to the week. These days, it’s anything but cohesive.
There’s an interesting CNBC interview highlighted on ZeroHedge with Jim Chanos, famed short seller founder of Kynikos. The interview was from Sept 19. The conversation was about GrubHub, the price of which was nearly cut in half last week. But the interesting (worrying?) anecdote was that Chanos said many of the contractor/employees had been getting letters from the IRS saying they hadn’t been paying medicare and social security taxes of 15.3%. Typically, an employer pays half, 7.65% and the employee pays half. But independent contractors (should) pay the entire amount. That’s right off the top, even if total income isn’t enough to generate any additional federal tax liability. Chanos figures the 15.3% works out to about $2/hr for drivers. He refers to this model as labor cost arbitrage. Of course, in the bigger picture, the ‘gig’ economy is primarily independent contractors. That’s a lot of IRS notices. At the time of the interview GRUB was $62, it closed last week at $33.72.
The Fed, as widely expected and priced by near interest rate contracts, cut the target FF rate last week to 1.50/1.75%. The Fed signaled reticence to cut further, and the markets more or less subscribe to that view. On the week, EDZ9 settled +1 at 98.10, while EDH0 was +3.5 at 98.345. The curve flattened with 30’s down 8.2 bps to 2.211% and 2’s down 6.4 to 1.562%. Tens ended -7.3 at 1.728%. These declines occurred in spite of a much stronger employment report than expected, which also featured positive revisions to previous months. As a result, implied volatility was crushed. For example, EDH21 9850 straddle on the week went from 58.5 to 55.5 and 0EH from 37.0 to 33.0. 2EH 9850 straddle went from 37.0 to 33.5. The bulk of the declines occurred on Friday. In terms of pricing for forward rate cuts, Nov/Jan FF spread settled -5.5; less than 25% chance of another cut in December. The Jan20/Jan21 FF spread settled -31.5 and EDH0/EDH1 at -21.5, roughly forecasting one cut throughout all of next year. The market is setting up for a quiet glide into year end.
They used to call GM (General Motors) a “very large pension plan with a car company attached.” In a way, that is what the US is becoming, a very large social security and medicare plan with an economy attached. US federal spending is the main driver of growth through deficit spending and the Federal Reserve is funding the deficit through its repo operations and outright buying of treasuries. No one at all is talking about fiscal austerity. Indeed, it’s exactly the opposite. Why then shouldn’t stocks make all time highs? Certainly, earnings aren’t the catalyst. Charlie Bilello notes that “With 74% of companies having reported, S&P 500 GAAP earnings are down 2% over the past year, first decline since Q1 2016.” It was reported that Berkshire is now sitting on a record cash pile of $128 billion. If Buffet thought reasonable investment opportunities were available, I doubt the cash hoard would be that large.
A lot of people have been saying that a Warren presidency would cause an immediate plunge in the stock market. Perhaps that would be the initial reaction, but if the model remains ‘borrow and spend, and don’t worry about the borrowing part because the Fed has our back’, then perhaps values continue higher. What’s the limiting factor? With MMT, it’s an increase in inflation. Given an acquiescent Fed, the more immediate limitation might be the value of the dollar and that is currently flashing a low-pulse amber alert, with DXY having started October near 99.50 and ending Friday at the low of a three-month range at 97.12. Perhaps there will be a hiccup before the Fed realizes the need for more aggressive outright monetization. For example, this week brings auctions of 3, 10 and 30 year treasuries in total of $84 billion, raising over $23 billion in new cash. If foreign buyers hesitate due to concerns about the dollar, it will be left to domestic investors (the Fed) to fill the gap.
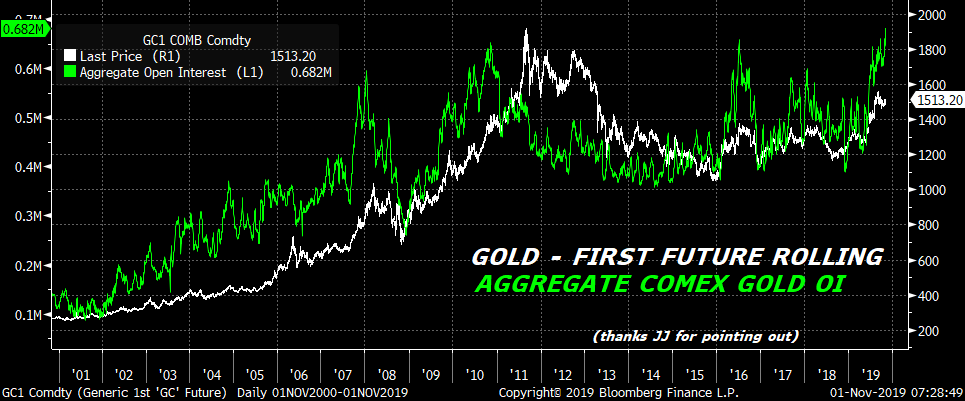
Maybe that’s why gold is seeing renewed interest. Friend JJ notes that open interest on Comex Gold has made a new all time high even as the price remains below the 2011 peak.
Besides the auctions, this week features Factory Orders on Monday and Service ISM on Tuesday. NY Fed’s Williams speaks Wednesday.
OTHER MARKET/TRADE THOUGHTS
The NY Fed’s GDP Nowcast pegs Q4 growth at 0.8%, a downgrade due to the weak ISM Mfg data. The Atlanta Fed GDP Now Q4 forecast dropped to 1.1% from 1.5%, though it’s still quite early in the cycle.
On Thursday as rate futures pushed toward the highs of the week, there was new buying of 35k TYZ 130/129 put spread for 19 (settled Thursday at 18 vs 130-095) and 25k USZ 160/158 p spd for 28 (settled 29 vs 161-12). With Friday’s pullback as a result of the employment data, TYZ 130/129 ps settled 22 vs 130-00.5 and USZ 160/158 ps settled 37 vs 160-20. More talk of progress on US/China Phase 1 should cause further pressure on bonds (with an additional auction concession) but I would suspect these trades could be exited this week.
| 10/25/2019 | 11/1/2019 | chg | |
| UST 2Y | 162.6 | 156.2 | -6.4 |
| UST 5Y | 162.7 | 155.6 | -7.1 |
| UST 10Y | 180.1 | 172.8 | -7.3 |
| UST 30Y | 229.3 | 221.1 | -8.2 |
| GERM 2Y | -65.2 | -65.7 | -0.5 |
| GERM 10Y | -36.2 | -38.2 | -2.0 |
| JPN 30Y | 39.5 | 33.8 | -5.7 |
| EURO$ Z9/Z0 | -34.5 | -39.5 | -5.0 |
| EURO$ Z0/Z1 | -4.0 | -5.0 | -1.0 |
| EUR | 110.81 | 111.67 | 0.86 |
| CRUDE (1st cont) | 56.66 | 56.20 | -0.46 |
| SPX | 3022.55 | 3066.91 | 44.36 |
| VIX | 12.65 | 12.30 | -0.35 |
In a good place
Nov 1, 2019
–The treasury curve shifted lower by 10 bps or more. Tens fell 10.7 to 1.687%. Greens were the star performers on the euro$ curve, closing +13.625. It’s almost as if the Fed (unexpectedly) eased! The high contracts on the ED curve are June and Sept’21 at 98.625 or just 1.375%. Coincidentally, April 2020 Fed Funds settled at almost the same level, at 98.635, which indicates one more rate cut between the upcoming Dec, Jan and March FOMC meetings. (FFX9/FFJ0 spread settled -22.25). Current levels of EDM21 and EDU21 are a little more than 30 bps away from the highs made at the start of September of 98.945. The 30-yr bond yield of 2.174% is 20 bps away from its all time low.
–Near the end of the open-outcry session someone stepped in (on the screen) to fade the rally, buying 35k TYZ 130/129 put spreads for 19 (settled 18 ref 130-095) and 25k USZ 160/158 put spreads for 28 (settled 29 ref 161-12). Delta equivalents 8750 TY and 4750 US.
–Today of course, brings the Employment report, with NFP expected 90k (skewed by the GM strike) and Avg Hourly Earnings yoy 3.0%. Mfg ISM is expected 49.0 after a weak 47.8 last. Chicago PMI, released yesterday, was only 43.2, completing a round turn from the end of 2015 (chart below). Core PCE prices 1.7%, holding below target. Dallas Fed’s Kaplan speaks this morning, with Clarida at 1:00 EST. He’ll likely parrot the ‘economy is in a good place’ mantra. The PMI data is not in a particularly good place, and the fact that stocks continue to make new highs is either due to the fact that manufacturing is now a much less important aspect of the economy, or that the flood of central bank liquidity is the main factor. A bit of both… Clearly, rates are a huge tailwind for stocks. Brazil cut the benchmark selic rate to a new historic low of 5% yesterday, this rate having been at 14.25% in 2016. In 2016, Ibovespa was 40k, now it’s 107720.
–Phase One is underway. No, not the US/China agreement, but the impeachment process, with the House moving forward to set public hearings.
That’s all folks!
Oct 31, 2019
–As of the 3:00pm settle, tens were down 3.9 bps to 1.794% and bonds down 5.6 bps to 2.272%. However, the rally continued after Powell’s press conference. The Fed cut another 25 bps and signaled a pause, pretty much in line with what eurodollar calendar spreads had been signaling. Nov FF settled 98.4125 or 1.5875%, just below the midpoint of the new 1.50-1.75% target. However, Nov/Jan FF spread settled -6.25, indicating just 1 in 4 chance of another ease in December. It appears as if the Fed’s hawkish lean caused steepeners to be exited, underpinning a rally in the long end. Implied vol was pasted with new lows across the treasury complex. Probably worth buying in front of tomorrow’s payrolls which are expected 90k.
–China Mfg PMI fell again, to 49.3 from 49.8, while Service PMI also declined to 52.8 from 53.6.
–In front of the Fed meeting there was relatively heavy buying of five-year calls through risk reversals. Last night there were a couple of blocks in the other direction in euro$’s. Buyer of 80k 0EF 9837p/9875c risk reversals, paying 2.5 and 3.0 for 40k each, buying puts. –Today’s news includes Q3 Employment Cost Index expected +0.7 and Personal Income/Spending +0.3/+0.2. Core yoy PCE prices expected 1.7% from 1.8%.
–All euro$ contracts between EDU20 (98.445s) and EDU23 (98.395s) settled between 98.495 and 98.395, an 11 bp band consistent with a FF target rate of 1.25 to 1.50%. One more cut, and then radio silence. That oughtta be a fun three years…

Fed day
Oct 30, 2019
–Slight decline in yields yesterday amidst light volume, tens fell 1.8 bps to 1.833%. There were a couple of notable upside trades in eurodollars, a buyer of 40k EDM0 9912/9925 call spread for 1.0, which would pretty much require cuts at every one of the next four FOMC meetings (after today’s) to fill out, and a buyer of 30k 0EF 9875/9900 call spread with 0EH 9900/9925 call spread for 6.25 as a package (settled 5.25). These midcurve call spreads expire next year with EDH21 as the underlying, which settled 9846.5. At the end of August, this contract traded as high as 9894.0. In spite of stocks trading near record highs, some are expecting impeachment proceedings to gain traction, and are worried about the ramifications of Warren’s ascent. Which brings us to today’s FOMC outcome, priced for a cut of 25 bps. As mentioned yesterday, the forward calendars suggest the Fed may be much less inclined to ease going forward. For example, EDH0/EDH1 settled -16.5, near the top end of the range. Buying calls on EDH21 is a modified sale of EDH0/H1; perhaps not a bad way to express the idea.
–Forward guidance will likely fall back on ‘data dependency’. A standing repo facility will likely be discussed but not yet implemented. The fact that the Fed is flooding the system with liquidity to hold down a rate that otherwise appears to want to go up suggests easing; further actual rate cuts can be de-emphasized. Today also brings ADP expected 120k and Q3 GDP expected 1.6 to 1.7.
Break on through…
Oct 29, 2019
–In spite of continued signs of a weakening economy, yields rose with tens up 5 bps to 1.851%. Chgo Fed National Activity Index was -0.45, near the lower end of the past year’s range, and Dallas Fed Mfg was -5.1 vs expected +1.0. Stocks broke through to new highs. (We chased our pleasures here/Dug our treasures there). No one left to sell with anemic volume. But here’s some news: THE FED’S GONNA CUT.
–There are several articles indicating the Fed will cut tomorrow, and if they don’t, markets will be shocked! Of course, short rate futures have priced high odds of a cut for quite some time. For example, Oct/Nov FF spread settled -22.25 bps yesterday. Markets have been have been leading the Fed. But here’s the interesting part, the forward spreads are pricing much less certainty of more easing. For example, Nov/Jan Fed Fund spread, which prices the December FOMC, settled at -7.75, about 1 in 3 chance for another hike. EDH0/EDM0 three-month spread also settled -7.5. Yesterday, all near one-year euro$ calendar spreads made new highs, with EDZ9/EDZ0 up 2.5 to -32.0 and EDH0/EDH1 up 2.0 to -16.5. (EDZ9/Z0 was as low as -57 in early Oct). So yes, the markets have guided the Fed to tomorrow’s cut, but the FORWARD guidance coming may also sync up between Powell and pricing. Clearly, the new high in stocks takes away any urgency for easier policy, and 2/10 spread ended at a new high above 20 bps.
–EDZ9 settled 9808.5 or 1.915%. Yesterday, 3-month libor was 1.9355, with Fed effective 1.83% and SOFR 1.85%. EDZ9 to FFF0 settled 38.0, holding the recent range of 36 to 41. If the basis stays constant, then EDZ9 is pretty well priced…also indicating fairly low odds of additional ease. It’s worth noting, especially with this contract, that the Dec FOMC is on the 11th, prior to expiration on the 16th (midcurves expire Friday the 13th). This of course, is NOT A RECOMMENDATION, but EDZ9 9812/9825cs settled 2.75 and the 9812/9825/9837 call fly settled 1.5. The call spread seems to have a slightly better payoff profile than FFX/FFF without the open ended risk.
–China ten year keeps edging higher in yield, now 3.32% as inflation rises due to pork prices, which have exploded due to swine fever. The yield has risen even as economic data remains soft. I am just a distant observer of China, but it would seem as if asset price inflation in the US might possibly exert the same directional push to yields…
More debt, higher yields, slower growth (and robots)
Oct 28, 2019
–Yields rose Friday on light volume with steady to falling implieds. Tens ended +3.7 bps at 1.801% and are up another 3 this morning as TYZ trades 129-09, approaching the low from mid-September. Worth a note as well, China’s ten year sovereign prints 3.30% this morning, the highest yield since June and up 1/4% since the low in mid-Sept.
–This week brings the FOMC announcement on Wednesday, widely expected to result in a cut of 25 bps to 1.50-1.75% range. FFX9 is currently priced right in the middle, settling Friday at 9838.5 or 1.615%. The focus will be on forward guidance and a possible long term repo solution. On Friday the employment report is released with NFP expected 90k. While both Atlanta Fed’s GDP Now and NY Fed’s Nowcast are in agreement on Q3 GDP at 1.8% and 1.9% respectively, the NY Fed is currently pegging Q4 at just 0.9%. There’s more talk recently of lower credit quality, which will certainly be put to the test in a flat growth environment. According to the St Louis Fed website, the BAML CCC spread is now at 10.6%, approaching the high spike made at the end of last year when stocks were tanking, this in spite of the fact that equities are currently near all time highs.
–On Friday the US released the budget deficit, coming in at an impressive $984 billion for the fiscal year, up 26% yoy for the third consecutive increase. When Trump proclaimed himself the ‘king of debt’ he wasn’t kidding.
–EDH20/EDH21 spread closed -18.5, up 2 bps on the day and right at its recent high. The lowest one-year calendar is still EDZ19/EDZ20, but the forward spreads become consistently more positive, indicating that forward expectations of easing are lessening. At the same time, the ten year note to tip spread has edged up to a new recent high of 1.655% having been sub-1.5% a month ago. Inflation expectations could be starting to creep up.
OXI
Oct 27, 2019 — Weekly Comment
Tomorrow, October 28th, is NO day, the Greek holiday commemorating prime minister Metaxas’ refusal to let the Axis occupy strategic locations in Greece.
From Wikipedia: This ultimatum, which was presented to Metaxas by the Italian ambassador to Greece, Emanuele Grazzi, shortly after 03:00 am on 28 October 1940, who had just come from a party in the Italian embassy in Athens, demanded Greece allow Axis forces to enter Greek territory and occupy certain unspecified “strategic locations” or otherwise face war. It was allegedly answered with a single laconic word: όχι (No!). However, his actual reply was, “Alors, c’est la guerre!” (so this is war!)
When are markets and Central Bankers going
to say “no” to levitated valuations?
Kevin Muir of TheMacroTourist blog and Market Huddle podcast has often
said that Trump is the MMT (Modern Monetary Theory) president. Figures released last week bear this out: The
fiscal deficit for 2019 was released at $984 billion, “the first time since the
early 1980s that the budget gap has widened over four consecutive years. (RTRS)
“Total receipts increased by 4% to $3.5T
but outlays rose by 8.2% to $4.4T.”
This, in a time of record low unemployment.
The government appears to be driving growth as opposed to
counter-cyclically providing stimulus as the economy slows. That will come
later (we hope, if the bond market is accommodating). As I understand it, the limit to MMT is determined
by increased inflation which hasn’t really been showing much in terms of
acceleration. The question becomes, when
does the massive increase in federal debt run into the wall of interest rate
resistance? Low rates have been
associated with decreased levels of inflation.
Higher rates could conceivably produce the opposite reaction. In any case, we’ve now seen a small example
of the market saying ‘no’ with the September repo scare.
There’s usually a bit of a build-up to “NO”. I am not the first to make this comparison but Bear Stearns in 2007 and WeWork today provide some interesting parallels. According to thebalance.com, in April 2007 bond dealers told the managers of two Bear Stearns funds they should write down the value of their assets. These two funds, High-Grade Structured Credit Strategies and High-Grade Enhanced Leverage, owned CDOs based on subprime. By June of 2007, the Wall Street Journal framed it this way: “Injection of $3.2 Billion caps days of drama… Bear Stearns’ dramatic decision to lend as much as $3.2 billion to one of its two troubled hedge funds staves off the risk of a fund collapse that could have damaged its position as a major Wall Street bond player – and had the potential to ripple though a jittery subprime-mortgage market.” All in the past tense. Crisis averted, staved it right off.
In March of 2008, it ended for Bear. Continuing from TheBalance article, “Like many other Wall St banks, Bear relied on short-term loans called repurchase agreements. It traded its securities to other banks for cash… Bear hemorrhaged cash when the other banks called in their repos and refused to lend more. No one wanted to get stuck with Bear’s junk securities.” It wasn’t until September of 2008 that Lehman filed for bankruptcy, but the Bear problems were percolating well over one year beforehand. Of course, it’s one thing to have repo backed by subprime, and another altogether to see hesitancy to lend in the repo market with US Treasury securities as the collateral.
In any case, by December of last year, the Saudis balked at investing more money into Softbank’s planned $16 billion injection into WeWork (then valued at $42 billion). Softbank CEO Masayoshi Son trimmed the investment to just $2 billion. It’s worth noting that the second pillar of KSA’s Mohammed bin Salman’s Vision 2030 is the “…determination to become a global investment powerhouse” to diversify revenues. The Saudis are major investors in Softbank’s Vision Fund, and the WeWork fiasco has certainly crimped Vision 2030. So what’s the official response when things go pear-shaped? It’s the Bear response. Fund it yourself. Softbank has now taken control of WeWork and is trying to right the ship amid a glut of non-leased space. Softbank is also trying to launch Vision Fund II, but due to lack of interest, is advising Softbank execs to back it by lending them up to $20 billion. (RTRS) As a client once told me, “The road to hell is paved with positive carry.” Meaning of course, that what appears to be positive carry presently can swiftly turn into cement shoes. Coincidentally, KSA once again had to pull its IPO for Aramco, having been advising wealthy Saudis to fund it. Worth noting as well is that famed stock-picker Jeff Vinik shuttered his fund because he was having trouble raising $3 billion. These aren’t exactly examples of ultimatums, but they clearly are examples of a lot of NO.
Much of today’s confidence in the US economic picture derives from the perceived values of assets. So what happened in 2007? As NorthmanTrader.com points out, “…don’t forget there is precedence for a July high followed by an October high. That marginal new high in October 2007 was a life time selling opportunity. The driver of that rally to new highs then? The Fed cutting rates in September all the while saying things were fine, no recession coming.” (NorthmanTrader/Zombieland). This was after the Bear mortgage fund implosion. In the same piece Northman notes that this past week in SPY “Volumes collapsed to the lowest volume week ever (outside a holiday week with a half day thrown in) with daily volumes barely making it to 30-35m shares. It’s stunning.” (Current avg daily volume is about 73m). One thing I learned as a youngster in this business is that if a move is not confirmed with high volume, it’s highly suspect.
This Wednesday we’ll have the FOMC decision to cut rates to 1.50 to 1.75%. November Fed Funds settled right near mid range, at 98.385 or 1.615%. While private investors say no, central banks say yes. And, just like Bear, when the private marketplace no longer wants to buy what you’re selling, then fund it yourself. It’s not QE. Call it by its real name, PANIC.
In spite of economic data that was on the soft side this week, yields still rose with tens gaining 5.4 bps to end at 1.801%, the high of the last few weeks. On Friday, we’ll have the Employment Report with NFP expected 90k and Average hourly Earnings +3.0% yoy. As Jill Manfreddi highlights from ChallengerGray, “…this year, employers have announced plans to cut 464,869 jobs from their payrolls, 26.9% higher than the 366,058 cuts announced in the same nine months last year. It is the highest January-September total since 2015, when 493.431 cust were announced.”
| 10/18/2019 | 10/25/2019 | chg | |
| UST 2Y | 155.8 | 162.6 | 6.8 |
| UST 5Y | 155.2 | 162.7 | 7.5 |
| UST 10Y | 174.7 | 180.1 | 5.4 |
| UST 30Y | 224.5 | 229.3 | 4.8 |
| GERM 2Y | -66.3 | -65.2 | 1.1 |
| GERM 10Y | -38.2 | -36.2 | 2.0 |
| JPN 30Y | 40.9 | 39.5 | -1.4 |
| EURO$ Z9/Z0 | -36.0 | -34.5 | 1.5 |
| EURO$ Z0/Z1 | -3.5 | -4.0 | -0.5 |
| EUR | 111.70 | 110.81 | -0.89 |
| CRUDE (1st cont) | 53.87 | 56.66 | 2.79 |
| SPX | 2986.20 | 3022.55 | 36.35 |
| VIX | 14.25 | 12.65 | -1.60 |
https://www.thebalance.com/bearn-stearns-collapse-and-bailout-3305613
Bonds have already priced Core Capex decline and are looking forward
Oct 25, 2019
–Quiet day Thursday with barely any change in fixed income. November treasury options expire today with TYZ comfortably sitting between 129.75 and 130. I would note that on the eurodollar curve, the peak contract is now the 2nd red, namely EDH21 at 9855.0. The peak had been the 8th contract recently; the move forward perhaps is a tiny signal of steepening further back. For example, 2/10 ended above 18, a new recent high. Implied vol continues to fall in rates with the news calendar light (Michigan Consumer Sentiment and Inflation expectations today). VIX sub-14 as earnings reports appear to have little impact, with indices pressing for new highs.
–A twitter post from David Rosenberg yesterday: “The legendary Paul McCulley once told me that his favorite leading macro indicator is the yoy percent change in the 3-mo moving avg of Core Capex Orders. It just crossed below the zero line.” The chart below is informative; the decline in durables in the last half of 2015 coincided with plunges in oil and emerging markets. Yields made their historic lows in the US in mid-2016, and revisited those lows earlier this year. The surge in activity in 2018 was due to tax cuts and repatriation, in hindsight perhaps a ‘sugar high’. However, yoy comparisons are likely to start becoming much easier.
–Next week brings the Fed rate cut and Employment report.

