Auto Draft
Oct 24, 2019
–Little change in interest rate futures yesterday. In euro$’s reds thru golds +1 to +1.5. Ten year yield fell 1.1 to 1.757%. However, there is still turmoil below the surface, as the Fed increased o/n repos to $120 billion from $75b and term to $45b from $35b. While the signal of increased liquidity was welcomed by the stock market, EDZ9 still closed -1.0 on the day. The spread between EDZ9 and FFF0 (a proxy for libor/ois) gained 1.5 to 39.5. This spread had peaked at 41.5 in the mid-September repo scare, but had quickly eased back down to 36. Additionally there were a couple of new trades buying Nov FF vs selling Nov one-month SOFR at a spread of 5.5 (settled 5.0, 9838 vs 9833). This spread had gotten up to 8.5 in Sept. In the grand scheme of things, these are micro moves, but adding $55 billion in repo doesn’t strike me as being micro. In a tweet yesterday Jim Bianco said “Repo issue in 2 words, ‘liquidity hoarding.'” While this doesn’t bode well for end-of-year funding, there was still a seller of EDZ9 9812.5 straddle at 14.5. I understand selling FVZ9 atm straddle at 0’56, but I do not understand selling EDZ at 14.5. The Fed reportedly had a closed door meeting with banks a couple of days ago; the banks would prefer regulatory relief, but the Fed doesn’t want to go that route. For now, the issue is still simmering.
–I, of course, still harbor concerns that many of the assets we think are solid, may not be worth nearly as much as we think. The obvious example is WeWork, but Beyond Meat has gone from a BigMac to a hamburger in three months, and Peleton has also shed some weight since the IPO (clever, eh?). All of the new AI tech firms seem to be under a cloud (UBER, LYFT, CRWD). On the other hand, Tesla just blew the doors off with its earnings report yesterday. Well sure. They have to keep replacing the cars that spontaneously combust.
–Speaking of spontaneous combustion, Chicago’s Mayor Lightfoot released her budget plan to close the deficit with help from Springfield, the state capitol. (This while Chicago public schools are still closed due to a teacher’s strike). At the same time, a report on the financial health of Illinois projects the gen’l fund deficit to hit $3.2 billion with a backlog of unpaid bills of $19 billion. And I believe they just floated some bonds to take care of unpaid bills. I don’t think Springfield is the answer to your prayers Mayor.
–VP Pence scheduled to pour some gasoline on the Hong Kong situation today, but I can’t find anything indicating a time for his speech. Economic news includes Markit PMIs, with the Composite expected 51.6 from 51.0 last, and Durables expected -0.8 from +0.2.
–This whole environment sort of reminds me of a floor story…wait, do I have time for this? Yeah, what the hell. In the eurodollar pit the area devoted to back months covered everything from reds back. Some spectacular spread traders in that pit, which was jam-packed with filling brokers, market makers and of course a few pit reporters. A lot to keep track of. The pit reporters wore dark blue trading coats and would indicate where markets were on occasion when it was busy. There was a new broker, a guy who had been a clerk but his employer had the bright idea to badge this guy up to fill some of the overflow orders. Can’t recall his name, but anyway, one busy day a pit reporter yells “red dec 2 trade and it’s 2 bid” holding up his hand with two fingers to indicate it. And this clown says “Sell you 50”. The pit reporter says, “what the hell are you talking about?” And our hapless broker indignantly says, “I sold you fifty at 2. Card it up.” The pit reporter says, “You can’t trade with me, I’m a pit reporter and have been for years.” Not willing to immediately realize what a jackass he was, the broker calls attention to himself by yelling out, “Who is this guy in the blue coat? He’s trying to back out of a trade!” Thereby sealing his fate as the object of relentless ridicule. Ah, those were the days! Moral of the story, there was no trade. He THOUGHT there was a trade, but there wasn’t one. (I’ll ask Royals for his name, I’m sure he will remember).
https://www.reuters.com/article/us-illinois-budget/forecast-points-to-deepening-illinois-budget-deficit-idUSKBN1X22RG
Tighter tech belt
Oct 23, 2019
–Ten year futures have spent the last seven sessions between 129-16 and 130-16 and are in the middle this morning, just above 130. Nov options expire Friday with atm 129.75 straddle having settled 34/64’s yesterday vs 129-26. Cash tens ended 1.768%, down 2.4 bps. Solid 2-year auction, with 5’s on tap today. Euro$ strip from reds through golds +1.5 to 2.0. Brexit issues continue to be a factor, but GBP has only pulled back slightly from last week’s rally.
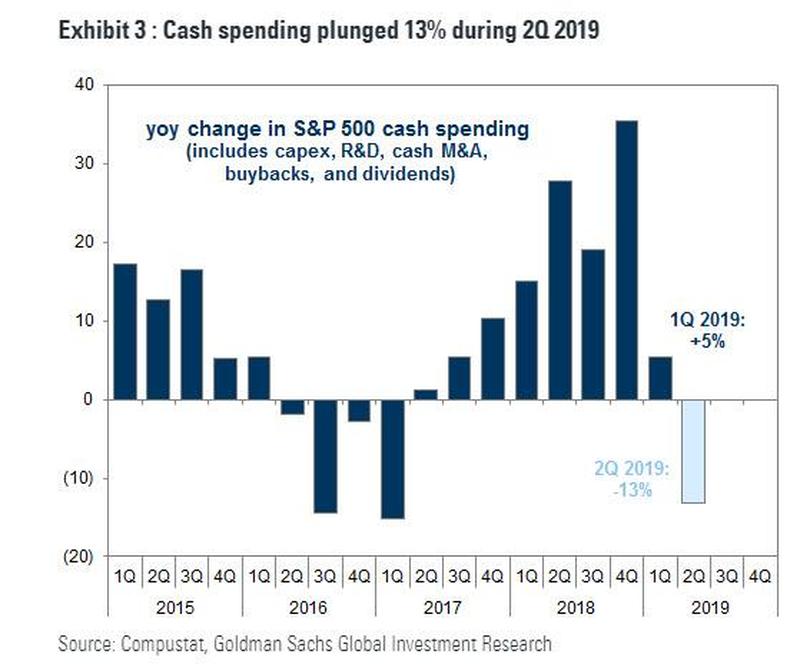
–Nasdaq futures posted a higher high, lower low and lower close due to an afternoon slide. In NQZ, 8000 is providing resistance, with yesterday’s high 7988.75. The larger picture is that companies have been hesitant to spend on capex. Interesting article on ZH yesterday says that Q2 yoy cash spending by SP500 companies fell 13%. This includes capex, R&D, cash M&A, buybacks and dividends. Chart and link below. Fed cuts probably have little influence on these decisions.
–New buyer yesterday of 30k 0EX 9862.5/9875c spd for 2.5 cov’d against futures 9849 to 9848. Settled 2.25 vs 9848. Reasonable protection trade for upside with 23 days to go.
https://www.zerohedge.com/markets/one-banks-stunning-chart-showing-second-tech-bubble-all-its-glory
Dance Through It
Oct 22, 2019
–Once again near euro$ calendar spreads ticked to new highs as yields rose. EDZ9/EDZ0, the most negative one-yr calendar, settled -34.5, right at the recent high, while EDH0/EDH1 made a new high at -18.5 and EDM0/M1 made a new high at -10.5. The red/green (2nd to 3rd year) pack spread rose over 1 bp to +3.0. The price action can be attributed to the idea that the Fed’s expected ease next week is supporting near contracts relative to the backs, or it can be attributed to supply considerations as the Treasury auctions 2’s today followed by 5’s and 7’s Wed and Thursday. Or both. It’s worth a mention that there was a buyer of 10k EDZ21/EDZ22 yesterday at +5.5 (settled there). Though I don’t have prices posted here, near calendars are negative (indicating a bias toward further ease) and back calendars are positive, which signal a return to ‘normalcy’. Eventually. EDH0/H1 is -18.5, EDH1/H2 is +3 (the pivot) and EDH2/H3 is +7.
–Tens rose 4.5 bps to yield 1.792%. 2/10 pushed to a new high of 18. The Oct/Nov FF calendar settled -21.0 – high confidence of a 25 bp cut at next week’s meeting, but after that the picture gets cloudy. What we’re NOT really seeing is demand for puts as rates push higher. For example, last Thursday there was a buyer of 50k TYZ 129p for 12, and on that day they settled 13 vs 129-29. Yesterday, this 20 delta put settled 15 vs 129-20. So the puts are up only 2/64s (or 1/32) on a drop of 9/32’s in futures. From all the warnings of BOND BUBBLE that I’ve heard recently, you’d think puts would be in high demand. For now, the market is dismissive of downside risks. Of course, that can change in a hurry.
–From Ambrose Evans-Pritchard’s latest, “The use of debt for share buybacks or dividends is called ‘using your balance sheet efficiently’ on the Street. I remember the term well from the mass delusion phase of 2008. Just wait until the funding markets jam shut.” Another warning… but the timing is what’s critical. Any idiot can look around at the world today and harbor suspicions of mass delusion. So take the advice of Chicago band Twin Peaks (or Charles Price in days of old)…Dance Through It. (Gotta problem she’s tryin’ to hide).
Don’t Worry About It. It’s technical.
Oct 21, 2019
–Curve steepened Friday with a solid bid in near contracts. EDH0/EDH1 settled at a new recent high of -19, up 1.5 on the day. The red pack closed +2.125 while golds were unch’d. In treasuries, 2/10 closed 17.3, up 1.7 bps. Some of this bid undoubtedly related to Brexit issues which are continuing. This morning US fixed income has pulled back slightly. With next week’s FOMC substantially priced for another 25 bp cut, EDZ9 is comfortably hanging out around the 9812.5 strike (9813.0s). Oct/Nov FF spread settled at -19.75 (~80% chance of ease) while Nov/Jan settled -10.0. However, there is still a lot of time between now and year end… EDZ9 9812.5 straddle settled 16.0 which seems reasonable, but longs will likely have several opportunities to scalp around. EDZ straddle would be a tough short to hold unprotected. Having been 1.85% two weeks ago, last week SOFR was 2.00% on the 15th and 2.05% on the 16th. Settlement dates for treasury auctions can still introduce volatility, as can other factors. This week sees auctions of 2’s, 5’s and 7’s.
–Interesting article on ZeroHedge which cites JPM, saying that the Fed will likely soon have to expand the just announced bill buying program to include longer dated treasuries, The article indicates that Bank of Japan’s balance sheet decline must be plugged by other foreign central bank buying. The technical issues of central bank “plumbing” seem to be coming to the forefront on a more regular basis, and not in a routine way. Thursday’s last ECB meeting with Draghi at the helm highlights the monetary divisions confronting Europe. Cohesion and consensus at ALL central banks has fractured. Oh, perhaps not in China, but evidence is growing that liquidity measures there are less effective at the margin. The pendulum has now swung from austerity to more vocal calls for fiscal action. Adding to a sense of uncertainty are the amount of protests percolating globally.
https://www.zerohedge.com/markets/here-real-reason-fed-restarted-qe

‘Triggered’ by eurodollar calendar spreads
Oct 20. 2019 – Weekly Comment
EDH20/EDH21 settled at a new recent high on Friday of -19.0 bps. March 2020 ED contract settled 9836.0 and March 2021 settled 9855.0. As the chart below shows, this spread reached a low of -40 in the beginning of September and has now exceeded its previous high made in summer. In my last note, I said that the week ended Oct 4, (when twos ended at 1.38%, tens at 1.50% and thirties at 2.00%), felt like capitulation. Treasury shorts threw in the towel. Tens finished this week at 1.75%. ED2/ED6 (the 2nd to 6th quarterly, now represented by EDH0/H1) is back to the level seen in the early part of Q2. If tens were back at that level they’d be 50 to 75 bps higher.
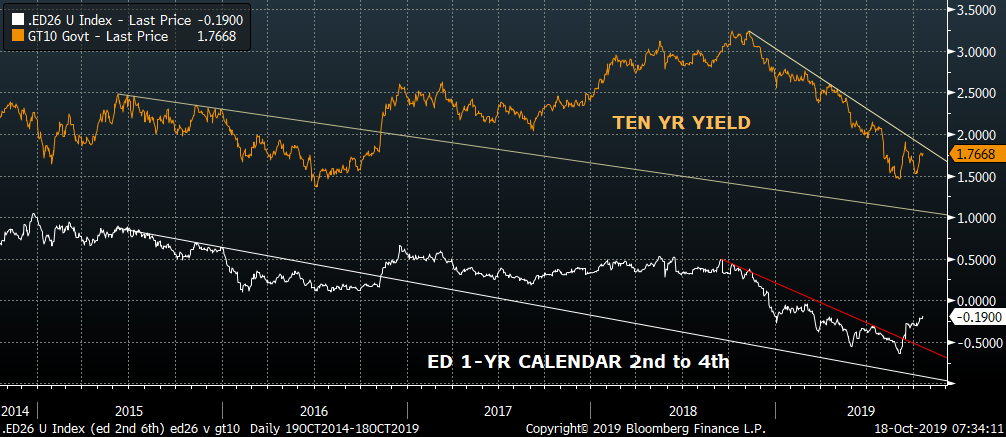
Ten year yield, amber / One-year euro$ calendar 2nd to 6th quaterly, white
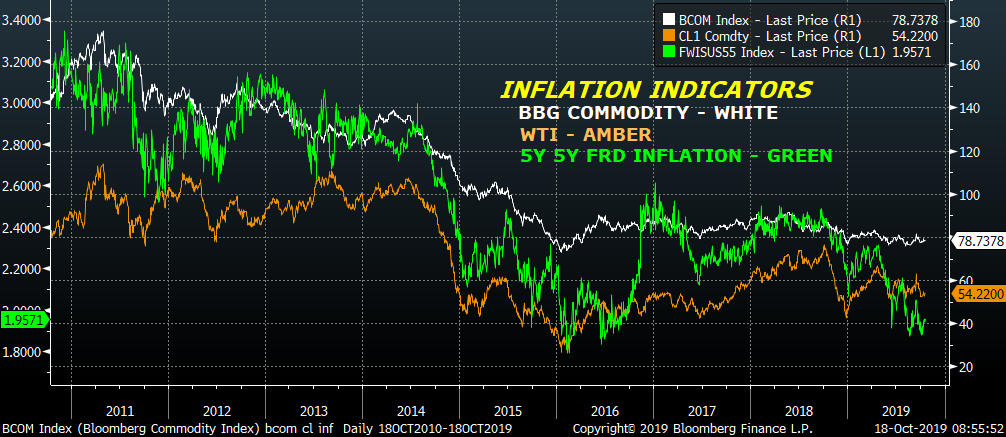
Below I include a chart with the BBG Commodity Index, Oil and the 5-year 5-year forward inflation swap, all of which are roughly related to inflation. Prices appear to be mired in quicksand. We know all the reasons that inflation can’t seem to accelerate: demographics, slow growth and technological innovation. I was completely struck by an article I had cited several years ago that starkly noted how new technologies had supplanted demand for a lot of other STUFF. The i-phone replaced bulky alarm clocks, stereo systems, cameras and film, shelves of vinyl records and books. A rotary Ma Bell phone weighed a good 3-4 pounds of metal and plastic. When you slammed that thing down it MEANT something. Now it’s all in the palm of one’s hand. Therefore…no inflation. Robotics….no inflation. Cheap manufacturing from overseas… no inflation. Strong USD… no inflation.
Another aspect of new technology that has held down prices is the trend of companies that sacrifice price for market share and growth. Scott Galloway has a great blog on this, linked below. We’ve all seen it with our own eyes. UBER undercutting taxis. Amazon. From Galloway, referencing AMZN: “Inspired by the Seattle giant, and presented with a market that offered billions to ‘disruptors’, firms saw a shortcut: paint a compelling vision and offer $10 worth of services for $5 – negative margins. There are few products that scale like a dollar offered for $0.50.” Here again, the implication is… no inflation.
https://www.profgalloway.com/marginal
Galloway then mentions Netflix: “In the [most recent] earnings call, the company replaced the term ‘growth’ with ‘profitability’ as their go-to word for the call.”
His conclusion: “I believe we are seeing the mother of all shifts from a focus on growth to margin. …Uber and WeWork reflect the high watermark of an infatuation with growth at the expense of margin.”
OK. So what does that have to do with March/March ED spread? If it’s right, EVERYTHING. Because all the things we know about inflation being low and anchored are just that, known. Returning to a focus on margins means PRICE INCREASES.
Here’s an interesting tweet, I think taken from the Atlantic Magazine. “If you wake up on a Casper, work out with Peloton, Uber to WeWork, order DoorDash, Lyft home, get dinner with Postmates, you’ve interacted with seven companies that will collectively lose around $14 billion in 2019. Use Lime, Wag and Blue Apron, that’s three more that have never recorded a dime in earnings.” These guys are SUBSIDIZING consumer prices to buy growth (thanks Softbank!). Or shall we say WERE. A shift will be critical.
It’s well known that low rates have enabled companies now known as ‘zombies’ to service debt and continue operations with ‘margins’ that wouldn’t otherwise make economic sense. Then skim through a Hoisington Quarterly review by Lacy Hunt and you will wonder why US rates aren’t already at zero.
All of this we know, right? But what is the market starting to say? I look at a breakout of March/March, and I say, hmmm, if the market is no longer stubbornly positive that forward rates are not going further down by a lot (and that’s what the reds on the euro$ curve are starting to say) then maybe funding of a ten year position, when it has rolled to eight and a half years left, isn’t going to be all that easy. Maybe that’s one red flag related to September’s repo surge. Maybe the deferred end of any longer term asset needs to have a higher implied yield (and that includes stocks). Perhaps a return to what we used to call ‘term premium’ is in the cards. If that’s the case, then tens will break that downward sloping trendline, which would be similar to what happened in the latter part of 2016 when the one-year ED calendar spread seemed to lead the rate rally. But let’s not just look at the US. The German bund is at the highest yield since late July at -38. The German Schatz has exploded to -66.3 bps, having been as low as -92 in early Sept. The ten year JGB closed through a downward sloping trendline and finished the week at a new recent high of -14 bps. We are starting to see higher lows and higher highs in terms of yields. Look at a constant maturity Ultra-ten year treasury chart (4 year history below). Huge rally from Q4 2018 until the summer. Since then, a potential double top.
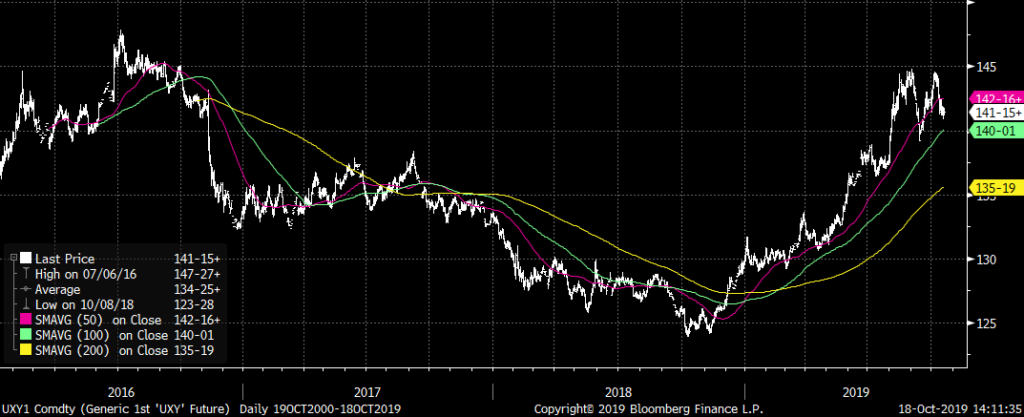
Everyone on the trading floor used to mutter, “We’ll find out what’s causing this move later.” We all know what we know. The market seems to be telling us something different. The good floor traders never let their bias for fundamentals get in the way of market signals. And, it’s not just the market. Globally central bankers and other policy makers are voicing a nagging concern that negative rates and QE might be having unintended side effects.
There is a lot of room for higher yields. The question is, can higher inflation ever occur in the context of slowing global growth? Yes, if a shift towards higher margins and profitability takes hold. When zombies die, pricing power comes back into play. Let’s take the biggest disruptor of all, China. If there’s one thing the trade war has done, it has ended the model of China solely relying on manufacturing cheap products to export to the US. No more vendor financing. From Credit Bubble Bulletin, “Chinese GDP expanded at a 6.0% yoy pace during Q3, the lowest level since 1992. According to Bloomberg, ‘Consumption’s contribution increased to 60.5% from 55.3%. Investment’s contribution slowed to 19.8% from 25.9%.’” Changes in the composition of GDP represent a change in the old model.
One more tweet related to the possibility of higher rates, this in the form of treasury supply: “UST Issuance on tap; Next week we will have $113B in coupon issuance, plus $20B in FRNs on top of an estimated $182B in treasury bills. Total projected debt issuance for the week of $315 Billion.”
According to TBAC (Treasury Borrowing Advisory Committee), this weeks’s coupon issuance of 2 yr notes and FRNs, 5’s and 7’s, raises over $33 billion in new debt.
OTHER MARKET/TRADE THOUGHTS
The Brexit situation still seems to be in flux; it’s not clear what the outcome of this weekend will be aside from a pullback in the pound.
On Thursday. Vice President Pence is slated to give a China policy speech, which may dampen enthusiasm for progress on trade and thus weigh on stocks. The choice between markets and moral high ground is becoming more apparent across the business landscape, and not just with respect to China. Several large tech companies report this week (MSFT, INTC, TXN) which might also impact equity futures.
On Friday, Oct/Nov FF spread settled -19.75, signaling high odds of a 25 bp cut on Oct 30, while Nov/Jan settled at -10. The latter spread prices for an ease in December, now at less than 50/50. Oct FOMC just one and half weeks away, and thankfully, we’re in the Fed speaker blackout period.
The longer term outlook is for higher rates, especially further out the curve. As mentioned last week, I like outright puts and put spreads.
EDU20 and EDU22 both settled exactly at 9850. The front straddle settled 48.0 and the green midcurve at 55.0. Not sure which one I’d rather own, but I am not too inclined to be short, even in a week where domestic economic news is fairly light.
Once again, the theme of this note is longer term in nature, and not conducive to a bunch of short term trades. Parameters are wider. Size trades accordingly.
| 10/11/2019 | 10/18/2019 | chg | |
| UST 2Y | 161.6 | 157.4 | -4.2 |
| UST 5Y | 158.2 | 155.8 | -2.4 |
| UST 10Y | 175.5 | 174.7 | -0.8 |
| UST 30Y | 221.6 | 224.5 | 2.9 |
| GERM 2Y | -72.0 | -66.3 | 5.7 |
| GERM 10Y | -44.2 | -38.2 | 6.0 |
| JPN 30Y | 38.3 | 40.9 | 2.6 |
| EURO$ Z9/Z0 | -35.0 | -36.0 | -1.0 |
| EURO$ Z0/Z1 | -7.0 | -3.5 | 3.5 |
| EUR | 110.38 | 111.70 | 1.32 |
| CRUDE (1st cont) | 54.78 | 53.87 | -0.91 |
| SPX | 2970.27 | 2986.20 | 15.93 |
| VIX | 15.58 | 14.25 | -1.33 |
https://www.profgalloway.com/marginal
Euro$ calendars portend a larger rate shift
Oct 18, 2019
–Rates edged slightly higher yesterday in spite of weaker than expected data with Housing Starts -9.4%, Ind Prod -0.1 and Philly Fed just 5.6. There was notable put buying in treasuries prior to the day session, with a new purchase of 55k TYZ 128p for 12. (settled 13 ref 129-29). During the day there was a buyer of 15k TYX 129.5/129 p 1×2 for 1 which appears to be a roll-up in strike as open interest fell in 129’s.
–In eurodollars, EDH0/EDH1 one-year calendar posted a new high of -20.5 and was -20 bid just after the settlement. Near one-year calendars have had a significant rally since early September, when this particular spread EDH0/H1 bottomed near -40. The takeaway is that forward expectations of actual rate cuts have declined, especially in the wake of QE lite. The March/March spread has made a complete round-turn from -20 in late July, to -40 in early Sept, to -20 now. However, treasuries are no where near the lows made in late July. For example, TYZ had traded 127-20 at that time and is now near 130. Does action in forward ED spreads portend an adjustment to higher rates in treasuries? Could be a good reason for some of the large put buys…
–China GDP was 6.0% vs 6.1 expected, a new modern low. Bloomberg reports that “The total number of Chinese onshore company bond defaults this year just equaled the record set for the whole of 2018.” And, as mentioned yesterday, the IMF says that global corporate debt could lead to the next crisis: “The $19 T in ‘corporate debt at risk’ amounts to almost 40% of total corporate debt in the eight economies studied.” We’ve been close to the BBB cliff in the US, but it never seems to spill over, in spite of WeWork, etc. Here’s a great tweet from Charlie Bilello indicating crazy valuation. “Beyond Meat’s market cap just passed Conagra. Conagra: Founded in 1919 (Duncan Hines, Slim Jim, Orville Redenbacher, Healthy Choice, etc…) 18,000 employees, $9.5 BILLION in Revenue. Beyond: Founded in 2009. Fake Meat, 383 employees, $95 MILLION Revenue.” Some guys in office tried a Burger King Impossible burger yesterday… no rave reviews.
Sharknado
Oct 17, 2019
–This morning EDZ9 is the weakest contract on the board, trading -3 at 9808.5 (red pack -1.75 as of this writing). It appears as if tightness in funding markets is expected to persist thru year-end. Interestingly, yesterday’s settlements in near Fed Fund contracts show increasing certainty of an ease at the October 30 FOMC. Oct/Nov FF spread settled -21.0 with FFV -0.25 at 9816.5 and FFX9 +3.5 to 9837.5. However, the Nov/Jan spread settled at just -10, so odds of an ease at the Dec meeting are falling. A couple of weeks ago, the Nov/Jan spread was much more negative than Oct/Nov; this relationship has flipped. Ease NOW rather than later. With the advent of QE lite, the market is less inclined to project forward easing (after October). Of course, comments like Lael Brainard’s yesterday also figure into the equation: She views “…the cost-benefit assessment of negative rates as unattractive” for the US. EDH0/EDH1 and the one-year calendars immediately behind edged to new recent highs, with March/march +0.5 to -21.0.
–Retail Sales weaker than expected at -0.3%. Today’s news includes Housing Starts expected -3.2%, Philly Fed 7.6 vs 12.0 (range so far in 2019 -4.1 to +21.8) and Industrial Production -0.2%.
–I read yesterday that the CEO of CSX said “It’s difficult, still very, very difficult to gauge where the overall economy is going”, as CSX rail volumes fell 5.3% yoy in the quarter. Of course, he said much the same thing in July. The Ass’n of American Railways website shows that current rail traffic at this point of the year is the weakest it has been in the last 4 years.https://www.aar.org/data-center/rail-traffic-data/
–Yesterday’s Beige Book was a slight downgrade. Labor market tightness cited as an impediment to hiring. “A number of Districts reported that manufacturers reduced their headcounts because orders were soft. However, some firms were more concerned about the longer-term availability of workers and subsequently chose to reduce hours rather than staff levels.” Is this a precursor to an actual reduction in staff? The report also corroborated weak shipping data: “…some reports suggested that shipping rates remained lower than they were earlier this year because of excess capacity in the industry”. Though the report was prepared by the Cleveland Fed, for some reason there was a “Sharknado” focus on Cape Cod suffering from weak tourism: “Media attention was “overly” focused on increased shark sightings and (rare) tornados.”. You’re really gonna put that in the report Wilson? Sure, I’ll bet you $5 that they don’t edit it out…
https://www.federalreserve.gov/monetarypolicy/beigebook201910.htm

Growth questionable, but rate markets trade like a bear
Oct 16, 2019
–Rates pressed higher Tuesday and the curve steepened as stocks soared. A Brexit deal appears closer, supporting GBP and stocks, and of course, optimism surrounding a resolution to the US/China trade war is also a factor, though China is threatening to retaliate if the US passes a Hong Kong bill. The ten year yield is at a resistance level of 1.77%, but shows scant evidence of pulling back. Near euro$ calendars made new highs. EDZ9/EDZ0 is still the lowest one-year, at -34.5, +2 on the day, while EDH0/EDH1 settled -21.5, +1. 2/10 edged to a new recent high of 14.9 bps.
–There was a new seller of 20k TYZ 128.5/132.5 strangles early at 28 to 27, (settled 31, 23 and 8 ref 129-24+) but implied vol remained firm in tens. In short, rates are trading a lot like a bear market, notwithstanding this morning’s bounce.
–As expected Bank of Korea cut rates by 25 bps to match the 1.25% low seen through late 2016 and 2017. This move underscores weakness throughout Asia. In the US, the Cass Freight report summarizes activity as follows:
• With the -3.4% drop in September, following the -3.0% drop in August, -5.9% drop in July, -5.3% drop in June, and the -6.0% drop in May, we repeat our message from the previous four months: the shipments index has gone from “warning of a potential slowdown” to “signaling an economic contraction.”
North American Freight volumes negative year-over-year for the tenth straight month.
https://www.cassinfo.com
Treasury jitters
Oct 13, 2019 – Weekly Comment
Last Sunday, referring to the week ended 4-October, I wrote, “The two-year yield dropped over 23 bps… In my book, that’s an ease!” What a difference a week makes. Because this week, the market recaptured that ease, and then some. Usually in the table at bottom, I just note one week changes. But below, I show the past three Fridays (I mark treasury yields as of futures market settlements). The two year went from 1.622% on 27-Sept to 1.388% and back to 1.616%. A round turn. Tens from 1.675 to 1.507 to 1.755. That is a monumental move which suggests the first week of October was pure capitulation.
The two dominant events were the Fed announcing a $60 billion per month t-bill buying program and PHASE I of the China trade deal. The Fed wants everyone to think of this latest move as normal, everyday tweaking of the monetary levers to ensure smooth market functioning. We’ll get to that below.
The China deal is quite interesting in terms of strategy. The election is just over one year away. Every time the stock market goes up it’s due to “optimism on a trade deal” and every time it goes down it’s due to some sort of an impasse on a trade deal. It makes a tremendous amount of sense to dribble out the easy phases of agreement to string along equity participants and manage expectations. China was able to delay implementation of tariffs, and can likely wrangle more advantageous clauses as time goes on. In fact, though there was a reasonable amount of day to day movement, SPX for the past three Fridays was fairly constant: 2962, 2952, 2970. So, the giddy enthusiasm on Friday is somewhat tempered when looking at a slightly longer time frame.
On the yield side, the implications aren’t clear, but the market is giving strong clues. October Fed Funds on Friday closed +1.0 bp at 98.1775 or 1.8225%. Pretty much right on SOFR and the Fed Effective rate. In the very front part of the curve, the market has a high degree of confidence that the Fed will do whatever it takes to control repo. However, April 2020 Fed Funds dropped 10 bps on Friday from 98.655 to 98.555 or 1.445%. The 6-month spread between Oct FF and Apr FF is thus -37.75 with four FOMC meetings within the period, i.e. 1.5 expected cuts. It’s worth noting that January 2020 Fed Funds (which capture only 2 FOMCs) settled as high as 98.565 seven trading sessions ago. So 1.5 eases HAD BEEN priced for two meetings and has now been stretched to four meetings.
On the euro$ curve, it’s a similar story. The very front end of the curve is underpinned by the Fed’s efforts to supply liquidity. Back contracts took a tumble. As an example, EDZ9 fell 7 bps on the week, to 98.10. However, EDZ0 fell 29.5 to 98.45! Near calendars obviously made new highs, with EDZ9/Z0 up 22.5 to -35.0 and EDH0/EDH1 up 7.5 to -22.0. The absolute measure on EDH0/EDH1 suggests only one ease over that year. And of course, one-year calendar spreads from there forward are steady to positive. EDH1/EDH2 is essentially flat at -0.5 and EDH2/EDH3 is +6.0. The peak contract on the euro$ curve remains the eighth quarterly, now EDU21, at 98.545. The highest settle of the 8th contract was on Sept 4 at 98.945, which would be consistent with a FF target of 0.75 to 1.0%, rather than the current level which would suggest a target of 1.25%.
What about the immediate prospect of an Oct 30 cut? Although market dynamics have changed, I think the Fed will continue to err on the side of extra liquidity and ease by another 25 bps. This move had been substantially priced early in the week with Oct/Nov FF calendar around -19 bps. However, the spread closed Friday at -15.75, still suggesting an ease, but with less certainty. I think the Fed got a good scare out of the repo surge and can couch another ease in the context of low inflation expectations and somewhat soft data. As an example, the NY Fed’s UIG (Underlying Inflation Gauge) was released last week at 2.4%, having steadily declined from 3.1% in late 2018. The ten year treasury to inflation-indexed note spread has been anchored just above 150 bps.
The longer end of the curve may provide the true “tell” for action going forward. Often, treasuries rally when coming out of the third leg of the auctions. Not this time. While I think there is likely to be a brief bond market rally in the early part of the upcoming week, sentiment appears to have turned decidedly bearish. The globe has been easing monetary policy. The Fed is committed to liquidity. The administration will probably do whatever it takes to juice the economy going into the election. Implied vol firmed on the move down. I don’t perceive the bond market as being in a bubble, but it does seem as if long yields have a lot more room to the upside than downside. As recently as April the 30-year yield was near 3% and just under one year ago in November it was near 3.50%. (Friday close 2.216%) Also worth noting is that the ten-year German bund yield ended at -44 bps on Friday, a rise of 14 on the week and the highest since early August; a downward sloping trendline since April was violated.
Perhaps there aren’t a lot of people in
today’s market that recall this, but I remember a time when Greenspan fretted
that there might not be enough government debt to appropriately conduct
monetary policy. I looked up a Greenspan
speech from April 27, 2001 entitled ‘The Paydown of Federal Debt’. Below are a couple of excerpts (linked at
bottom):
Today I want to address a subject in which your group and the
Federal Reserve share a keen interest–the paydown of the federal debt and its
implications for the economy and financial markets. While the magnitudes of
future federal unified budget surpluses are uncertain, they are highly likely
to remain sizable for some time.
…current forecasts suggest that under a reasonably wide variety of possible tax and spending policies, the resulting surpluses will allow the Treasury debt held by the public to be paid off. [Wow, what a difference a couple of decades makes. 30-year auctions were actually suspended for a while]
The effectiveness of our markets in allocating capital is one of our nation’s most valuable assets. We need to be careful not to impair their functioning.
Given concerns about the potential distorting effects of asset accumulation by the Treasury or in government defined-benefit plans, we need to carefully consider the appropriate path of debt paydowns.
A final valuable feature of the Treasury market is that it is a remarkably efficient system for funding federal government deficits. Because demographic and other factors are surely likely to lead to the re-emergence of deficits in the future, one might argue that it would be best to continue to borrow at least limited amounts from time to time in order to keep the market operating, so that it will be available when it is needed again.
Currently, Treasury securities are the “permanent” assets that correspond to the currency that is the Federal Reserve’s main liability. Treasury securities have several features that make them particularly attractive assets for the Federal Reserve. First, the liquidity of the market allows the Federal Reserve to make substantial changes in reserves in a short period of time, if necessary. Second, the size of the market has meant that the effects of the Federal Reserve’s purchases on the prices of Treasury securities have been minimal. Third, Treasury securities are free of credit risk. Thus, the Federal Reserve does not itself take on such risk when it holds them. … we believe that the effects of Federal Reserve operations on the allocation of private capital are likely to be minimized when Federal Reserve intermediation involves primarily the substitution in the public’s portfolio of one type of instrument that is free of credit risk–currency–for another–Treasury securities. As I discussed earlier, it is important that government holdings of assets not distort the private allocation of capital, and this goal applies to the Federal Reserve System as well as to the Treasury.
Even before that time, the Treasury market may become less liquid, making it more difficult for the Fed to make purchases without affecting market prices. Moreover, declining Treasury debt presumably would, at some point, reduce the liquidity of the Treasury repurchase agreement (RP) market, complicating the use of such operations in adjusting the short-term supply of reserves.
A few key takeaways from this speech. First, Greenspan was quite cognizant of the risks that the Fed might distort the proper functioning of capital markets. That horse has left the barn. Of course, it’s not just the US horse, there’s a nagging recognition that negative rates and central banks’ accumulation of various assets have distorted markets globally. Second, the repo market is essential to the proper conduct of monetary policy. A repo rate surge like the one we just experienced has the potential to sap confidence, which is why the Fed has taken strong and immediate measures to address it. The t-bill about-face is not just a tweak. The Fed was, as we used to say as kids, a-scared [that’s really REALLY frightened] that they let the market get away from them, exposing the fragility of funding the massive architecture of world-wide debt that has been created.
To conclude, regimes that we take for granted as stable can change pretty quickly. As the Fed supplies liquidity to the front end, long end rates may not respond favorably. In fact, the hawks on the Fed may initially take solace that a rise in long end yields are doing the ‘heavy lifting’. Banks, which are expected to show a yoy earnings decline this week, will welcome a return to a positive yield curve. (C, WFC, JPM, GS report on Tuesday, BAC on Wednesday). But there’s a chance that the Fed, in correcting one aspect of the market that got away, might see dislocations accelerate in another part.
OTHER MARKET/TRADE THOUGHTS
Last week I wrote: “In spite of the end of week stock surge, treasuries closed near the highs. Surprisingly, implied vol in rate futures is not confirming the move, and is slipping on new upticks, especially in bonds. This may portend a change, where vol now has a chance to firm on downticks, which would catch many positions offsides.” Last week’s yield reversal absolutely caught some participants flat-footed.
Rather than consider trades for the week, I am a bit more inclined to take a longer time-frame view. I think yields could easily decline in the beginning of this upcoming week. In tens, I think there’s major yield resistance up to around 1.80%, vs Friday’s 1.755%. I think an instant violation of that area is unlikely, but over the next few weeks we could easily surpass those yields. The market has been conditioned to sell puts on all rate futures as yields increase. I am more inclined to buy puts if yields fall, and to do that further out the curve.
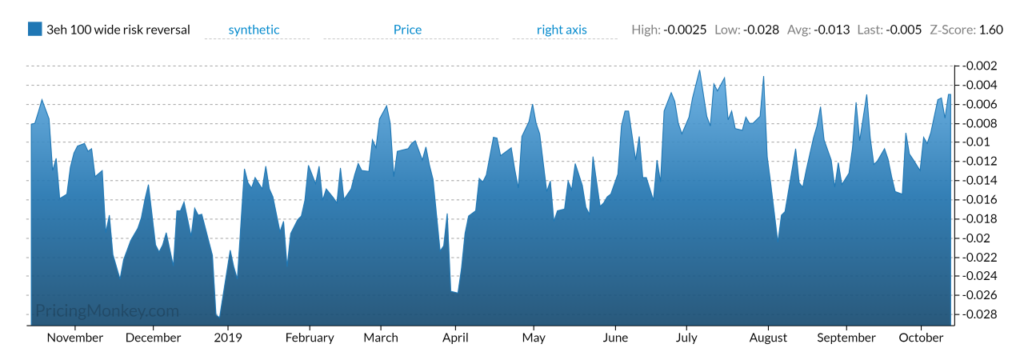
One chart I looked at last week was a synthetic 100 bp wide risk reversal on 3EH (the second quarterly blue midcurve). Here’s an image (in terms of bps). This is synthetic in that time until expiration is more or less held constant over the life of the chart. What it shows is that puts are now gaining on calls on this move…call skew further out the ED curve has diminished appreciably. Contact George Austin at PricingMonkey.com ( george@pricingmonkey.com) or check the Pricing Monkey blog for ideas.
| 9/27/2019 | 10/4/2019 | 10/11/2019 | chg | |
| UST 2Y | 162.2 | 138.8 | 161.6 | 22.8 |
| UST 5Y | 155.1 | 132.4 | 158.2 | 25.8 |
| UST 10Y | 167.5 | 150.7 | 175.5 | 24.8 |
| UST 30Y | 212.5 | 200.4 | 221.6 | 21.2 |
| GERM 2Y | -77.0 | -78.0 | -72.0 | 6.0 |
| GERM 10Y | -57.3 | -58.6 | -44.2 | 14.4 |
| JPN 30Y | 31.8 | 34.6 | 38.3 | 3.7 |
| EURO$ Z9/Z0 | -50.0 | -57.5 | -35.0 | 22.5 |
| EURO$ Z0/Z1 | -8.0 | -5.0 | -7.0 | -2.0 |
| EUR | 109.42 | 109.79 | 110.38 | 0.59 |
| CRUDE (1st cont) | 55.91 | 52.81 | 54.70 | 1.89 |
| SPX | 2961.79 | 2952.01 | 2970.27 | 18.26 |
| VIX | 17.22 | 17.04 | 15.58 | -1.46 |
https://www.federalreserve.gov/boarddocs/speeches/2001/20010427/default.htm
Risk off in US bonds, but risk ON in mideast
Oct 11, 2019
–Yields continued to press higher, with tens up 7 bps to 1.656% as trade optimism leads to paring back of “risk-off” trades. Eurodollars from reds to golds were -8.5 to -7.0. Going into today’s October midcurve expiration, it’s worth noting that Green Dec (EDZ21) has dropped 17 bps in the week from last Thursday to yesterday, 9881 to 9864, bringing the 9862.5 put into play. –While Core yoy CPI remained at 2.4%, the monthly figures were lower than expected. The NY Fed also released its Underlying Inflation Gauge (UIG) yesterday, which showed a drop of 0.1 in the ‘Full data set’ to 2.4%. This measure has been on a downward slide through 2019, having spent the last half of 2018 above 3%. However, energy prices are making an effort this morning to buck the disinflation trend, as an Iranian oil tanker was struck by missiles near a Saudi port. CLX9 is up $1.00/bbl to 54.55. Stocks are also starting the morning with strong gains.
–FFX9 (Nov Fed Funds) was a star performer yesterday, closing +0.5 at 98.36 when every other interest rate contract closed lower on the day. Oct/Nov FF spread settled -19.25, still showing better than 3 out of 4 odds for a cut at the end of the month. However, Nov/Jan is back to -14.5, so forward expectations of easing have, well, eased. The most inverted one-year euro$ spread remains EDZ9/EDZ0 at -43.0, which rallied 5.5 bps on the day. This spread had been around -60 in the early part of September.
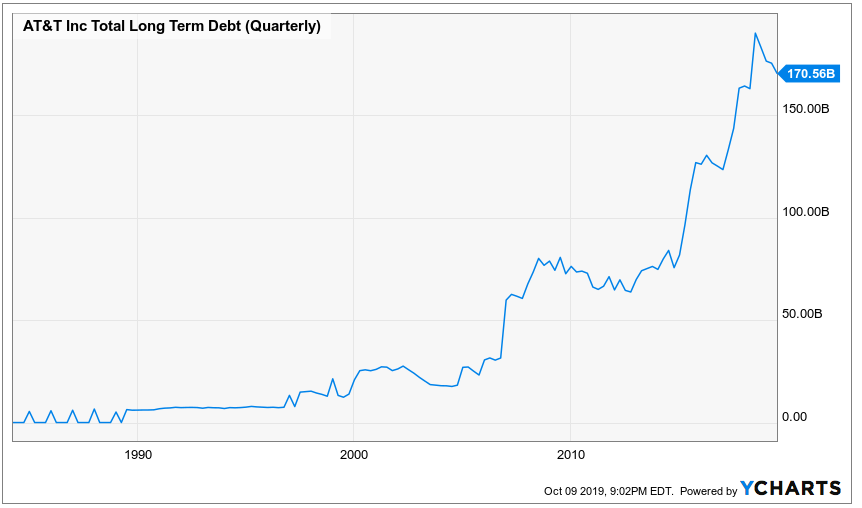
–Below is a twitter chart from @michaelbatnick showing the explosive increase in debt for just one company, AT&T. It shows an increase from around $60b in 2011 to $170b currently. These guys make the federal gov’t look downright miserly (Fed debt has only doubled since 2009).