Nov 19. And….it’s gone!
–Five year note plunged 6 bps to 289.2 Friday, capping a week which saw extreme volatility in energy markets, uncertainty regarding Brexit, and continued stock volatility. ZH notes that a firm named ‘OptionSellers.com’ was blown up by the nat gas move. Yet another premium seller that got caught in a black swan event, which seems to be happening a bit more frequently, one might even say regularly. One of the unintended effects of ZIRP was the reach for yield that heightened the popularity of option selling strategies as a way to corral a few extra bps of yield. “Hold my beer and watch THIS! Ka-BOOM” With the two year note over 2.75%, risk-free yields now provide solid competition for other investments, and at worst case are a safe haven that now pay you to wait for the smoke to clear.
–Ten year note fell 4.8 bps to 307.2. It was the belly which led the curve to lower yields; on the eurodollar strip reds were the leader, closing +7.125. Near eurodollar calendars made new lows. EDZ8/EDZ9 closed 35, down 4.5 on the day to a new low, and EDH9/EDH0 fell to 24.5, just under 1/4%. In early October Dec/Dec was near 60 bps, so the trajectory of Fed hikes has clearly flattened. Fed Vice Chair Clarida’s interview on CNBC further solidified that point, as he shifted the Fed’s focus from normalization to ‘data-dependency’ and acknowledged slower global growth. The idea of quarterly hikes after December should be thrown out the window.
–Economic releases this week are light, but going into the end of the month larger events are looming. After this weekend’s APEC non-agreement, hopes for a Xi-Trump G20 break-through are likely dashed. Brexit and the Italian budget process are also on the docket.
Nov 18. ‘Exactly’
You choose your battles.
Whenever someone in our office asks what’s driving this market or that, one of my colleagues is fond of launching into his explanation, which invariably starts with this line: “I think the easiest way to think of it is to imagine two armies. There is the bull army and bear army. Right now the bull army is overpowering the bear army.” This point is physically emphasized by holding his arms vertically parallel with one hand imaginarily pushing the other back. Never gets old.
In 359 BC, Philip took the crown of Macedon. Through various military exploits, battles and sieges, he subdued many city-states, expanding and consolidating his empire. He then turned to Sparta. He sent warnings in advance. “If I win this war, you will be slaves forever.” Again, “You are advised to submit without further delay, for if I bring my army into your land, I will destroy your farms, slay your people and raze your city.” The Spartans laconic reply was one word: “If”. Both Philip II and Alexander the Great chose to leave Sparta alone. (Wikipedia)
The war of words and tariffs continues with China, with Vice President Pence holding a hard line while Trump on Friday softened the rhetoric. Two RTRS headlines Saturday morning: 1) Trump says US may not impose more tariffs on China 2) Pence vows no end to tariffs until China bows. Not exactly Spartan in terms of clarity.
In any case, the bond bull army took control last week, with TYZ closing higher five days in a row with higher highs and higher lows. The ten year yield dropped 11.7 bps to 3.072% while fives plunged 15.2 to 2.892%. You see, the bull army pushed back the bear army. Many reasons for this, including May’s struggle to retain power as cabinet members resigned over Brexit, weakness in equities, continued issues between the EU and Italy’s budget. All messy affairs.
A couple of days ago mainstream media (NBC news for one) highlighted a NY Fed Microeconomic Data report saying the household debt hit a RECORD HIGH of $13.5 trillion last quarter. Sounds worrisome. But not when one considers that it merely surpassed the nominal peak set in 2008, ten years ago, while GDP has consistently climbed. I.e., ratios have continuously improved. What’s amazing is this: (data from Fed’s Z.1) HH Mortgage debt at $10.2T in Q2 2018 still has not exceeded the record of $10.6T in 2007! In fact, homeowner’s equity in real estate has rebounded from the plunge to 36% at the bottom, back to the pre-crisis level of 60%. Consumer Credit was $2.644T in 2008 and now stands at $3.901, a gain of $1.257T. But $925 billion of that increase is Student Loan Debt, now at $1.56T, owed mostly to the US Gov’t. In actuality, one could say that households have been extremely conservative with credit since the crisis. Perhaps one concern in the report is that aggregate delinquency rates worsened to 4.7%, the largest in seven years. From the report: “This increase was primarily due to a large increase in the flow into delinquency for student loan balances during Q3 2018.” If the Federal gov’t changed the rules and said that borrowers only needed to pay $10 month on all student loans, the delinquency rate would instantly disappear and no one would notice the blip in red ink on the Federal budget relative to the current hemorrhage.
While HouseHold debt isn’t much a concern, the rest of this note concerns corporate debt. The advice here: PANIC. We’ll start with an IMF alarm this week on Leveraged Loans (only $1.3 T but the issues plaguing this segment spill into other corporate lending). From the IMF blog (link below), “This year, so-called covenant-lite loans account for up to 80% of new loans arranged for nonbank lenders (so-called ‘institutional investors’) up from about 30% in 2007. Not only the number, but also the quality of covenants has deteriorated.” The report adds that central banks have been monitoring banks’ exposures, but much of the activity has shifted to institutional investors, which may pose different risks.
Last week both Paul Tudor Jones and Jeff Gundlach gave warnings on the same topic, following Guggenheim’s Scott Minerd tweet on Tuesday that was sparked by GE: “the slide and collapse in investment grade credit has begun.” From PTJ,”We’re going to stress our whole corporate credit market for the first time.” “From a markets perspective, it’s going to be interesting. There probably will be some really scary moments in corporate credit.” Gundlach noted tight spreads, which are starting to widen, but said “…spreads are tighter than you think, because quality has been systematically going down.” “Spreads and debt levels are out of sync with one another.” From ZH, “The BBB rated market, which has the lowest rated corporate bonds, is two-times bigger than the hi-yield market. If those bonds are downgraded to junk, Gundlach said, it will ‘flood’ the high yield market. John Mauldin has also been consistently writing about high corporate leverage and the inevitable reset. Almost Daily Grant’s has similarly highlighted egregious examples of loose credit lending with the possibility (and actuality) of haunting results.
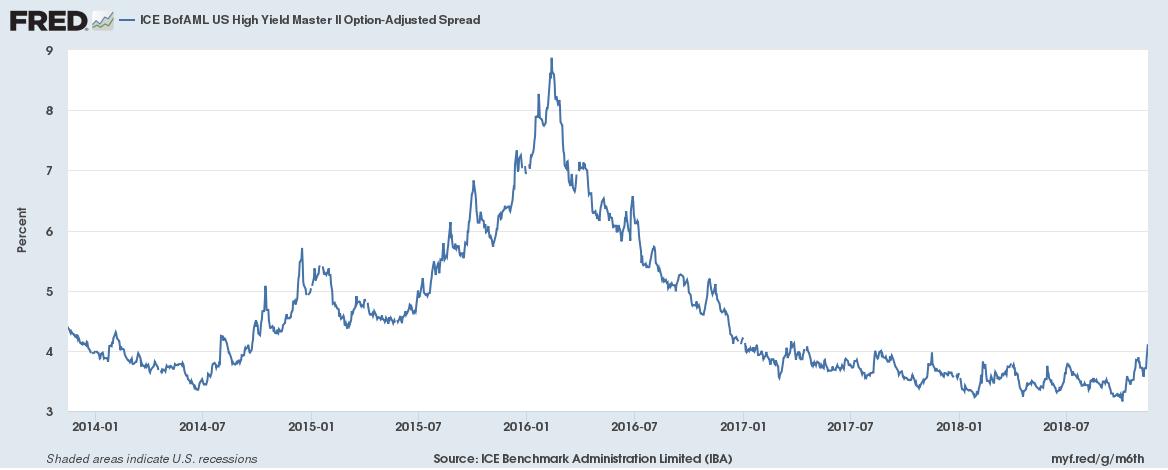
While spreads remain fairly tight and well below levels associated with the energy and EM blow-up of late 2015/early 2016, the ICE BAML High Yield spread from the St Louis Fed website prints 411 bps, the highest since early 2017. (shown below)
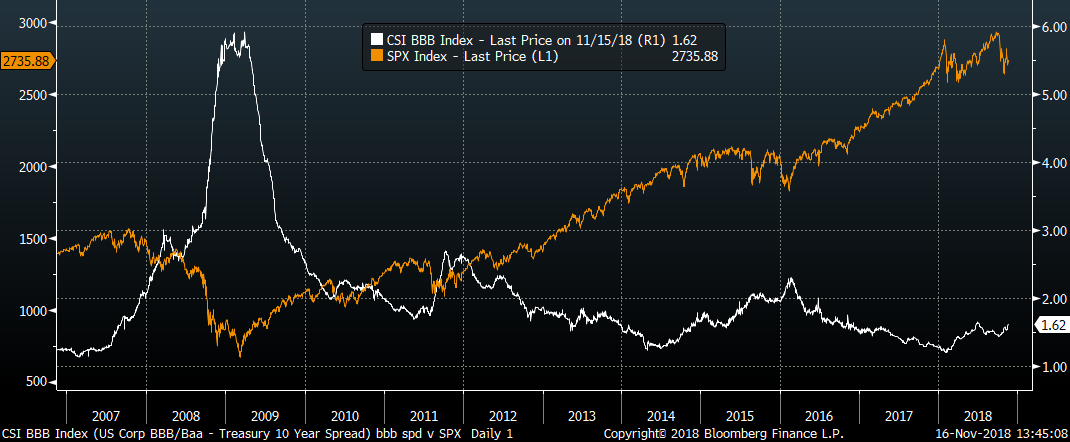
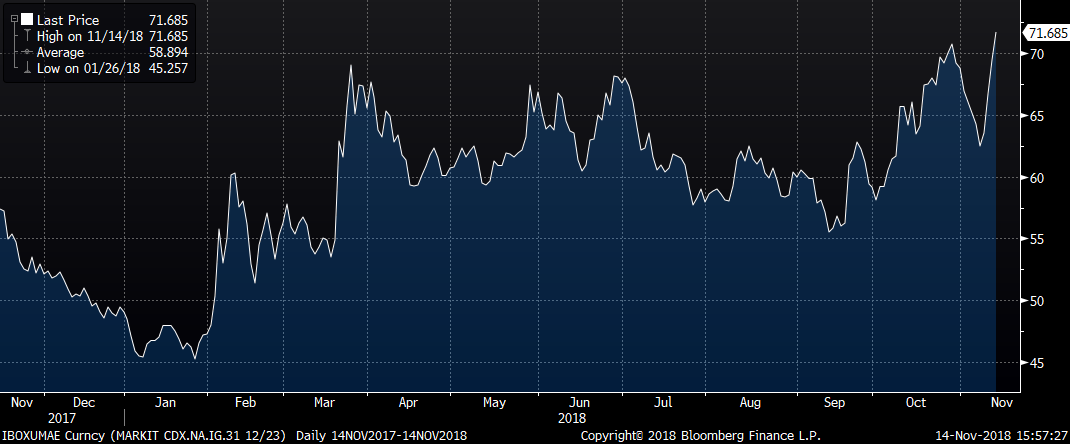
Other indicators of stress are similarly at or near new recent highs. Both IG and HY 5yr CDS made new yearly highs this week. The BBB/Baa spread to ten year treasuries closed at 162 bps, just under the year’s high. The chart below is a long term plot of the BBB spread in white, with SPX in amber. Though it would likely be more instructive with SPX as a log chart, the rise in the spread in 2015 was clearly associated with a stall in equities, and of course energy market problems induced a couple of sharp corrections in late 2015, early 2016.
Action now is similar, except that SPX is over 25% higher now than it was in late 2015.
The question going forward is whether the Fed considers incipient signs of stress as enough to change the trajectory of normalization. Aside from market levels, there are other warning flags. For example, from last week’s NY Fed Business Leaders Survey: “Optimism about the six-month outlook was noticeably lower. The index for future business activity dropped 15 points to 17.3, its lowest level in a year, and the index for future business climate fell to zero, a nearly 40 point drop from its level at the beginning of 2018. The index for planned capital spending rose to 34.2, a multiyear high.” In terms of the Fed’s response, Vice Chairman’s Clarida interview Friday on CNBC was especially instructive. He allowed for 2 to 3 hikes next year, but said that the Fed should now be much more ‘data-dependent’ in setting policy [rather than pursuing a one-track goal of normalization]. Steve Liesman clearly noticed the change and specifically followed up by asking “Is this a shift?” to which Clarida laconically replied “EXACTLY”. (He should have stopped there).
The eurodollar strip has been pricing a fairly ‘tight’ Fed and forecasts a slowdown in late 2019, with EDZ19 and EDH20 being the lowest priced contracts on the curve at 9691.5 or 3.085%. The comments from Clarida were a bell-ringing indication that the Fed is aware of risks to the economy due to tightening financial conditions, and Clarida also noted evidence of a slowdown in the global economy. Those who think the Fed will blindly continue to tighten on a set program until something “breaks” may be on the wrong track… notwithstanding Cramer’s childish admonition late Friday that the Fed ‘doesn’t do its homework’ and that he ‘has better information than the Fed.’ For shame.
The lowest any euro$ contract out to five years has traded has been EDZ0 which printed 9666.5 in early October. Just for the sake of comparison, the low print in EDZ9 has been 9671, in EDZ1 9670, EDZ2 9669 and EDZ23 9663.5. So this area from 9665 to 9670 is powerful support, 3.30 to 3.35%, consistent with a ‘terminal FF rate’ of 3% or so. So with current Fed Effective 2.20, that would indicate 3 more hikes in total. Of course, with this week’s rally, the lowest contract is more than ¼% higher in price, which is more consistent with 2 to 2.5 more hikes. Right in the zone Clarida mentioned.
It’s pretty obvious that if the Fed prematurely pauses, then the treasury curve will likely steepen. I would have liked Liesman to have asked Clarida “If the Fed changes trajectory, will the first change be in balance sheet normalization or FF targets?” I personally think it will be the latter, but that question will surely come up at the December FOMC, now just 21 trading sessions away. What will also happen is that Trump will complain about the December hike, because he simply can’t help himself. The Fed is already thinking about a change in trajectory, but may be wary of large alterations in the message lest it’s mistaken for buckling to political pressure. It should be an interesting end to the year.
OTHER MARKET/TRADE THOUGHTS
Feb/April FF spread settled 13.5, down 3.5 on the week and moving closer to 50/50 odds of a hike in March. May/July settled 9.5, also down 3.5. The front end of the curve is already paring back expectations of further Fed hikes. EDH9/EDH0 closed at a new low of just 24.5, which signifies just one hike over that one-year period. Obviously, firmness in libor/ois has something to do with weakness in the front end, but a decline in hike expectations is dominant.
5/30 year treasury spread closed at a new recent high of 43.5 bps, up 8.8 on the week. The two-year note fell 12.4 bps on the week, so it’s hard to chase the market to the upside, though probably appropriate to buy dips. Five year vol in January appears expensive relative to US. Look to play steepeners by selling FVF puts and buying USF puts. Call for pricing.
| 11/9/2018 | 11/16/2018 | chg | |
| UST 2Y | 293.2 | 280.8 | -12.4 |
| UST 5Y | 304.4 | 289.2 | -15.2 |
| UST 10Y | 318.9 | 307.2 | -11.7 |
| UST 30Y | 339.1 | 332.7 | -6.4 |
| GERM 2Y | -59.7 | -58.5 | 1.2 |
| GERM 10Y | 40.7 | 36.7 | -4.0 |
| JPN 30Y | 88.4 | 85.4 | -3.0 |
| EURO$ Z8/Z9 | 48.5 | 35.0 | -13.5 |
| EURO$ Z9/Z0 | 0.5 | -2.0 | -2.5 |
| EUR | 113.36 | 114.18 | 0.82 |
| CRUDE (1st cont) | 60.36 | 56.68 | -3.68 |
| SPX | 2781.01 | 2736.27 | -44.74 |
| VIX | 17.36 | 18.14 | 0.78 |
https://www.newyorkfed.org/survey/business_leaders/bls_overview.html
https://fred.stlouisfed.org/series/HOEREPHRE
https://blogs.imf.org/2018/11/15/sounding-the-alarm-on-leveraged-lending/
Nov 16. England center stage, but a rate cut by China could provide a shake-up
In dollars, 3EU 9800c 4.0 paid 70k, new. 0EZ 9700c sold at 3.5, new +40k OI. And 2EH 9662p bought 5.5 50k, new, settled 6.0 ref 9689. On balance, trades favored the downside from relatively high futures levels.
Nov 15. Powell and the Pound
Nov 14. We’ve got (global) issues
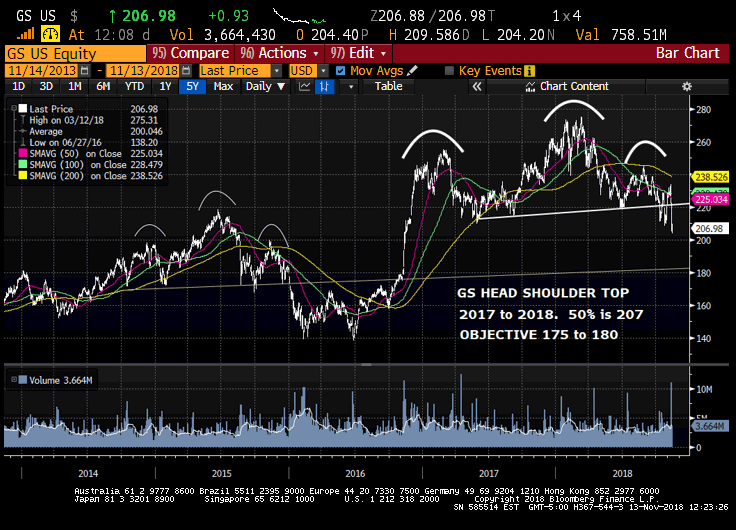
Nov 13. GS technicals
Note: this is not a recommendation. Just a test of technical analysis for pleasure. Goldman has broken through a neckline on a head and shoulder formation on the heaviest volume of the year. Technically should target 175 to 180 at minimum. The 50% retracement from the low of 2016 to the high of 2018 is 207. We’re now below that level.
In: Eurodollar Options
Nov 13. Further signs of slowdown
How do we do it? VOLUME
An abbreviated comment this week…
On the trading floor there were all sorts of nicknames and comments for people, some of which (ok maybe most) were derisive. One referred to a guy who was running a large floor brokerage operation, and someone said, “He woke up on third base and thought he hit a triple.” It’s so stupid it’s funny, but also a reminder that sometimes if you can just ride the wave you don’t need a whole lot of ‘smarts’.
I ran charts with open interest on treasury contracts, and a friend of mine (thanks DW) remarked, “I didn’t realize open interest was that large. It looks like a chart of the CME.”

Sure enough, above is a chart going back to 2007, with the Five-Year futures contract in white, aggregate FV open interest in green, and the share price of the CME in amber.
The CME is an innovative risk-management and risk-transfer institution. It’s on the cutting edge of technology. Markets are deep, liquid and transparent. But the stock price appears to be dependent only on the vast increase of US debt! Sure, open interest growth probably has something to do with the increase in rates (and related hedging demand) since 2016. But a key driver just seems to be that’s there’s a lot more of this stuff.
| All in trillions | Q1 2008 | Q2 2018 | % INCREASE |
| Federal Debt | 9.438 | 21.195 | 225% |
| Federal Debt Held by Public | 5.334 | 15.484 | 290% |
| Federal Reserve Balance Sheet | 1.2 | 4.1 | 342% |
| US GDP | 14.6 | 20.6 | 141% |
| FV Aggregate Open Interest (mio) | 1.82 | 4.76 | 262% |
It seems clear that open interest is dependent on the amount of Federal Debt Outstanding. It also seems pretty obvious that the boost in government debt hasn’t had as much of an effect on GDP growth as one might think. But it’s just as clear as a bell that what matters to the stock price is treasury open interest, driven by debt increases! Which brings me back to a Stanley Druckenmiller excerpt from a speech in 2015: “The other thing he taught me is earnings don’t move the overall market; it’s the Federal Reserve Board. And whatever I do, I focus on the central banks and focus on the movement of liquidity. Most people in the market are looking for earnings and conventional measures. It’s liquidity that moves markets.”
Of course we all know that correlation may have nothing to do with causation. However, the current theme with the Federal Reserve is a withdrawal of liquidity, which acts as a net negative for overall equity prices. As Citi said in a recent note, the combination of large budget deficits and balance sheet withdrawal create a situation where domestic savers must be relied upon to clear the (bond) market.
A quick survey of the week’s action finds treasury yields at or near new highs. The dollar index is also at a new high for the year. The CRB commodity index is very near the low of the year as WTI crude has plunged over 20% from the high close in early October. The euro$ curve remains inverted from reds to greens and greens to blues. SPX, Nasdaq and DJIA are still higher on the year, but Russell and DJ Transports are about flat or lower. The markets are signaling that the Fed is on the verge of being too tight, but official employment and inflation data suggest that more rate hikes are in order. Of course the Fed wants more ammo to fight the next downturn; it might be the case that Barney Fife’s fiscal bullet has already been spent. If a downturn does indeed materialize, then automatic fiscal stabilizers will only worsen the deficit and grow the supply of bonds. (So buy CME?)
The driver seems to be front loaded fiscal stimulus and a Fed that is leaning against the growth that is filtering through the economy, perhaps at a decreasing rate. A political dynamic between the White House and the Fed complicates the picture. The next Fed meeting is just over 5 weeks away. Prior to that I wouldn’t be surprised if there are hints of a slowdown in balance sheet reduction.
By the way, if you look closely at the chart above, you can see that CME stock declined marginally in 2011. Yes, that’s when they de-listed the pork belly contract. But treasury supply was even able to overcome that particular misstep from CME management…
OTHER MARKET THOUGHTS
Ten year treasury yields tickled new highs on Thursday, but pulled back Friday in spite of higher than expected PPI data, Core yoy +2.6%. On Wednesday Core CPI is expected +2.2%. A 2-yr yield that approached 3% this week provides strong competition for stocks. On the longer end tens left a (temporary?) double top just shy of 3.24%.
There has been a decent amount of call accumulation in Feb TY calls, which expire January 25, just prior to the January FOMC which is on the 30th. January TY options expire on December 21, just after the December FOMC on the 19th. Recall that beginning next year, every Fed meeting will have a press conference.
| 11/2/2018 | 11/9/2018 | chg | |
| UST 2Y | 291.0 | 293.2 | 2.2 |
| UST 5Y | 303.6 | 304.4 | 0.8 |
| UST 10Y | 321.2 | 318.9 | -2.3 |
| UST 30Y | 345.3 | 339.1 | -6.2 |
| GERM 2Y | -63.0 | -59.7 | 3.3 |
| GERM 10Y | 42.0 | 40.7 | -1.3 |
| JPN 30Y | 87.0 | 88.4 | 1.4 |
| EURO$ Z8/Z9 | 46.5 | 48.5 | 2.0 |
| EURO$ Z9/Z0 | 1.0 | 0.5 | -0.5 |
| EUR | 113.88 | 113.36 | -0.52 |
| CRUDE (1st cont) | 63.14 | 60.19 | -2.95 |
| SPX | 2723.06 | 2781.01 | 57.95 |
| VIX | 19.50 | 17.36 | -2.14 |
Nov 9. It might not be perfect, but a storm of some sort is brewing
Nov 8. The Shakeout begins
Goodbye Mr Magoo

A couple of technical notes inspired by colleague RW who relates these data to calendar spread rolls.
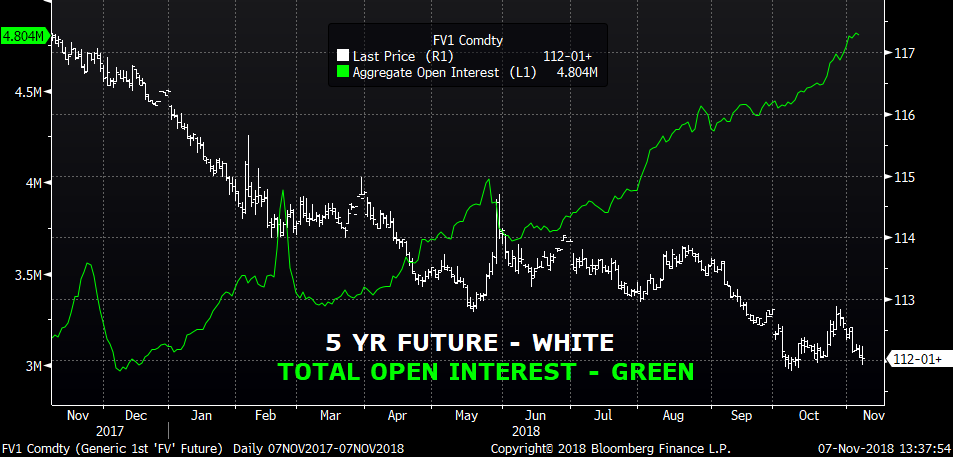
Peak 2yr open interest in May 2.301m contracts, Drop in June to 1.781m, Increase in the past three months 1.957 on Aug 6 to 2.476m now, an increase of 520k or 26% RECORD OI
Peak 5yr open interest in May 4.020m contracts, Drop in June to 3.681m, Increase in the past three months 4.174 on Aug 6 to 4.804m now, an increase of 630k or 15% RECORD OI
Peak 10yr open interest in May 4.185m contracts, Drop in June to 3.383m, Increase in the past three months 3.773 on Aug 6 to 4.260m now, an increase of 487k or 13% RECORD OI
Peak 10 ultra open interest in May 605m contracts, Drop in June to 528m, Increase in the past three months 573 on Aug 6 to 667m now, an increase of 94k or 16% RECORD OI
Peak 30yr open interest in May 939m contracts, Drop in June to 801m, Increase in the past three months 840 on Aug 6 to 926m now, an increase of 86k or 10%
Peak Ultra open interest in May 1.099m contracts, Drop in June to 964m, Increase in the past three months 1.031 on Aug 6 to 1.071m now, an increase of 40k or 4%
Open interest is at record levels in the: Two Year, Five Year, Ten Year, Ultra Ten Year. Does this represent activity In rate etf’s? Due to unwinding of Fed’s balance sheet? Should it partially lead to option premium demand? Clearly the increases in the short end are related to hedging activity given Fed rate increases.