
Sept 24. FOMC week
–This week brings the Sept FOMC on Wednesday. Treasury auctions 2, 5 and 7 year notes on Monday, Tuesday and Thursday.
In: Eurodollar Options
Sept 23, 2018. Fiscal Debt Helium
Probably the most important news regards US/China trade negotiations and the fact that China cancelled an official visit from Vice Premier Liu-He.
“Everything the US does hasn’t given any impression of sincerity and goodwill. We hope that the US side will take measures to correct its mistakes.”
(Is this why someone bought >100k Dec VIX 17 calls for 1.70 on Friday?)
About a week ago David Tepper of Appaloosa was on CNBC saying that if the China trade situation wasn’t resolved, then US equities were at risk of a significant correction. This week’s note considers the possibility of US treasuries being in a bear market. If a decline in stocks materializes, will it change the Fed’s trajectory or cause a large flight to safety? Perhaps, but longer term, even a decline in asset values may not support the long end.
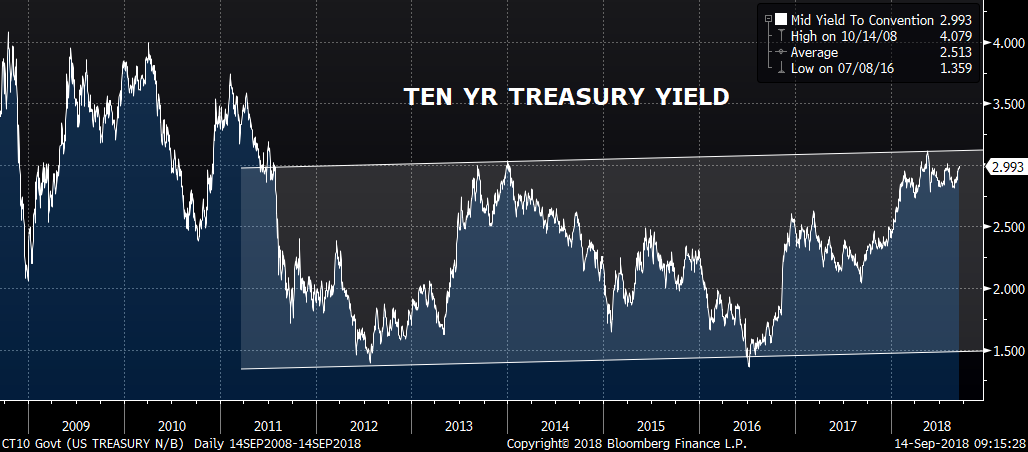
The ten-yr yield chart below is simply bearish, in my opinion. It shows a breakout to higher yields which had, as its impetus, the election of Donald Trump, the man who loves debt. I think the trend for longer dated US paper has changed, in large part due to supply considerations.
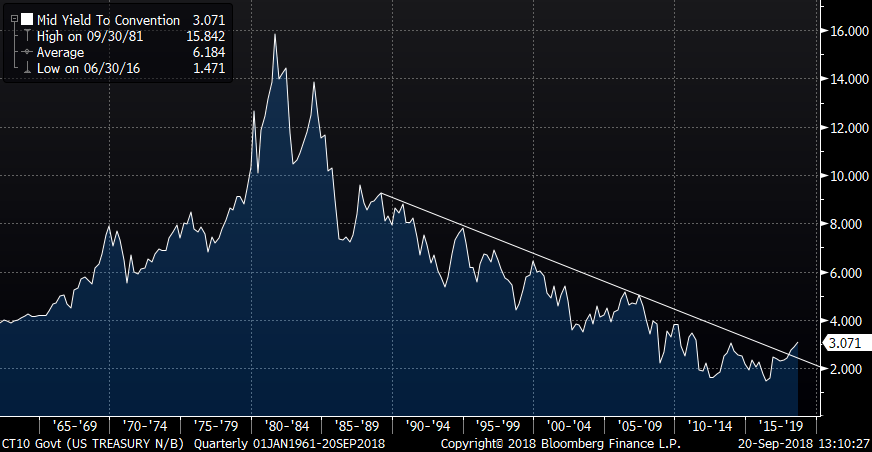
Currently, US growth is on a hot streak, spurred in large measure by government borrowing and spending. Sure, reduced regulations also figure into the equation. It’s possible this deficit spending could spark future growth and thus ‘pay for itself’. But for now, some are concerned about a ‘sugar high’. Whether current growth is temporary or not, it might be bearish for longer dated paper either way.
Last week’s Z.1 quarterly report form the Fed showed the growth rate of Fed’l Gov’t borrowing was robust at a 6.9% annualized rate in Q2. While lower than last quarter, it was still the top category. The next highest total was corporate/business at 4.6% and then Households at 2.9% (link to Z.1 summary at bottom).
Let’s look at gov’t debt as a percent of the total amount of debt outstanding: Q2 2018 ended with $17.460T outstanding federal government debt. That’s 34.4% of the total domestic debt of $50.710T. With Fed plus State and Local, it’s 40.5%. By comparison, at the end of 2007 (pre-crisis), Federal debt as % of total was 18% (Fed plus State and Local was 27%). 5 years ago in 2012: Federal was 31.8% of total. And when including State and Local 39.6%. It was necessary to shift private debts onto the federal balance sheet in 2008/2009. But it looks like WE’RE STILL DOING IT! In the last 5 years Federal govt debt as percent of total went from 31.8% to 34.4%. That’s not normal and could lead to crowding out.
“For the quarter, Federal Expenditures were up 6.0% y-o-y, while Federal Receipts were down 2.0%.” That quote is from Doug Noland’s CBB. Doesn’t appear sustainable.
So the footprint of the Federal Gov’t is getting like Sasquatch. In terms of stocks, it’s somewhat interesting that as the gov’t has started to turn more attention to negative aspects of big tech, the sector has taken a downturn with NYFANG off 10% from June’s highs while other indices are near new highs.
In terms of the financial crisis, many say it occurred because no one thought that house prices could go down. Well, that’s part of it, but the real reason for a CRISIS is that prices or cash flows from highly leveraged assets decrease, and debts can’t be serviced. If everyone owned their homes outright in 2008, then a price drop wouldn’t have made much of a difference. But in 2002-06 I knew people who were extracting cash every time they went to refinance their mortgages. So what happens when it’s government and not the household or business sector that has excessive debt? Then it’s time for Christine Lagarde and the IMF.
Now I want to turn to another article I skimmed on ZH citing Albert Edwards of SocGen. Here’s a key excerpt.
“As the bond rout continues, the biggest call investors have to make is whether the break of the multi-decade downtrend marks the end of the secular bull market. This is the big one. Get on the wrong side of a new multi-year bear market in government bonds and all investment portfolios will be shredded to ribbons, as bonds are the cornerstone of most equity valuation models.”
Edwards ponders the yield rise and its causes, and whether a recession is six months away (as it was in 2007). For possible catalysts, he cites rising real rates (I’ve noted that the 5y tip yield has broken out to new highs) and allows that Brainard’s speech (which I covered last week) was a bearish factor.
In terms of a recession call, the back end of the eurodollar curve has been signaling forward problems for a long time, with contracts from late 2019 to 2021 inverted. But what happened last week? There‘s still inversion, but a lot less of it. For example, EDZ9/EDZ0 which has been heavily traded, flipped from negative 2.0 a little over a week ago to +2.5 on Friday. Perhaps not a huge move in terms of bps, but a very interesting change in dynamics if it continues. Once again I review the key take-aways from Brainard’s speech: The neutral rate is RISING as rates in general rise, and the TERM PREMIUM might bounce back.
Consider the chart below, which is the ten year treasury yield in white, versus the red/gold eurodollar pack spread (curve proxy) in amber.
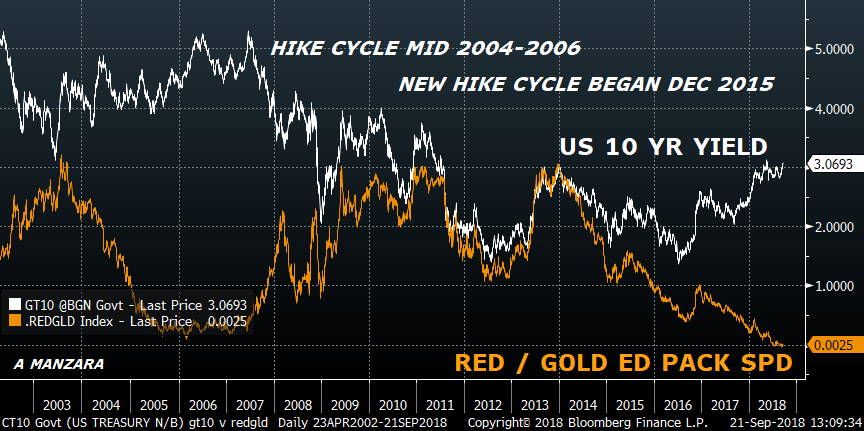
As you can see, the red/gold pack spread is near zero even as the ten year yield is 3.07%. The spread between the two isn’t at its greatest; in 2006/2007 it was at a maximum. However, the percentage change in the ten year yield is greater during this hiking cycle than it was in 2004/06. Greenspan’s ‘conundrum’ has vanished.
The curve began to flatten in 2004 before the actual hiking started, and the same thing occurred to larger degree in 2014/15 prior to the first hike. What is intereting is 2013, during the taper tantrum. Yields went up in general AND the curve steepened. Could that happen again? We’re seeing a move to higher Japanese yields at the long end as the BoJ shuns that part of the curve. No one is set up for the bear steepener.
In 2006/7 the debt was on the shoulders of households. As home values fell it was pretty obvious that inflation would decline which would spur a bid for treasuries. Now the debt is becoming more concentrated in the Federal Gov’t. A lot of the demand for that debt comes from foreign entities. What happens on a buyer’s strike? As Druckenmiller says: Don’t think of how things are now, think of how they MIGHT look six months to a year from now and position for that. Does government debt matter? In the words of the debt-king president, “We’ll see.”
Fed meeting and Powell’s press conference should be interesting. Separation of stock market values and the real economy is likely to be a theme; don’t expect a ‘Powell put’.
| 9/14/2018 | 9/21/2018 | chg | |
| UST 2Y | 277.8 | 280.0 | 2.2 |
| UST 5Y | 289.6 | 295.2 | 5.6 |
| UST 10Y | 299.0 | 306.6 | 7.6 |
| UST 30Y | 312.8 | 320.4 | 7.6 |
| GERM 2Y | -53.8 | -53.3 | 0.5 |
| GERM 10Y | 45.0 | 46.2 | 1.2 |
| JPN 30Y | 83.9 | 83.9 | 0.0 |
| EURO$ Z8/Z9 | 49.0 | 48.0 | -1.0 |
| EURO$ Z9/Z0 | -2.0 | 1.5 | 3.5 |
| EUR | 116.22 | 117.49 | 1.27 |
| CRUDE (1st cont) | 68.77 | 70.78 | 2.01 |
| SPX | 2904.98 | 2929.67 | 24.69 |
| VIX | 12.07 | 11.68 | -0.39 |
https://www.youtube.com/watch?v=sCnwOjgVdog
https://www.federalreserve.gov/releases/z1/20180920/html/d1.htm
https://www.usgovernmentspending.com/percent_gdp
In: Eurodollar Options
Sept 21. Sentiment tweak
–Curve flattened Thursday as front end dollars reacted negatively to a higher 3m libor setting (+1.3 bps to 2.3664). EDZ8 fell 2.5 to 9732.5 on long liquidation, while FFF9 was unchanged at 9762.5, so this spread settled at 30.0. Equities floated to new highs in front of today’s quad witching.
–One interesting exit trade was EDZ8 9725p vs 0EZ 9662.5p, with paper paying 0.5 for 45k, buying the 0EZ put. The market appears a little more sensitive to the idea that there’s open ended risk on reds and greens. This is perhaps, exemplified by settlements of some of the long dated put ratio trades. In mid-July EDZ0 9600/9550 put 1×4 traded flat 25k x 100k, paper sold the 9550 puts. Yesterday the settlements were 10.25 and 3.75, so 4.75 to the 9550 puts. Next week brings the September FOMC meeting. I had thought there might be softening of language regarding the trajectory of hikes, but with stocks and labor markets strong, that idea was misguided. Brainard last week noted that the Fed thinks stocks are overvalued; it’s likely that the Fed is more willing to lean against the trend.
Interesting link on Japan 30-year yield pushing to a new high near 90 bps…
In: Eurodollar Options
Sept 20. New high
In: Eurodollar Options
Sept 19, 2018. Sometimes it just gets away from you
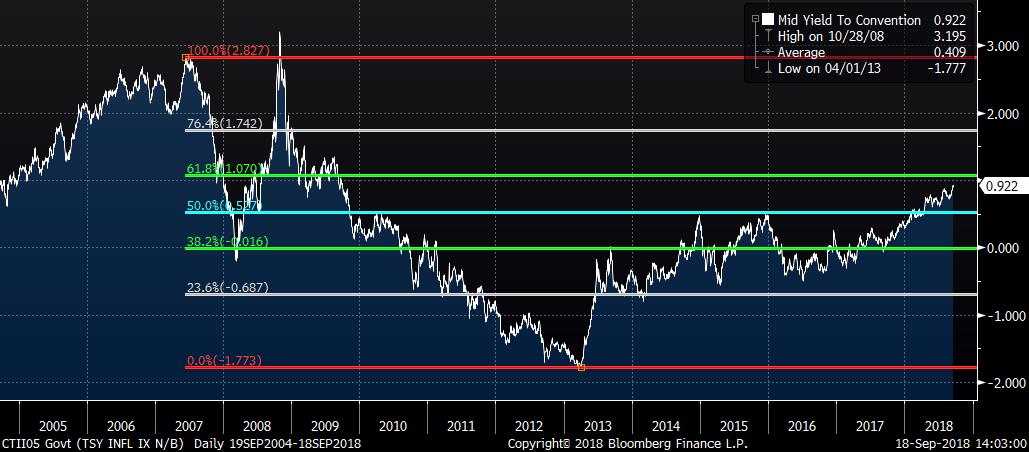
–There are a lot of things which should be supportive of US fixed income. EM currencies still appear vulnerable (new low India Rupee for example), some commodity prices are sliding (new low beans yesterday). However, yields are marching higher. Yesterday the 2y hit a new high 279.3. In the 5y, the high yield in mid-May was 294, at floor close it was 292.7, but by the end of electronic it had firmed to a new high just over 294. (Chart of inflation index 5y below, also a new high). Ten year high in May was 311.2 and in the 30y it was 324.7, vs 318.8 close. In 1994, when the Fed began a fairly aggressive hiking policy after over a year at the then historic low of 3% fed funds, things sort of spun out of control, with the Tequila Crisis (MXN peso devaluation in December 1994) one of the results. Interestingly China’s Premier Li says China won’t weaken its ccy in response to trade tensions. We’ve all had trades get out of hand, and clearly the Fed has had things slip away a couple of times, including the GFC.
–Yesterday saw bear steepening, with tens +4.4 bps by floor close to 304.4 and twos up only 1.5 to 279.5. The red/gold (2nd year to 5th year) euro$ pack spread rose 2.5 bps to close just negative at -0.625 bp. Near one-year eurodollar calendars all made new highs with EDZ8/EDZ9 +2 on the day to 51. There continues to be heavy activity in one-year March midcurves. Yesterday a new buyer of 50k 0EH 9650p mostly at 3.5. Settled 4 ref 9684.0. Last week buyer of 250k 0EH 9687/9662/9637p fly 1x3x2; probably not the same player, but the fly is exposed on a break to lower strike (as are all the open put shorts from the long dated ratios).
In: Eurodollar Options
Sept 18. Who cares about tariffs?
In: Eurodollar Options
Sept 17, 2018. ‘Beautiful counter-attack’
In: Eurodollar Options
Sept 16. Brainard the Bear

The picture above was being circulated Friday afternoon, purportedly the last shot taken by wildlife photographer Michio Hoshino in eastern Russia in 1996, minutes before he met his untimely demise. The article that I saw said that the image was found much later as the film in the camera had only recently been developed. However, upon looking for the image this weekend I saw a Snopes piece that debunked the story. Fake news. This bear did not maul Hoshino to death; the image was from a photoshop competition. That’s good. On the other hand, Hoshino was in fact killed by a bear on a wildlife shoot. That’s bad.
It’s getting hard to decipher the news, and that goes for market information as well. For example, I’ve seen many articles saying that Commitment of Trader (COT) reports depict record amounts of speculative treasury shorts. However, I saw a post on TheMacroTourist.com citing the work of Adam Collins of Movement Capital that questions those assertions. I’m not certain the analysis is valid, but the ten year surely does NOT trade like there’s an uncomfortable short position praying for a chance to cover without blowing the lid off the market. My thought has been that the advent of bond etf’s and other trading vehicles has perhaps distorted the data and made signals other than price less important.
https://www.themacrotourist.com/posts/2018/09/10/thebigshort/
Let’s take a quick look at price. Yields went up this week, especially on the short end, with the two year note +7.5 bps to a new high of 2.778%. PPI and CPI and Retail Sales were softer than expected and yields rose. There’s an old maxim: when news is bullish but the market doesn’t go up, that’s bearish. Right back to our initial snarling image at top. Perhaps more important was Brainard’s speech on Wednesday. She had been the most important dovish voice on the Fed, but this speech was unambiguously hawkish. She noted a difference between the long and short term neutral rate.
This year, the unemployment rate has fallen further, and job market gains have gathered strength, at the same time that the federal funds rate has increased. This combination suggests that the short-run neutral interest rate likely has also increased. If, instead, the neutral rate had remained constant as the federal funds rate increased, we would have expected to see labor market gains slow. That inference is consistent with the formal model estimates, which indicate that the shorter-run neutral rate has gone up as the expansion has advanced.
The shift from headwinds to tailwinds may be expected to push the shorter-run neutral rate above its longer-run trend in the next year or two, just as it fell below the longer-run equilibrium rate following the financial crisis.
Got it? The neutral rate is a moving target and it’s going up. She then ties the short-end neutral rate to the curve, and indicates that ‘term premium’ is also a moving target which has been depressed by central bank purchases.
These developments raise the prospect that, at some point, the Committee’s setting of the federal funds rate will exceed current estimates of the longer-run federal funds rate. Indeed, the median projection in the SEP has this property. This raises the possibility of a flattening or inversion of the yield curve in the event that term premiums do not rise from their currently very low levels.
As friend WHM concluded, “There are no more doves on the Fed.” Even Chicago’s Evans has changed his tune, who this week said rates should rise, as the economy is performing well, and that he’s “more comfortable with the inflation outlook.”
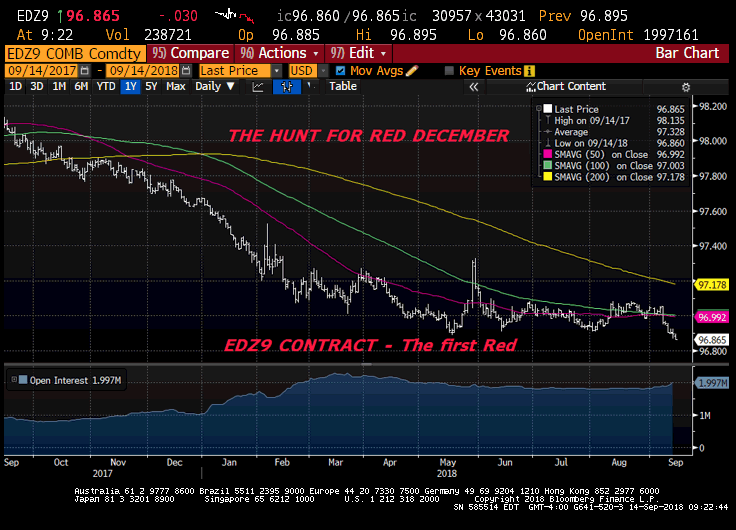
Let’s consider Eurodollars and the messages being sent by large trades and by open interest. In January I wrote a post entitled Red December. This was and still is the December’19 contract, but as of Monday EDZ9 will be the first red. I wrote at the time that EDZ19 was seeing massive gains in open interest. On January 5th, there had been a seller of 125k EDZ8/EDZ9/EDZ0 butterfly at 15 to 14.5. This fly, like many of the near butterflies, settled at a new high Friday of 51.0. EDZ8/EDZ9 settled at a new high of 49.0, having exploded from 39.5 last week, while EDZ9/EDZ0 closed at -2.0. There has been heavy outright selling of EDZ’19, and additional pressure on the contract due to related buys of calendar spreads. For example, large buying of EDU9/EDZ9 last week for 5.5 (settled there on Friday).
In the beginning of the year, total open interest in euro$’s was 12.745 million. By the middle of January it had surged to 14.367m. Currently it’s 15.008m In terms of EDZ’19, by March the open interest in that contract alone was well over 2 million, and as of Friday it once again pushed over 2 million, being the largest OI of any contract on the strip, with the next closest being EDZ18 at 1.8 million. EDZ19 made a new low this week, as did the contracts in the immediate vicinity, including EDH20. What is interesting about EDH20, is that there was a huge targeted trade on that particular underlying: a buy of 250k 0EH 9687.5/9662.5/96.375 put butterflies as 1 x 3 x 2 at premium of 1.5 to 2.5. This means that he bought the upper put spread once and sold the lower put spread two times. Assuming a price of 2.5, the top breakeven is 9685, and the lower breakeven is 9651.25. Maximum loss is below 9637.5. Below the lowest strike at expiry, the top put spread fills out to 25, but the lower put spread also fills out for a loss of 50. The target is the middle strike, 9662.5, against a current price of 9685.5. Given that the September FOMC is essentially fully priced for a hike, and that odds for a December hike are better than 75%, this trade can be thought of as a play for an additional move in March.
Below is a chart of EDZ19. New lows with a rise in open interest helping to confirm the move. That’s not to say that there won’t be some consolidation. However, the sentiment and price action are clearly bearish. Eurodollar trades are saying the market is going lower but will perhaps be limited on the downside. Longer term one-year calendars from late 2019 to 2021 signal that higher rates will, by that time, seriously slow the economy.
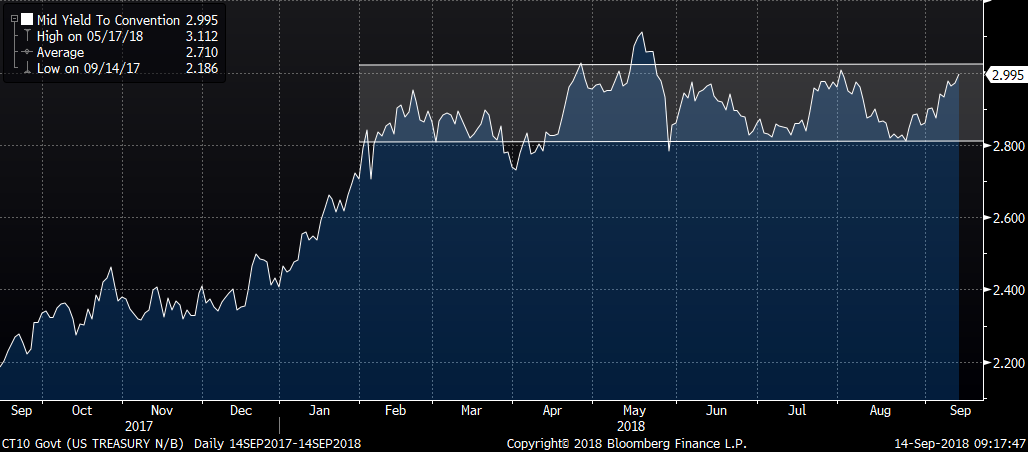
Now let’s take a minute on the longer end. The ten year yield closed out the week just below 3% at 2.961%. As the charts below indicate, just above the 3% area is resistance, from both a short and long term perspective. The high close of the year has been 3.11% set in May. It appears as though increased supply is starting figure into pricing, and tentative signs of consolidation in some of the EM currencies may tend to diminish the bid for treasuries, if only at the margin.
My personal bias had been that there might be a near term pause in tightening, and that the curve would steepen as a result. Brainard squashed those ideas. Even a pull back in stocks doesn’t seem likely to sway the Fed. As Brainard notes, “…equity valuations are elevated relative to historical patterns.”
In: Eurodollar Options
Sept 14. Insurance
–Hurricane Florence is making landfall in the Carolinas. Time for insurance. Well, probably should have had insurance in place already.
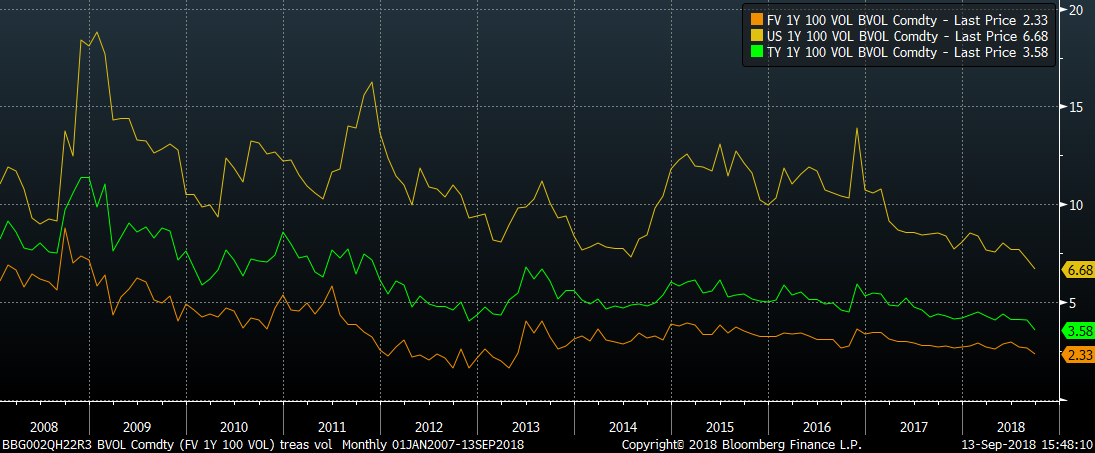
–The interest rate options market is the polar opposite. Not a ripple on the horizon. As the chart below shows, long maturity treasury implied vol is making all time lows (or close enough). The five year? That’s holding above the lows made in 2012 and 2013, prior to the ‘temper tantrum’. So let’s take a closer look at that time. In May of 2013 the onset of the taper tantrum roiled the markets. The ten year yield exploded from around 1.75% to nearly 3% in September, then pulled back, finally closing out the year with a re-test of 3%. Implied vol on the treasury future in December of 2013 ranged from about 5.8% to 5.2%. It wasn’t a crazy panic bid for premium, although in the late summer and fall vols were higher. To give an example, TYZ 119.5^ settled yesterday 1’25. If vols were back at Dec 2013 levels, that straddle would be a full point higher at 2’25.
–So the five year treasury yield is the highest it’s been since 2009. The inflation indexed 5y yield is at a new high of 88.8 bps. And there is no reach whatsoever for premium. Who needs insurance? Inflation isn’t accelerating and the Central Banks have us covered. It’s not like we have a nut like Erdogan running things which necessitated a 6.25% rate hike…
–Of course, there wasn’t an actual hike by the Fed in 2013, and at the end of the year, the first green euro$ (9th quarterly) was around 98.50 or 1.5%. Yesterday EDU0 settled 96.91. I suppose it makes sense, as the curve has flattened. Since late 2015 there have been seven hikes, and the 9th euro$ contract is around 160 bps above where it was in late 2013. Maybe there’s a few more hikes to reach neutral, but there’s no use in buying puts (?)
–A story yesterday in the FT says ‘Trader blows €100m hole in Nasdaq Power Market’. “The catalyst for the trading loss was a series of backfiring bets on the price difference between German and Nordic power markets, according to multiple sources in the industry. Mr Aas’s trades were positioned for the gap between the two to narrow, but instead it widened sharply to a level 17 times larger than normal.” As is often tossed around in this business “That’s a (insert your number here) standard deviation move. That should only happen once in 150 years.” Right. When they were using coal and wood. Sometimes the stuff just gets away from you.
–Another 50k 0EH 9687/9662/9637p fly 1x3x2 were blocked, paying 2.0 and 2.5 but both covered 7 delta vs 9688.5 (so slightly better). Settled 2.25 vs 9689. Randolph Duke: ‘You see Mortimer? William has ALREADY made us money.’ Billy Ray Valentine, “You want me to break something else?”
https://www.youtube.com/watch?v=vkkM9YAJ-Ts
Five, ten and thrity year treasury vol
In: Eurodollar Options
Sept 13. Clubbing Red Dec
–Some large trades of note yesterday. First, rates eased slightly, with tens down 1.8 to 296.1. The only contract in the first 8 years on the eurodollar strip that was unchanged (all others were up 0.5 to 2.0 bps) was EDZ19, red dec, which was mercilessly sold on volume of about 140% of the next most active contracts. Open interest rose by 47k according to prelims. This contract is the peak open interest of any contract with nearly 2 million, a remnant of heavy trade early in the year of EDZ8/EDZ9 spread trades. So this is new selling, and EDZ8/EDZ9 settled at a new high of 44.5 bps. Also worth noting is that we’re two weeks away from the FOMC and new dot projections. I think the Fed’s SEP has encouraged trading in Dec contracts as the projections are for year-end. In any case, the 2019 end of year Fed projection for FF was 3.1, up from 2.9 in March. EDZ9 settled at 9690.5 or 3.095%. Add in a spread for lib/ois and there’s room for downside (if one believes in dots). However, rarely have the market and the Fed been on the same page in the history of the SEP. (I would touch upon a few aspects of Brainard’s somewhat hawkish speech yesterday, but don’t have the time…).
–The other huge trade yesterday was on the same part of the curve: Buyer of 200k 0EH 9687/9662/9637p fly 1x3x2 (so +200k/-600k/+400k). Max profit at expiry is at center strike. So this trade, with EDH20 underlying, is also sort of in line with Fed dot projection. Trade currently has call delt of about 6. Traded average 1.75 bps on blocks. According to my rudimentary model, if vol was flat on the downside this pkg would have traded zero premium; the downside is, and has been, crushed, due in part to the long-dated red and green put ratio trades. In any case, the trade is a new position. 0EH 9662p settled 5.5, with a ‘normal’ skew should be more like 7.
–The curve reflected the weight in red dec in a more general (trending) way. Near calendars made new highs, and the back end of the curve flattened to new lows. For example, reds to blues (2nd year to 4th year) made a new low of MINUS 4.875 bps and reds/golds to -3.25. While 2/10 treasury was only -1.5 to 21.5, the 5/30 notched a new low at 23.3. Brainard and the rest of the Fed seem to favor 3m to ten year as their curve measure, but back end of the ED curve is signaling slower growth.
–One other trade worth mention: buyer 50k FFF9 9763.5 to 64.0. Exit trade, squeezed as much as possible out of that particular stone which reflects high odds of 2 more hike by year end. (OI -30k)
–CPI data today expected +0.2 across the board. YOY expected 2.9% with Core 2.4%. 30 year auction as well. ECB this morning.
In: Eurodollar Options

